08448380779 Call Girls In Friends Colony Women Seeking Men
Using methanol for power generation
1. R.J. Murray and H.I. Furlonge: Market and Economic Assessment of using Methanol for Power Generation 88
ISSN 1000 7924
The Journal of the Association of Professional Engineers of Trinidad and Tobago
Vol.38, No.1, October 2009, pp.88-99
Market and Economic Assessment of Using Methanol for Power
Generation in the Caribbean Region
Renique J. Murraya
and Haydn I. Furlonge bΨ
Natural Gas Institute of the Americas, The University of Trinidad and Tobago,
Pt. Lisas Campus, Esperanza Road, Brechin Castle, Trinidad, West Indies
a
E-mail: Renique.Murray@utt.edu.tt
b
E-mail: haydnfurlonge@yahoo.com
Ψ
Corresponding Author
(Received 15 May 2009; Revised 19 August 2009; Accepted 23 September 2009)
Abstract: The cost of electricity is an important factor for sustainable development of countries in the Caribbean
region. Due to current reliance on oil derivatives (diesel and fuel oil), these economies are susceptible to high
prices and volatility. It is proposed here that methanol, traditionally a feedstock for petrochemicals, is an
alternative fuel for power generation, requiring only minor modifications to existing infrastructure (such as plant,
storage, import facilities and shipping). Modifications would address the particular fuel properties of methanol in
terms of its relatively low heating value, low lubricity and high inflammability. In order to assess its overall
economic viability, an integrated economic model of the entire methanol to power (MtP) chain is developed in this
paper. Based on preliminary cost estimates, it is shown that the use of methanol in new gas turbine installations or
retrofitted turbines and reciprocating engines may be cheaper than conventional fuels due in part to the lower
market price on an energy equivalent basis. This is found to be the case especially in smaller markets which
currently use fossil fuels only in reciprocating engines. However, certain countries, typically the larger ones, obtain
discounted prices for diesel, which makes MtP less favorable. The extent to which renewable energy forms part of a
country’s energy mix also impacts MtP’s competitiveness. Nonetheless, a reduction of up to about 10 US cents per
KWh can be realised, with a potential regional MtP power market size of about 6000 MW or 16.2 billion kWh of
electricity generated annually. Hypothetically, this would result in an incremental methanol market of roughly 7.1
millions tonnes per annum requiring 626 MMscfd of natural gas.
Keywords: Methanol; alternative fuel, gas turbine; Caribbean power market
Nomenclature
Am Discount factor
COx Oxides of carbon
CNG Compressed natural gas
FFB Fossil fuel based
GP Country replaceable generating capacity
H.R. Machine heat rate
H.V. Fuel heating value
IL Labor cost index
IP Power generation cost index
IR Retrofitting cost index
IS Shipping cost index
IT Storage tank cost index
LNG Liquefied natural gas
MtP Methanol to power
NOx Oxides of nitrogen
Pm Methanol market price
POpex Power plant operational expenditure
PR Cost of retrofitting
PS Shipping costs
PCapex Power plant capital expenditure
r subscript refers to reference data
αP Power plant scaling factor
αT Storage tank scaling factor
1. Introduction
Methanol is primarily known for its use as a
chemical feedstock, for instance in the production of
formaldehyde and acetic acid. It can also be used to
produce olefins and other longer chain hydrocarbons
such as proteins and gasoline (Olah et al., 2006),
although these applications are not as extensive.
However, as these markets develop, there are
significant implications in the light of potentially
peaking global crude oil production (Campbell,
2. R.J. Murray and H.I. Furlonge: Market and Economic Assessment of using Methanol for Power Generation 89
2002). Methanol’s use is not restricted to chemical
production. One such example is that methanol has
been proposed as a solution to addressing stranded
gas fields; the key advantages being increased safety
and a potentially more economic means of
transportation than LNG (Olah et al., 2006). As such,
much work is being done to reduce methanol’s cost
of production. Traditionally produced by the
breakdown of organic matter, methanol is today
almost entirely produced by the synthesis gas route.
However, it is possible for methanol to be produced
by the direct oxidation of methane (Cheng et al.,
2006), and from the hydrogenative reduction of CO2.
Both of these methods have tremendous potential,
and at present there is much effort directed to their
development.
Even using the conventional production route,
methanol is being considered in fuel applications.
With an excellent octane number, methanol has been
used in spark ignition engines in various ways,
including as a simple additive to improve engine
performance, and in the development of special
methanol blends for use in racing applications with
modified engines (Burns, 2008). In particular,
methanol’s use soared in the late 1990’s when
MTBE, a derivative of methanol, was used as a
common additive for gasoline engines. Several other
tests were carried out by different US State agencies
to examine the technical feasibility of using
methanol and di-methyl ether (DME), which is
another derivative, in compression ignition diesel
engines for transport purposes (Olah et al., 2006).
However, most of these projects came to a halt at the
end of the testing stage.
More recently, methanol is finding new fuel
applications, namely in fuel cells
(Sangtongkitcharoen et al., 2008). It can be
catalytically reformed to produce hydrogen gas (H2)
for use in fuel cells, or reacted with air in direct
methanol fuel cells (DMFC).
In general, methanol’s use as a fuel is becoming
more attractive. This is significantly being
influenced by recent trends in the global energy
market. Firstly, prices of oil and its related products
have been at a record high recently. This has been
partly attributed to the rapid growth of Far East and
Asian markets, which placed higher demands on
limited oil resources. This has prompted
consideration of other alternative energy sources that
are not oil dependent. A second key issue has been
growing global concern for the environment and
emphasis being placed on the use of fuels having
lower COx and NOx emissions. Methanol offers
these advantages, being a derivative of natural gas
which is partly de-linked from oil, and is a clean
burning fuel.
This is of key significance to countries of the
Caribbean region, given that almost all are net
importers of fossil fuels, which have been negatively
affected by recent fluctuations in crude oil prices.
As such, there is a keen interest in sourcing cheaper
and cleaner fuel alternatives. Consequently, this
work investigates the potential for methanol as such
an alternative for the Caribbean region. It presents
both a qualitative assessment of MtP relative to other
potential natural gas transportation technologies, and
a quantitative comparison to the present fossil fuel-
based power generation technologies in the
Caribbean.
The paper first gives an overview of some of the
key technical considerations of the MtP (i.e., Section
2), and outlines important characteristics of the
Caribbean power market (i.e., Section 3). In Section
4, factors affecting MtP’s feasibility relative to other
means of supplying energy to the region are
considered. A description of the economic model of
the MtP value chain is presented in Section 5, and
results are discussed in Section 6. The paper
concludes by highlighting some of the key findings
on the suitability of MtP to the Caribbean region,
and identifies future work on technical as well as
commercial aspects of the technology.
2. Technical Considerations of Methanol as a Fuel
The use of methanol as a fuel for stationary engines
has previously been investigated (General Electric,
2001). The overall result was that methanol can be
used successfully, with only minor modification of
the standard machinery to account for the main
differences in the fuel characteristics of methanol as
compared to those of other liquid fuels. For
comparison, Table 1 shows some of the fuel
properties of methanol and other fuels used for
power generation (Martinez, 2007), along with a
summary of key considerations on methanol’s use in
a gas turbine engine.
Firstly, methanol has a significantly lower
calorific value, which for example, is approximately
half that of diesel. This is generally compensated for
by a concomitant increase in the volumetric flow rate
of methanol which can be achieved without
significant difficulty or deviation from usual
operating conditions. Special nozzles can be used for
high fuel distribution with low pressure drop
3. R.J. Murray and H.I. Furlonge: Market and Economic Assessment of using Methanol for Power Generation 90
(Beukenberg and Reiss, 2006).
Table 1. Comparison of Fuel Properties and Resulting
GTE considerations
Fuel
property
Methanol DME Natural
gas
Diesel Issues of
MtP using a
Gas Turbine
Density
(kg/m3
) 790 1.8 0.68 –
0.70
820
–
860
Liquid fuel
versus
gaseous
Viscosity
Coefficient 0.59 0.086 –
0.14
0.01 –
0.012
2.6 –
4.1
Lubrication
and fuel-
delivery
issues
Flash point
(K) 285 232 85 330
Safety issues
requiring
special
handling,
control and
monitoring
Heating
value
(MJ/kg)
22.7 30 54 45
Increased fuel
flow rate
requirements
Secondly, the lubricity of methanol is relatively
low. This poses problems with standard fuel-delivery
systems, such as those involving the use of valves
for flow rate control, and in situations where the fuel
comes into contact with other moving parts within
the engine. There are generally two approaches to
addressing this. If preserving the chemical integrity
and consistency of the methanol is not a major
requirement, then the use of suitable lubricant
additives may be employed, with a consequent
alteration in combustion emissions. This may also
impact the rate of wear and residue build-up on other
engine components. Alternatively, an appropriate
pump (e.g. screw type) with effective coatings may
be used. The third factor concerns methanol’s
combustibility and flammability, which consequently
requires specific handling, controls and monitoring.
Despite the foregoing issues, previous work has
confirmed that the use of methanol as a fuel for
power generation is indeed possible. However, this
has been mostly limited to an experimental scale on
gas turbines. In addition, Seko and Kuroda (1998)
showed that methanol’s use in compression-ignition
engines is not only possible, but can be more
efficient than using diesel. It also yields lower NOx
emissions, with a lower brake specific energy
consumption at medium load conditions. The major
requirements here are similar to those when
methanol is used in gas turbine engines. More
specifically, the key issue is increasing the auto-
ignition ability of methanol, given that its auto-
ignition temperature is higher than that of diesel.
This can be achieved chemically by the addition of
combustion enhancers. Several mechanical methods
have also been developed. Two of the more common
include exhaust gas scavenging techniques (Tachiki,
2007) and flash-boiling the fuel (Seko and Kuroda,
2001). Currently, research into the development of
other methods is ongoing.
3. Caribbean Market Assessment
Although the compatibility of methanol as a fuel
for use in power generation equipment is important,
it is not the sole factor in determining its use in the
region. An assessment of Caribbean power markets
is also a preliminary step in order to determine trends
and key details that were unique to the Caribbean
context and would influence the implementation of
MtP in the region. The information extracted
includes the size of power demand in each country,
different energy sources (oil-derivatives, natural gas
or renewable), power generation equipment being
used (reciprocating engines or gas turbine), cost of
electricity and cost of fuel. As noted later on in this
section and in section 5, this information is useful in
determining the market potential for MtP and also
feeds into the economic model.
The market assessment was conducted by
gathering data related to energy usage and
arrangements in twenty-six countries. This data was
obtained from the United States Energy Information
Administration (EIA), Caribbean Energy
Information Systems (CEIS), Organisación
Latinoamericana de Energía (OLADE) and the
websites of national power authorities. Table 2
shows some of the main power market data for the
countries.
Based on the market assessment, some defining
characteristics of Caribbean power markets have
been identified:
· Size classification of markets. It was found that
the island markets could be differentiated on
the basis of size. In general, generation
capacities for the countries were either
significantly below or above 100MW; there
were only three islands with capacities close to
100MW. As such, markets were classed as
either small (below 100MW) or large (above
100MW).
· Technology classification of markets. Another
basis for differentiation between markets was
the type of power generation technology used.
For some islands, power is generated solely by
thermal processes using turbines or
reciprocating engines. However for others,
4. R.J. Murray and H.I. Furlonge: Market and Economic Assessment of using Methanol for Power Generation 91
power is generated using a mix of renewable
energy technologies and thermal technologies.
Countries with mixed technologies usually had
lower yearly electricity prices than those
without. Accordingly, power markets can also
be divided into two other categories: single
and mixed technologies.
· Turbine and engine market share. The two
main types of machinery used for thermal
processes are gas turbines and reciprocating
engines. However, it was found that their
distribution is correlated to the market size of
the country. Generally, those with smaller
market sizes tended to use reciprocating
engines more, while larger markets used gas
turbines.
In addition, the assessment revealed that most
countries increase their installed generating capacity
by 15% to 45% every 4 to 6 years. Consideration of
these factors points to different motivations and
configurations for the implementation of MtP in a
country. For example, MtP may be implemented via
the installation of new turbines to replace existing
infrastructure. Alternatively, it may be implemented
as a means of satisfying new demand. It is also
possible to modify existing turbine and reciprocating
engines to burn methanol, as was noted earlier.
These options are explored in greater detail in
Sections 5 and 6.
Table 2: Installed Electricity-Generating Capacity in the Caribbean Region (2005)
Country Total
Installed
Capacity
(MW)
Installed FFB
Capacity (MW) /
(% of total
installed capacity)
Renewables &
Other installed
capacities (MW)
Primary FFB Power Generation
Technology
Antigua & Barbuda 27 27 (100%) 0 Possibly reciprocating
Aruba 150 150 (100%) 0 Mixed: Diesel reciprocating and gas turbines
The Bahamas 401 401 (100%) 0 Reciprocating
Barbados 210 210 (100%) 0 Gas turbines
Belize 52 27 (52%) 25 (48%) Data not found
Virgin Islands (UK) 10 10 (100%) 0 Possibly reciprocating
Cayman Islands 115 115 (100%) 0 Reciprocating
Cuba 3958 3901 (99%) 57 (1%) Data not found
Dominica 22 14 (64%) 8 (36%) Reciprocating
Dominican Republic 5530 4988 (90%) 542 (10%) Primarily reciprocating, and gas turbines
French Guiana 140 140 (100%) 0 Data not found
Grenada 32 32 (100%) 0 Reciprocating
Guadeloupe 423 411 (97%) 12 (3%) Primarily reciprocating, and gas turbines
Guyana 313 308 (98%) 5 (2%) Primarily reciprocating
Haiti 244 181 (74%) 63 (26%) Reciprocating
Jamaica 1469 1325 (90%) 144 (10%) Primarily reciprocating
Martinique 396 396 (100%) 0 Primarily reciprocating, and gas turbines
Montserrat 2 2 (100%) 0 Reciprocating
Netherland Antilles 210 210 (100%) 0 Data not found
Puerto Rico 5358 5258 (100%) 100 (2%) Primarily reciprocating, and gas turbines
St. Kitts & Nevis 20 20 (100%) 0 Reciprocating
St. Lucia 57 57 (100%) 0 Reciprocating
St. Vincent/
Grenadines
24 18 (75%) 6 (25%) Reciprocating
Trinidad & Tobago 1416 1416 (100%) 0 Gas turbines
Turks/Caicos Islands 4 4 (100%) 0 Data not found
Virgin Islands (US) 323 323 (100%) 0 Data not found
4. Factors Affecting MtP’s Feasibility
Present global concerns surrounding energy security
and environmental impact have crafted a space for
the emergence of a new type of fuel which can
satisfy increasing energy demand in a sustainable
and cost competitive manner. For countries of the
Caribbean region, natural gas is one of the most
promising fuel sources because of its relative
abundance, cleaner combustion emissions and
proximity to supply, Trinidad and Tobago being the
primary one. This section presents a qualitative
assessment of various means of transporting natural
5. R.J. Murray and H.I. Furlonge: Market and Economic Assessment of using Methanol for Power Generation 92
gas including via methanol.
The main options previously considered, for
instance in Kromah et al. (2003), are gas pipeline,
gas to hydrate, gas to wire (GtW), gas to liquid
(GtL), and the more familiar LNG and compressed
natural gas (CNG). However, given the fact that the
proponents of each of these technologies assume the
use of the same natural gas source and with markets
being small, these technologies cannot be jointly
implemented. It follows therefore that these are all
competing technologies for the utilisation of natural
gas in the region. Aside from natural gas, it is worth
mentioning that the increasing global use of bio-fuels
has sparked some level of consideration in the
region. Bio-diesel and bio-ethanol have already
found use in some countries, but in most instances
they have only been explored on a small scale.
Consequently, the major focus here is on MtP’s
comparison to some of the aforementioned
technologies for natural gas utilisation within the
region. Table 3 summarises the main factors.
Table 3. Comparison of Natural Gas Transportation Technologies
Considerations Pipelines CNG/LNG MtP
Shipping None 1. May require multiple vessels,
partial loading/ offloading
depending on inventory
2. Special alloy materials needed
May require multiple vessels,
partial loading offloading
depending on inventory
Harbor None Development of deep water harbor
and compressors/ LNG offloading
facilities
Use of existing harbor
Storage and other infrastructure Compressors,
metering, etc.
New storage infrastructure; re-
gasification plants
Use of existing fuel import facility
with relatively minor modification
Speed of implementation Long
(> 3 years)
CNG (Medium, 2-3 years);
LNG (Long, > 3 years)
Short (< 2 years)
Supply flexibility (multiple suppliers,
increase in market size, etc.)
Low Medium High
Typical initial capital investment per
country (millions US$)
Medium
(> 10)
High (> 100) Low - Medium (<100 depending on
option for implementation)
4.1 Shipping/Transportation
Shipping of methanol uses no specialised
containment or materials, methanol being relatively
non-corrosive, and a liquid at room temperature and
atmospheric pressure. In contrast, LNG and CNG
require cryogenic alloy materials (and in most cases
double containment), and materials capable of high
pressure respectively.
4.2 Infrastructure (Harbor and Import Facilities)
Methanol ships consist of a wide range of sizes, so
smaller ones may be available which would not
require harbors as deep as those for LNG and CNG
vessels. Being a liquid fuel, storage and handling
equipment at the import terminal would be
essentially the same as that of other oil-based liquid
fuels, which are already in existence in regional
markets. However, compressors would be required
for a pipeline, a regasification facility for LNG, and
high pressure storage and compression facilities for
CNG.
4.3 Implementation Time and Supply Flexibility
Unlike other gas transportation technologies, MtP
can be implemented in a relatively short space of
time given that methanol is a widely traded
commodity with significant production from T&T.
As such, there is flexibility in supply in terms of the
number of countries in the Atlantic Basin region, and
the ability to access incremental volumes on a spot
trade basis. As mentioned above, no specialised
equipment is required which also reduces the time to
implement and expand facilities compared to
pipeline, LNG and CNG.
4.4 Initial Capital Investment
LNG has proven to be economic only for long
distances and large volumes, which are not
characteristic of regional markets. CNG has been
considered for closer and smaller markets but this
has not yet been proven economic for this region.
An OECS report estimates a construction cost of
approximately 5 to 10 million US dollars per island
for pipeline transmission (Hertzmark, 2006), which
6. R.J. Murray and H.I. Furlonge: Market and Economic Assessment of using Methanol for Power Generation 93
is relatively small. However, consideration has been
given to a single main transmission pipeline, with
spurs to each market, since building separate
pipelines for each country is not a feasible option.
As such, the capital cost, and commercial, legal and
political hurdles for such a project may be
prohibitive.
Overall, the comparison of different natural gas
transportation technologies suggests that MtP has
certain distinct advantages particularly for the unique
Caribbean power market. Of the competing
technologies, it is the most flexible and easily
implementable, while potentially being the least
costly. As mentioned earlier, MtP can be
implemented using gas turbines or by retrofitting
reciprocating engines which is the most common
power generation technology being used.
Consequently, a more detailed economic analysis is
required for determining the best solution for MtP’s
application.
5. Economic Model of MtP Value Chain
5.1 Integrated Value Chain Model
A schematic of a generic value chain was developed
to encompass key elements of the MtP process and
to allow for a more holistic economic evaluation, see
Figure 1. The MtP value chain comprises four key
economic activities.
Figure 1: Schematic of Generic MtP Value Chain
1) Methanol production – For the purposes of this
study, the market price of methanol is used as
the cost of methanol, obtained from Chemical
Marketing Associates Inc. (CMAI). This
allows for a fair market-based comparison
since it avoids issues such as rates of return
and natural gas pricing in determining the cost
of methanol production.
2) Methanol transportation – This approach
considers the cost for the shipping of methanol
to the various markets using standard vessels.
3) Methanol storage – Here, it is assumed that
inventory at the import terminal would be
large enough for thirty days of power
generation demand. The cost involves the
capital for construction of the necessary
storage facilities.
4) Power generation – This element of the chain
covers the cost of generating power from
methanol using either gas turbine engines or
reciprocating engines. Both the initial capital
outlay and the subsequent operational
expenses are considered here.
In order to quantitatively assess MtP’s
feasibility, an integrated economic model comprising
these activities was developed. The model sought to
capture the contributions of each of these four
activities to the overall unit cost of generating power
for a given year, CMtP, as given by:
CMtP= Cm + CP + CS + CT (1)
where all costs, C, are of units US$/kWh. Cm
represents the cost associated with purchasing
methanol fuel required to generate one unit (kWh) of
power; this is computed by:
Cm = (Pm) * (H.R./H.V.) (2)
where Pm is a variable that represents the market
price of methanol for a given year in US$/tonne,
H.R. is the heat rate (MJ/KWh) for the gas turbine
(or reciprocating engine), and H.V. is the heating
value of the fuel (MJ/t).
CP represents the unit amortized capital costs
plus the unit annual operating cost associated with
the power plant. This can be for the installation of a
new power plant or the retrofitting of an existing
plant. For a new installation CP is given by (3a), and
for a retrofitted plant by (3b):
CP = Am[PCapex * (IP,y/IP,r)] * [(GP/ GP,r) α
P]
+ [POpex * (IL,y/IL,r)] (3a)
CP = Am[PR * (IR,y/IR,r)] * [(GP/ GP,r) α
P]
+ [POpex * (IL,y/IL,r)] (3b)
The terms (IP,y/IP,r) and (IL,y/IL,r) in (3a) and (3b)
are inflation correction terms for the respective year
y relative to the reference year r, and for power plant
cost (IP) and operating cost (IL) respectively. Am is
the discount factor which adjusts the capital cost
(PCapex or PR for new or retrofitted plants
respectively) given in million USD to an annual
figure. POpex is the annual operating cost. These costs
are for a plant of power generating capacity GP
(MW). The term [(GP/ GP,r) α
P] is a scaling factor
adjuster, which alters the capital cost of the reference
plant capacity GP,r to the plant capacity GP that will
be used for MtP, in the specific island. This accounts
for economies of scale. CS represents the unit cost
associated with shipping methanol:
7. R.J. Murray and H.I. Furlonge: Market and Economic Assessment of using Methanol for Power Generation 94
CS = PS * (IS,y/IS,r) * (H.R./H.V.) (4)
with corrections, as before, for inflation and
converting the total cost PS given in US$/tonne to
US$/kWh.
Finally, CT represents the unit amortised cost for
a storage tank, given by:
CT = Am[PT * (IT,y/IT,r)] * [(VG/VG,r) α
T] (5)
The usual adjustments for inflation and capacity
requirements for the particular country are made to
the capital cost of the tank PT as given in million
USD, which is based on a volume of VG,r.
These economic model equations were used to
compute the overall cost of power generation for the
following scenarios, which arose from the market
assessment (cf. Section 3):
· Scenario A – New turbine installation
· Scenario B – Retrofit of an existing gas turbine
to use methanol
· Scenario C – Retrofit of an existing
reciprocating engine to use methanol.
The model treated each scenario differently by
altering the input parameters. It determines the
power generation cost using methanol for each
country, in a specific year, based on a particular
scenario. For example, assuming the island of
Grenada selected to retrofit reciprocating engines
(Scenario C) in the year 2000, the model determined
the unit cost of power generation in US cents per
kilowatt-hour (kWh) for Grenada using reciprocating
engines in that year.
5.2 Model Inputs and Assumptions
The main inputs are shown in Table 4, comprising
plant costs, scaling factors and inflation indices. The
market assessment provided the countries
replaceable generating capacity, GP, which is
essentially the portion of the total installed power
generation capacity that is derived from fossil fuels.
Table 4. Main Input Parameters for Cost Estimation
Parameter Value Unit
Power Plant cost, PCapex 10 Million US $ per 8.5MW capacity (GP,r)
Plant operational expenses, POpex 0.025 $/kWh
Storage Tank costs, PT 10 Million US $
Cost of retrofitting (mainly for fuel delivery system), PR 0.065 Million US $
Shipping costs, PS 20 US $/tonne
Methanol heating value, H.V. 22.7 MJ/kg
Country replaceable generating capacity, GP Island specific MW
Power plant scaling factor, αP 0.6 NA
Storage tank scaling factor, αT 0.57 NA
Turbine heat rate, H.R.Turbine 12.77 MJ/kWh
Reciprocating engine heat rate, H.R.Recip 10 MJ/kWh
Methanol market price (Source: CMAI), Pm Year specific US $/gallon
Electric Power Generation index (US Bureau of Labor
statistics), IP
Year specific NA
Metal tanks and vessels custom fabricated and field erected
index (US Bureau of Labor Statistics), IT
Year specific NA
Utilities: Unit labor cost index _ Nat gas distribution (US
Bureau of Labor Statistics), IL
Year specific NA
Deep sea freight transportation index (US Bureau of Labor
Statistics), IS
Year specific NA
Pump and pumping equipment manufacturing except
hydraulic (US Bureau of Labor Statistics), IR
Year specific NA
The following outlines the cost estimation
techniques and key economic assumptions.
1) The model estimates cost on a nominal US
dollar basis. All capital investments are
amortised over the economic lifespan of
twenty years at a discount rate of 8%, used to
calculate the discount factor Am in Equations
(3) and (5).
2) For the new installation scenarios, the cost of
electricity from MtP in any given year was
derived by assuming that all the relevant MtP
infrastructure capital cost were expended in
that particular year.
3) It was found that trends for historical diesel
fuel market prices and historical electricity
prices for the various countries exhibited a
8. R.J. Murray and H.I. Furlonge: Market and Economic Assessment of using Methanol for Power Generation 95
high level of correlation (greater than 0.9).
This was calculated using MATLAB 6.5 and a
sample plot illustrating this relationship is
shown in Figure 2. As a result, forecasted data
for the fuel market prices were used to project
the respective electricity prices with an
expected reasonable degree of accuracy.
4) Given the data for an 8.5MW gas turbine
engine (Breeze, 2005), similar capital cost
estimates for machines of higher generating
capacities were obtained using a factored
estimate with the relevant scaling exponents as
listed in Table 4 (Peters and Timmerhaus,
1991), cf. Equations 3 and 5. It was assumed
that this estimation technique was applicable
up to a plant capacity of 100MW.
The economic model was used to determine the
yearly power generation cost for a country, for each
scenario, over the period 1996 to 2006. It should be
noted that of the twenty-six countries in the region a
sample of eight (see Table 5) was considered for the
more detailed economic analysis. These countries are
representative of a wide range of power market sizes
and mix of power generation technologies.
Also, projections for the generation costs in
future years were also determined for each country
and each scenario, using a correlation between
historical methanol market prices and MtP power
generation cost, similar to that outlined in
assumption (3). As such, forecasted trend data for
methanol prices (CMAI) was used to produce
projections for the power generation costs over the
period of 2007 to 2012.
Figure 2: Correlation between Electricity Price and
Diesel Market Price
Table 5: MtP Cost Difference under Different Scenarios for Selected Islands
Country Total Installed
capacity
(MW)
Fossil fuel based
installed
capacity
MtP and FFB cost
difference in 2010
(Scenario A)
MtP and FFB cost
difference in 2010
(Scenario B)
MtP and FFB cost
difference in 2010
(Scenario C)
Bahamas 401 100% -2¢/kWh -1¢/kWh +4¢/kWh
Barbados 210 100% -2¢/kWh -1¢/kWh +4¢/kWh
Belize 52 52% -4¢/kWh -3¢/kWh +1¢/kWh
Cayman Islands 115 100% -6¢/kWh -5¢/kWh 0¢/kWh
Dominica 22 64% -2¢/kWh -1¢/kWh +4¢/kWh
Grenada 32 100% +2¢/kWh +3¢/kWh +7¢/kWh
Jamaica 1469 91% -1¢/kWh 0¢/kWh +5¢/kWh
St. Lucia 57 100% +4¢/kWh +5¢/kWh +9.7¢/kWh
Remarks: +ve values = MtP savings
6. Economic Comparison
This section examines the cost of power generation
via MtP, as calculated by the economic model
described above. The relative cost under the different
scenarios is essentially the same for the forecast
period. Thus, for comparison purposes, the year
2010 was chosen as a reference, this being a likely
timeframe taking into account actual implementation
time. The projected power generation cost for each
of the three MtP scenarios was compared to the
projected fossil fuel-based (FFB) power generation
cost in that year. Table 5 summarises the results of
this comparison for several countries, where a
positive cost difference indicates that the MtP option
is cheaper than the FFB one (i.e. a savings), and vice
versa. These are discussed below:
1) MtP is economic using turbines in certain
markets
As can be seen from Table 5, islands with relatively
small markets and that are 100% dependent on fossil
fuels stand to save by switching to MtP.
Specifically, the cost of power generation in Grenada
and St. Lucia is cheaper (i.e., 2 to 5 US cents per
9. R.J. Murray and H.I. Furlonge: Market and Economic Assessment of using Methanol for Power Generation 96
kWh) using MtP either as a new gas turbine facility
installation (i.e., Scenario A) or retrofit of an existing
one (i.e., Scenario B).
2) MtP is most economical with the use of
reciprocating engines
As can be seen from Table 5, Scenario C yields the
cheapest MtP electricity generation cost. Thus,
retrofitting reciprocating engines is the best option
for employing methanol as a fuel compared to
retrofitting gas turbines (i.e., Scenario B) and
installing new turbines (i.e., Scenario A) in all
countries. It therefore follows that countries which
employ reciprocating engines as the primary power
generation technology are most amenable to
switching to MtP. The main reason for this lies in the
fact that reciprocating engines are generally more
efficient power conversion devices than turbines, as
can be seen by the difference in heat rate values of
Table 4; the average heat rates are 12.77 and 10
MJ/kWh for turbine and reciprocating engines
respectively. Additionally, the value used for a
reciprocating engine heat rate is in fact on the higher
end of the spectrum for diesel operation, and some
research has shown that it is possible for methanol’s
use in reciprocating engines to be more efficient than
conventional diesel (Seko and Kuroda, 2001). A
more efficient process would mean an even lower
cost of MtP electricity generation.
3) MtP is most economical in smaller markets
Another key result is that the MtP initiative is
cheaper in countries having a relatively small
installed capacity (i.e. below 100 MW) and close to
100% fossil fuel dependence, namely for Dominica,
Grenada and St. Lucia. The highest savings
(achieved under Scenario C) for these three islands
are US cents per kilowatt-hour (kWh) 4, 7 and 9.7,
respectively (see Table 5). This amounts to a
potential saving of US$ million 9, 30.4 and 82.6
respectively over the period 2010 to 2012, as shown
in Table 6. These numbers were derived from the
product of MtP Scenario C unit cost savings (taken
from last column of Table 5) and annual power
consumption. A likely reason for the greater savings
in these smaller islands is that the cost of diesel
appears to be consistently higher than that for other
countries, as shown in Table 7. Hence, the residential
cost of electricity is higher, making the differential
with respect to MtP greater.
4) MtP is less economical in larger markets
Conversely, larger markets benefit less from
switching to MtP, for instance in the case of Cayman
Islands, Barbados and Bahamas. In addition to the
reason proffered above, this may also be attributed to
differences in efficiency of the primary power
generation technologies, particularly in the case of
comparing residential prices to MtP via turbines.
Additionally, in some islands, the fossil fuel-based
power generation is derived from the use of both
diesel and the cheaper fuel oil (see Figure 3). The
cumulative effect of this is a decrease in the island’s
overall generation costs and hence residential prices,
consequently leading to a less competitive MtP
price.
5) Impact of renewable energy in energy mix on
MtP’s competitiveness
A fifth noticeable result was that MtP also tended to
be less competitive in countries whose energy
consumption needs are partially met by renewable
resources, namely Dominica, Belize and Jamaica.
Table 5 shows that of the eight countries, Belize has
one of the lowest MtP savings and one of the highest
renewable energy components (i.e., 48%).
Table 6. Potential MtP Savings for Selected Caribbean Markets
Country Island Power
Consumption in
2005/billion kWh
Cost Savings in
2010/ cents/kWh
Cost Savings in
2011/ cents/kWh
Cost Savings in
2012/ cents/kWh
Total Savings over
the Period 2010-2012/
million US$
Bahamas 1.76 3.5 4.2 3.8 202.4
Barbados 0.89 3.4 4.1 3.7 99.7
Belize 0.16 1.2 1.9 1.5 7.4
Dominica 0.07 4.0 4.7 4.2 9.0
Grenada 0.14 7.0 7.6 7.1 30.4
Jamaica 6.13 4.3 5.0 4.5 845.9
St. Lucia 0.28 9.7 10.2 9.6 82.6
10. R.J. Murray and H.I. Furlonge: Market and Economic Assessment of using Methanol for Power Generation 97
Table 7. Price Paid by Countries for Diesel
Country Fuel Purchase
Cost 2001
(US $/gallon)
Fuel Purchase
Cost 2002
(US $/gallon)
Fuel Purchase Cost
2003
(US $/gallon)
Fuel Purchase Cost
2004
(US $/gallon)
Bahamas 0.680 0.690 0.907 1.082
Barbados 0.804 0.790 0.536 0.583
Belize 0.935 0.775 1.267 1.353
Dominica 0.870 0.836 0.977 1.130
Grenada 0.808 0.825 0.548 1.186
Jamaica 0.686 0.746 0.867 1.186
St. Lucia 0.867 0.832 1.067 1.100
US Gulf Coast Market Price 0.708 0.675 0.822 1.116
Source: Statistics Based on CEIS
In all these cases, the primary renewable energy
generation source is hydro-electricity, which is
generated by well-established plants and can be
expected to be somewhat cheaper than FFB power
generation. Consequently, the overall price of
electricity in these countries is considerably lower
than that of a country with similar installed capacity.
This is well demonstrated if one were to compare
Belize and St. Lucia (see Table 5). Another example
is Dominica relative to Grenada. It should be noted
however that the price of such a country’s residential
electricity is in most instances more of a weighted
average or overall price and therefore does not
reflect the true cost of FFB generation alone. It is
possible therefore that a switch to MtP for the FFB
component of the country’s capacity could lead to an
overall lower cost of electricity.
6) Impact of fuel market price differential
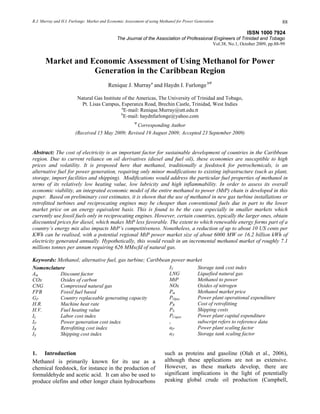
Figure 3 illustrates the historical as well as projected
market prices (up to 2012) for both diesel and
methanol on an energy equivalent basis. As can be
seen, the difference in price between the two fuels
widens significantly during certain prolonged
historical and projected periods. This difference
increases the savings by switching to MtP under
Scenario C, and may also improve the chances of
savings under Scenarios A and B.
7) Overall MtP potential in entire Caribbean region
Given the foregoing, in order to quantify the total
potential for MtP in all twenty-six countries of the
region, it is hypothetically assumed that MtP can
replace diesel in all reciprocating power generation
plants with only minor retrofit. This amounts to over
6000MW of installed capacity and represents about
16 billion kWh of power consumption. This would
require approximately 7.1 millions tonnes of
methanol yearly, which is just over the total current
methanol production capacity in T&T. The quantity
of natural gas required to meet such a market is 626
million standard cubic feet per day (MMscfd),
replacing around 5.2 million tonnes of diesel per
annum. This market share can be further increased
given that turbine-based MtP generation is also
cheaper in some instances, thus representing a lower
limit for MtP’s potential.
Figure 3. Comparison of Market Price for Different Fuels
0
5
10
15
20
25
1996
1998
2000
2002
2004
2006
2008
2010
2012
Year
Diesel price
($/MMBTU)
Methanol price
($/MMBTU)
Fuel oil price
($/MMBTU)
However, this criterion does not represent the
sole basis on which some countries make such
decisions; there may be other strategic advantages to
another approach that is not considered by this
model, such as financing constraints, bilateral trade
arrangements involving fuel and other commodities
and market penetration incentives which can be
lobbied. Nonetheless, to give an idea of the
significance of MtP’s potential, an average of just 1
US cent per kWh reduction in electricity prices for
the entire region is roughly equivalent to US$
million 200 per annum in savings. As shown
previously in Tables 5 and 6, given that some
countries may have significant unit cost savings (up
to an order of magnitude of 10 US cents per kWh),
this figure is not unrealistic, but is subject to more
detailed assessment of each of the countries in the
region.
11. R.J. Murray and H.I. Furlonge: Market and Economic Assessment of using Methanol for Power Generation 98
7. Conclusion
Energy security and affordability are important
ingredients to achieving sustainable development.
In this regard, it is important for the Caribbean
region to move decisively away from its dependence
on oil and its derivatives in order to reduce the
overall power generation cost and high volatility of
electricity prices. As noted here, methanol prices on
an energy equivalent basis have been historically
competitive with diesel. Relative to other fuels and
means of transporting natural gas, advantages also
include lower capital cost, minimal infrastructure
requirements, use of standard equipment and
materials, and ease of shipping. LNG for instance
requires large capital investments for ships and
storage tanks with cryogenic materials and
regasification import terminals. Furthermore,
because methanol can be shipped cost effectively in
smaller quantities, MtP can be economic for small
niche power markets such as in the Caribbean. The
legal and commercial hurdles of supplying gas to the
region via pipeline from Trinidad and Tobago do not
arise with a MtP solution. Additionally, it is a
cleaner burning fuel. Methanol is an attractive
alternative fuel for meeting the energy needs of
niche markets in an economic and environmentally
sustainable manner, utilising existing or new power
generation infrastructure in the Caribbean.
In order to further assess MtP’s potential, an
integrated economic model of the MtP chain has
been presented here, taking into account methanol
production, shipping, importation and power
generation. It is found that MtP proves to be cheaper
in smaller islands which tend to pay slightly more for
diesel and due to the lower economies of scale and
efficiency of power generation at smaller capacities.
Retrofitting reciprocating engines, which is the most
prominent technology being used in the region, gives
the highest savings for MtP, of up to about 10 US
cents per kWh. As one would expect, as the gap
between the market prices of methanol and diesel
widens in favor of methanol, as is expected in the
projections obtained and reported here, MtP’s
economic advantage improves further. Based on
these preliminary findings, there is a potential for
MtP to replace at least 6000MW, or put another way
16.2 billion kWh per annum of power generation in
the Caribbean region. This will require
approximately 7.1 millions tonnes of methanol per
annum (or 626 MMscfd of natural gas), thus
providing a large new market for methanol, and
hence for natural gas. Of course, there are several
factors to consider in implementing a change-out of
technology in any one island, including capital
outlay and financing, project viability based on
detailed engineering and economic evaluation,
payback period, commercial arrangement and
ownership structures comprising the various
stakeholders in the MtP chain, and risk distribution.
One consideration which is important but
difficult to gauge is the level of subsidy for
electricity provided by governments in the region.
This subsidy varies from country to country and for
different categories of consumers (e.g. residential
versus commercial). As such, the actual data of
electricity prices used here, which are known to be
subsidised, do not provide a fair reference for MtP’s
viability. Therefore, the savings reported are likely
underestimates since pure market prices were used
for computing the overall power generation cost for
MtP. Furthermore, in scenarios where current fuels
and technologies showed to be better, MtP may
ultimately lead to savings if these subsidies were
removed, thereby relieving governments of the
economic burden and even provide lower prices to
customers. It is estimated that with just an average
1 US cent per kWh reduction in electricity prices via
MtP, a total saving of roughly US$ 200 million can
be realised per annum in the region. This highlights
the potential impact of a cheaper power generation
option, and makes MtP worthy of further
consideration.
Future work may improve on the accuracy of the
cost estimates used in the economic evaluation. A
probabilistic approach can be adopted to account for
uncertainty and in determining the level of risk in
switching to MtP. The issue of regional natural gas
pricing was not specifically considered, as well as
possible incentives for MtP, both of which are
crucial matters at the governmental level. The price
structure of natural gas for methanol production
would have implications on the fuel price volatility
issue which is currently a major concern for
countries in the region. The viability of MtP for
distant and larger markets was not the focus here, but
worth evaluating. Finally, the technical feasibility of
MtP needs to be assessed, i.e. equipment efficiency,
reliability, availability and maintenance programme.
This work is currently being undertaken by The
University of Trinidad and Tobago along with
Methanol Holdings Trinidad Limited which is
overseeing the operation of a demonstration power
plant on the Point Lisas Industrial Estate, Trinidad
(Furlonge and Chandool, 2007).
12. R.J. Murray and H.I. Furlonge: Market and Economic Assessment of using Methanol for Power Generation 99
Acknowledgements:
The authors would like to thank the following
institutions for their support and contribution:
· Methanol Holdings Trinidad Limited
· The University of Trinidad and Tobago
· Caribbean Energy Information Systems (CEIS)
· The Library Services of Trinidad and Tobago’s
Ministry of Energy and Energy Industries, and
Information Services Department of The National
Gas Company of Trinidad and Tobago Limited.
References:
Beukenberg, M. and Reiss, F. (2006), “Operation of gas
turbines using methanol as the fuel”, Man Turbo
Internal Paper.
Breeze, P. (2005), Power Generation Technologies, First
Edition, Newnes, Oxford.
Burns, S. (2008), “Tech Bulletin”, In the vpracingfuels
webpage [online]. Available from:
http://www.vpracingfuels.com/spec/Tech%20Bulletin--
Methanol.doc [cited 2 February 2008].
Campbell, J.C. (2002), “Peak oil: an outlook on crude oil
depletion”, Greatchange, Available from:
http://www.greatchange.org/ov-campbell,outlook.html
[cited 11 December 2008]
Cheng, J., Li, Z., Haught, M. and Tang, Y. (2006), “Direct
methane conversion to methanol by ionic liquid-
dissolved platinum catalysts”, The Royal Society of
Chemistry, Vol.2006, pp.4617-4619.
Furlonge, H.I. and Chandool, V. (2007), “Methanol to
power demonstration project”, GazChem 2007
Conference, Port of Spain, June, Available from:
http://www.utt.edu.tt/utt/ngia/methanol_to_power.pdf
[cited 20 February 2009]
General Electric (2001), “Feasibility of methanol as gas
turbine fuel” (Internal document), General Electric
Hertzmark, D. (2006), “OECS energy issues and options”,
Energy Sector Management Assistance Programme
Report, pp.1.
Kromah, M, Thomas, S. and Dawe, R.A. (2003),
“Transporting natural gas around the Caribbean”, West
Indian Journal of Engineering, Vol.25, pp.18-32.
Martinez, I. (2007), “Fuel properties”, In the Isidoro
Martinez fuel properties page [online]. Available from:
http://imartinez.etsin.upm.es/bk3/c15/Fuel%20propertie
s.htm#_Toc110338747 [cited 9 October 2007].
Olah, A.G., Goeppert, A. and Prakash, G.K.S. (2006),
Beyond Oil and Gas: The Methanol Economy,
Weinheim, Germany: WILEY-VCH Verlag GmbH &
Co.
Peters, M.S. and Timmerhaus, K.D. (1991), Plant Design
and Economics for Chemical Engineers, 4th
Edition,
McGraw-Hill
Sangtongkitcharoen, W, Vivanpatarakij, S., Laosiripojana,
N., Arpornwichanop, A. and Assabumrungrat, S.
(2008), “Performance analysis of methanol-fueled solid
oxide fuel cell system incorporated with palladium
membrane reactor”, Chemical Engineering Journal,
Vol.138, pp.436-441.
Seko, T. and Kuroda, E. (1998), “Methanol lean burn in
an auto-ignition DI engine”, Technical Paper Series,
Society of Automotive Engineers
Seko, T. and Kuroda, E. (2001), “Combustion
improvement of a premixed charge compression
ignition methanol engine using flash boiling fuel
injection”, Technical Paper Series, Society of
Automotive Engineers
Tachiki, K. (2007), “Gasoline-blended methanol fuel for
internal combustion engines”, In the Patent Storm
webpage [online]. Available from:
http://www.patentstorm.us/patents/5344469.html [cited
28 November 2007].
Biographical Notes:
Renique J. Murray is currently a research assistant at
The University of Trinidad and Tobago (UTT), where he
is pursing a Doctor of Philosophy degree in the area of
fuel technology and power generation. He holds a
Bachelor of Science degree in Mechanical Engineering,
as well as a Masters of Philosophy degree in the area of
vibration analysis of rotating machines from UWI. He
also has done some part-time lecturing at The University
of the West Indies (UWI) in the subject of Engineering
Dynamics.
Haydn I. Furlonge has fifteen years of teaching,
research and industrial experience in process
optimization, gas market analysis, contract negotiation
and business development. While at The National Gas
Company of Trinidad and Tobago Ltd., he was involved in
feasibility analyses of energy projects, and setting up a
department for management of LNG and related gas
contracts. His current role is to oversee the establishment
of the Natural Gas Institute of the Americas at The
University of Trinidad and Tobago, which focuses on
energy-related research. He is also the Chair and
Proceedings editor of the Tobago Gas Technology
Conference. He has authored/co-authored about thirty
journal and conference papers. He has a Ph.D. degree in
Chemical Engineering from Imperial College London. He
holds Chartered Engineer (C.Eng.) status, is a Registered
Engineer (R.Eng.) in Trinidad and Tobago, and is a
member of the Institution of Chemical Engineers
(MIChemE), and International Association for Energy
Economics.