Contenu connexe
Similaire à ADP Regional Employment Report: April 2015
Similaire à ADP Regional Employment Report: April 2015 (20)
ADP Regional Employment Report: April 2015
- 1. Regional Employment Report®
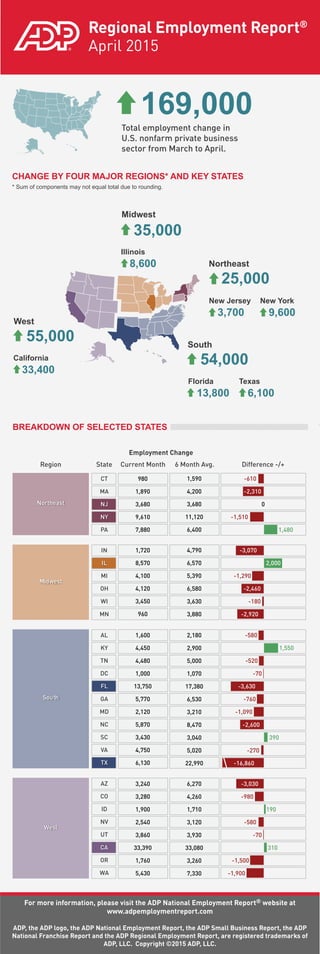
April 2015
CHANGE BY FOUR MAJOR REGIONS* AND KEY STATES
* Sum of components may not equal total due to rounding.
BREAKDOWN OF SELECTED STATES
Midwest
Illinois
New Jersey
California
Florida Texas
New York
Northeast
South
West
169,000
35,000
25,000
Total employment change in
U.S. nonfarm private business
sector from March to April.
8,600
3,700
33,400
13,800 6,100
9,600
54,000
55,000
Region State Current Month
Employment Change
6 Month Avg. Difference -/+
CT
Northeast
MA
NJ
NY
PA
IN
Midwest
IL
MI
OH
WI
MN
AL
South
KY
TN
DC
FL
GA
MD
NC
SC
VA
TX
AZ
West
CO
ID
NV
UT
CA
OR
WA
1,590
4,200
3,680
11,120
6,400
4,790
6,570
5,390
6,580
3,630
3,880
2,180
2,900
5,000
1,070
17,380
6,530
3,210
8,470
3,040
5,020
22,990
6,270
4,260
1,710
3,120
3,930
33,080
3,260
7,330
-610
-2,310
0
-1,510
1,480
-3,070
2,000
-1,290
-2,460
-180
-2,920
-580
1,550
-520
-70
-3,630
-760
-1,090
-2,600
390
-270
-16,860
-3,030
-980
190
-580
-70
310
-1,500
-1,900
For more information, please visit the ADP National Employment Report® website at
www.adpemploymentreport.com
ADP, the ADP logo, the ADP National Employment Report, the ADP Small Business Report, the ADP
National Franchise Report and the ADP Regional Employment Report, are registered trademarks of
ADP, LLC. Copyright ©2015 ADP, LLC.
980
1,890
3,680
9,610
7,880
1,720
8,570
4,100
4,120
3,450
960
1,600
4,450
4,480
1,000
13,750
5,770
2,120
5,870
3,430
4,750
6,130
3,240
3,280
1,900
2,540
3,860
33,390
1,760
5,430