Predictive Analytics: Business Process Analysis And Optimization a CRM Case Study
•
3 j'aime•1,376 vues

Case Study on how to employ predictive analytics approaches to analyze and optimize high-volume business processes

Recommandé
Recommandé
Contenu connexe
Tendances
Tendances (17)
En vedette
En vedette (20)
Similaire à Predictive Analytics: Business Process Analysis And Optimization a CRM Case Study
Similaire à Predictive Analytics: Business Process Analysis And Optimization a CRM Case Study (20)
Predictive Analytics: Business Process Analysis And Optimization a CRM Case Study
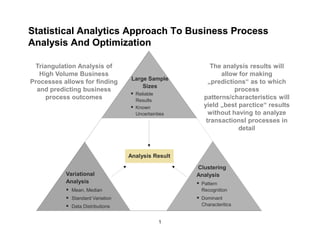
- 1. Statistical Analytics Approach To Business Process Analysis And Optimization And Triangulation Analysis of The analysis results will High Volume Business allow for making Large Sample Processes allows for finding „predictions“ as to which Sizes and predicting business process Reliable process outcomes Results patterns/characteristics will Known yield „best parctice“ results Uncertainties without having to analyze transactionsl processes in detail Analysis Result Clustering Variational Analysis Analysis Pattern Mean, Median Recognition Standard Variation Dominant Data Distributions Characteritics 1
- 2. CRM Case Study Example: CRM “Process” Data Visible Through BPM Application Allows For Variation Analysis Activate Schedule/ Notes Receiver Reschedule Service Call # calls analyzed 98 45 AHT 545 s 325 s AHT variation > 60% Average # of Screens per 7 8 process Process variation (as defined 92% 63% by AHT variance ) Following internal best 55% 36% Supports the conclusion of a more constrained workflow, but number of practice observed calls not following best practice still significant User Error Rate ~16% ~16% Considerably lower than the average for the entire population of calls at 47% System Error Rate ~2% ~2% Compared to ~17% for the entire population of calls % main process screen was ~90% ~90% Further indication of stable process; main source of process variation likely used correctly to be unnecessary screen jumping, where Agents may be viewing other screens for information that may or may not be useful Talk/wait times without ~48% ~48% system interaction (as % of AHT) CRM : KM breakdown (as % CRM: 82% CRM: 72% of AHT) KM: 6% KM: 11%
- 3. Variation Analysis Results Give First Interesting Insights into Process Performance (I) Number of successfully analyzed calls (45 – Schedule/ Reschedule Service Call and 98 – Activate Receiver) make the results below more or less statistically significant (statistical error ~15% and ~ 10%) Though AHT is significantly, and expectedly, different for both processes (Activate receiver AHT ~ 545 sec. vs. 325 sec. for other process) both show significant AHT variation (> 60%) However, process variation as seen in e.g. AHT and Number of Screens (~60%) used is significantly less than the variation seen in BPM system for the TOP CRM 10 screens (~100 – 400%) indicating that both processes have better constrained workflows than other processes. However, both mean and median number of screens per process is high (7 - 8) This notion is confirmed when clustering workflow sequences and comparing to internal best- practice workflow sequences – 55% of Activate Receiver and 36% of Schedule/Reschedule Service Call followed internal best practice – number of processes not following best practice is still significant Also, when comparing user error rates on finds that both processes have an error rate per call of ~16%. Very high, but still about 3 times lower than the error rate per call seen in the general population of about 47% 3
- 4. Variation Analysis Results Give First Interesting Insights into Process Performance (II) The system error rate per call of ~ 2% is significantly lower than the system error rate per call of ~17% in the general population indicating more stable, though still not satisfactory system performance Another indicator of a more robust process is the percentage of times the main process screen(s) were not only used but also used properly – about 90% for both processes – indicating that main source of process variation originates from unnecessary screen jumping Significant talk and wait times w/o system interaction, the latter especially for the activate receiver process ~ 48% of AHT, indicate substantial improvement opportunities Usage of CRM, KM, OMS and other apps as % of AHT is quite different between the two processes e.g. KM: 11% for Schedule/Reschedule vs. 6% for Activate Receiver and 72% vs. 82% for CRM but indicates that majority of time is spent in CRM system The frequency and average time of system usage per process for KM (9% and 49 sec. vs. 19% and 172 sec.) and OMS (22% and 154 sec. vs. 11% and 72 sec. for activate receiver) indicate, not unexpectedly, substantial usage variation by process which could be better understood with BPM system templates 4
- 5. Advanced data mining methods give even deeper insight Business Process Example used: Activate Receiver Process Used statistical analysis tool similar to SPSS Required usage of more advanced data mining methods e.g. HAC – Hierarchical Clustering, call handle time in KM, CRM, OMS, time in other apps and time talking/waiting without system interactions Group Characterization Principal Component Analysis Multiple Correspondence Analysis which could be easily utilized without additional development effort after extracting relevant business process data from systems 5
- 6. Results of the advanced statistical/”predictive” analysis Example used: Activate Receiver Process Outliers (4 of 98) had to be removed to yield descriptive results Clustering resulted in 5 clusters with 2 clusters encompassing ~ 80% of all processes – (Cluster 1 – 59 and Cluster 2 – 17 processes) Cluster 1 is characterized by a significantly lower mean for all system & call handle as well as lower standard deviation for AHT and CRM time compared to the entire population More processes in Cluster 1 are user error free and follow internal best-practice than compared to the entire population Cluster 2 is almost the inverse of Cluster 1 in terms of system and AHT times and standard deviations as well as less processes are user error free and follow internal best practice compared to the entire population Drilling into Cluster 1 further yields 5 clusters with 2 clusters containing nearly 75% of processes. Main differentiator between the two is AHT and Time in CRM with cluster 1 having significantly lower durations and lower variation While New Cluster 1 contained no user errors vs. about 20% in New Cluster 2, the distribution of process following internal best-practice was about the same More detailed screen sequencing data is necessary to better correlate business process effects (AHT, System time and errors) 6
- 7. Summary of Statistical Business Process Analysis Both processes show better process stability/performance (variation in e.g. Number of CRM Screens used, error rates, % following internal best-practice) compared to results of December analysis – better constrained CRM workflow The Activate Receiver process shows better process stability but significant amount of wait/non-value-add time – significant process improvement opportunity Though usage of CRM/KM/OMS is different for both processes, agents spent significantly more time in CRM – 70 – 80% of AHT – than in either KM or OMS and less then 25% of all analyzed processes use either KM or OMS Detailed clustering analysis for the activate receiver process showed Several distinct process groups/clusters with in part very different process characteristics Main points of distinction were very different mean and variation in AHT, CRM and KM time as well as non-system interactions time Also best-performing vs. poorer performing groups were distinguished by no or few user-errors, significant % of internal-best practice and no technical troubleshooting 7
- 8. Appendix: Detailed Clustering Results Cluster 4 Cluster 2 Cluster 3 Cluster 5 Cluster 1 Examples [ 62.8 %] 59 Examples [ 18.1 %] 17 Examples [ 8.5 %] 8 Examples [ 8.5 %] 8 Examples [ 2.1 %] 2 Attribute Description Test value Group Overall Attribute Description Test value Group Overall Attribute Description Test value Group Overall Attribute Description Test value Group Overall Attribute Description Test value Group Overall Continuous attributes : Mean (StdDev) Continuous attributes : Mean (StdDev) Continuous attributes : Mean (StdDev) Continuous attributes : Mean (StdDev) Continuous attributes : Mean (StdDev) Time in DORIS -1.95 4.44 (24.93) 13.34 (57.03) Time in RIO 5.95 829.94 (204.18) 430.65 (304.00) Time in other applications 8.65 227.25 (54.27) 26.03 (68.41) Time in OMS 8.19 50.75 (29.38) 4.64 (16.57) Time in DORIS 8.39 350.00 (155.56) 13.34 (57.03) Talk/Wait time w/o system Talk/Wait time w/o system Time in other applications -3.44 7.24 (21.95) 26.03 (68.41) Call duration 4.87 841.12 (203.17) 474.66 (341.04) 4.59 453.38 (313.41) 146.11 (197.10) 0.46 177.25 (99.41) 146.11 (197.10) Call duration 4.48 1549.50 (154.86) 474.66 (341.04) interaction interaction Talk/Wait time w/o system Time in OMS -3.51 0.00 (0.00) 4.64 (16.57) 3.19 285.06 (236.57) 146.11 (197.10) Call duration 2.5 764.13 (489.49) 474.66 (341.04) Call duration 0.13 489.38 (195.14) 474.66 (341.04) Time in RIO 3.6 1199.50 (310.42) 430.65 (304.00) interaction Talk/Wait time w/o system Talk/Wait time w/o system -5.6 58.02 (73.70) 146.11 (197.10) Time in DORIS -0.26 10.12 (20.71) 13.34 (57.03) Time in RIO 0.92 526.13 (460.92) 430.65 (304.00) Time in other applications -0.13 23.00 (65.05) 26.03 (68.41) 0.46 210.00 (296.98) 146.11 (197.10) interaction interaction Time in RIO -6.22 279.71 (116.72) 430.65 (304.00) Time in OMS -1.27 0.00 (0.00) 4.64 (16.57) Time in OMS -0.16 3.75 (10.61) 4.64 (16.57) Time in RIO -0.22 407.63 (185.11) 430.65 (304.00) Time in OMS -0.4 0.00 (0.00) 4.64 (16.57) Call duration -6.73 291.39 (127.41) 474.66 (341.04) Time in other applications -1.65 1.06 (4.37) 26.03 (68.41) Time in DORIS -0.33 7.00 (14.71) 13.34 (57.03) Time in DORIS -0.28 8.00 (16.14) 13.34 (57.03) Time in other applications -0.54 0.00 (0.00) 26.03 (68.41) Discrete attributes : [Recall] Accuracy Discrete attributes : [Recall] Accuracy Discrete attributes : [Recall] Accuracy Discrete attributes : [Recall] Accuracy Discrete attributes : [Recall] Accuracy Was technical trouble- Was technical trouble- Was technical trouble- Was technical trouble- Was there a system error shooting necessary during 3.69 [ 73.9 %] 86.4 % 73.40% shooting necessary during 2.2 [ 37.5 %] 35.3 % 17.00% 3.28 [ 100.0 %] 12.5 % 1.10% shooting necessary during 2.58 [ 25.0 %] 50.0 % 17.00% shooting necessary during 1.95 [ 11.1 %] 50.0 % 9.60% during the call?=Y call?=N call?=Y call?=Y call?=Y Was functionality of main Was technical trouble- Was functionality of main Was there a system error Process followed best- 1.3 [ 63.4 %] 100.0 % 98.90% screen for process used as 0.96 [ 18.9 %] 100.0 % 95.70% shooting necessary during 1.6 [ 18.8 %] 37.5 % 17.00% screen for process used as 1.2 [ 25.0 %] 12.5 % 4.30% 1.25 [ 3.8 %] 100.0 % 56.40% during the call?=N practice?=Y intended?=Y call?=Y intended?=N Request completed in Was there a user error Was there a user error Process followed best- Was there a user error 0.82 [ 64.6 %] 86.4 % 84.00% 0.94 [ 26.7 %] 23.5 % 16.00% 1.12 [ 12.2 %] 62.5 % 43.60% screen designed for 0.62 [ 8.9 %] 100.0 % 95.70% 0.62 [ 2.5 %] 100.0 % 84.00% during the call?=N during the call?=Y practice?=N during the call?=N request?=Y Request completed in Process followed best- Process followed best- Was there a user error Process followed best- 0.74 [ 66.0 %] 59.3 % 56.40% 0.85 [ 22.0 %] 52.9 % 43.60% 0.73 [ 13.3 %] 25.0 % 16.00% 0.36 [ 9.4 %] 62.5 % 56.40% screen designed for 0.3 [ 2.2 %] 100.0 % 95.70% practice?=Y practice?=N during the call?=Y practice?=Y request?=Y Request completed in Was functionality of main Was functionality of main Was there a system error Was there a system error screen designed for 0.51 [ 75.0 %] 5.1 % 4.30% 0.47 [ 18.3 %] 100.0 % 98.90% screen for process used as 0.62 [ 8.9 %] 100.0 % 95.70% 0.3 [ 8.6 %] 100.0 % 98.90% screen for process used as 0.3 [ 2.2 %] 100.0 % 95.70% during the call?=N during the call?=N request?=N intended?=Y intended?=Y Was functionality of main Request completed in Request completed in Was there a user error Was there a system error screen for process used as 0.51 [ 75.0 %] 5.1 % 4.30% screen designed for 0.37 [ 25.0 %] 5.9 % 4.30% screen designed for 0.62 [ 8.9 %] 100.0 % 95.70% 0.28 [ 8.9 %] 87.5 % 84.00% 0.15 [ 2.2 %] 100.0 % 98.90% during the call?=N during the call?=N intended?=N request?=N request?=Y Was technical trouble- Was technical trouble- Was technical trouble- Was there a user error Was there a system error shooting necessary during -0.47 [ 55.6 %] 8.5 % 9.60% shooting necessary during 0.34 [ 22.2 %] 11.8 % 9.60% shooting necessary during 0.29 [ 11.1 %] 12.5 % 9.60% -0.28 [ 6.7 %] 12.5 % 16.00% -0.15 [ 0.0 %] 0.0 % 1.10% during the call?=Y during the call?=Y call?=Y call?=Y call?=Y Was functionality of main Request completed in Was functionality of main Was functionality of main Was there a system error screen for process used as -0.51 [ 62.2 %] 94.9 % 95.70% screen designed for -0.37 [ 17.8 %] 94.1 % 95.70% screen for process used as -0.62 [ 0.0 %] 0.0 % 4.30% -0.3 [ 0.0 %] 0.0 % 1.10% screen for process used as -0.3 [ 0.0 %] 0.0 % 4.30% during the call?=Y intended?=Y request?=Y intended?=N intended?=N Request completed in Request completed in Request completed in Was there a system error Process followed best- screen designed for -0.51 [ 62.2 %] 94.9 % 95.70% -0.47 [ 0.0 %] 0.0 % 1.10% screen designed for -0.62 [ 0.0 %] 0.0 % 4.30% -0.36 [ 7.3 %] 37.5 % 43.60% screen designed for -0.3 [ 0.0 %] 0.0 % 4.30% during the call?=Y practice?=N request?=Y request?=N request?=N Request completed in Process followed best- Process followed best- Was there a user error Was there a user error -0.74 [ 58.5 %] 40.7 % 43.60% -0.85 [ 15.1 %] 47.1 % 56.40% -0.73 [ 7.6 %] 75.0 % 84.00% screen designed for -0.62 [ 0.0 %] 0.0 % 4.30% -0.62 [ 0.0 %] 0.0 % 16.00% practice?=N practice?=Y during the call?=N during the call?=Y request?=N Was technical trouble- Was technical trouble- Was there a user error Was there a user error Process followed best- -0.82 [ 53.3 %] 13.6 % 16.00% -0.94 [ 16.5 %] 76.5 % 84.00% -1.12 [ 5.7 %] 37.5 % 56.40% shooting necessary during -0.96 [ 0.0 %] 0.0 % 9.60% shooting necessary during -0.64 [ 0.0 %] 0.0 % 17.00% during the call?=Y during the call?=N practice?=Y call?=Y call?=Y Was functionality of main Was technical trouble- Was functionality of main Was technical trouble- Was there a system error -1.3 [ 0.0 %] 0.0 % 1.10% screen for process used as -0.96 [ 0.0 %] 0.0 % 4.30% shooting necessary during -1.56 [ 5.8 %] 50.0 % 73.40% screen for process used as -1.2 [ 7.8 %] 87.5 % 95.70% shooting necessary during -0.75 [ 1.4 %] 50.0 % 73.40% during the call?=Y intended?=N call?=N intended?=Y call?=N Was technical trouble- Was technical trouble- Was technical trouble- Was there a system error Process followed best- shooting necessary during -3.98 [ 18.8 %] 5.1 % 17.00% shooting necessary during -2.1 [ 13.0 %] 52.9 % 73.40% -3.28 [ 7.5 %] 87.5 % 98.90% shooting necessary during -1.56 [ 5.8 %] 50.0 % 73.40% -1.25 [ 0.0 %] 0.0 % 43.60% during the call?=N practice?=N call?=Y call?=N call?=N 8