SlideShare une entreprise Scribd logo
1  sur  4
Télécharger pour lire hors ligne
March 2012, Volume I, Issue VIII                                                                agneya


Last Session Caps Eventful Five Years For RE
Financial year ends on a quiet note
       REC Trade                                                        Volume      Clearing Price
                                        Buy Bids       Sell Bids
       March 2012                                                       Traded       Rs. per REC
                            IEX          272,366       223, 907         192,354         2,900
       Non-Solar
                            PXIL          51,401        7,405            7,383          3,100
                            IEX           5,782           -                -              -
       Solar
                            PXIL          3,319           -                -              -


Renewable energy in numbers
As the financial year comes to a close, we take a look at how far the Renewable Energy sector in India has
progressed and why the future for the REC market looks bright.

Capacity and Share of Renewable Energy in India have grown steadily. More RE capacity was installed in the
last five years than the cumulative total till then.

 5 Yr Plan Ending                               1992         1997           2002       2007            2012
 RES Installed Capacity MW                        32          902           1,628     7,761          22,233
 5 yr CAGR                                        NA         95%             13%       37%             23%


                                      Increasing Share of RE in India’s Power Mix


Source: CEA, MNRE; 2012 data as on 29.02.2012


28 Mar, 2012                                                                                         Page 1 of 4
March 2012, Volume I, Issue VIII                                                                            agneya

                                                         Distribution of total installed power generating capacity
          Distribution of Total Capacity and RE
                         Capacity
                                                         and capacity of Renewable Energy is skewed amongst
                                                         Regions. South accounts for 27% of total installed power
                                                         generation capacity but 49% of installed RE capacity
  Total        North    South   East      West           owing to wind energy capacity in Tamil Nadu.


    RE


                                                         Source: CEA, East includes North East, South includes
          0%      20%    40%    60%     80%       100%
                                                         Islands; 2012 data as on 29.02.2012


REC trading was launched in March 2011. It
                                                                  Cumulative Trade Value in FY2011-12: Rs. 286
provides a market driven route for addressing                                       Crores
skewed availability of RE. After a hesitant first
                                                                                                                        286
few months, the market has now picked up and
is substantial in size now – total traded value of                                                                228
RECs in FY2011-12 was Rs. 286 crores.                                                                       165
                                                                                                      113
                                                                                                 80
                                                                                            49
                                                                                  13   23
                                                              0    3    5    8

                                                             Apr May Jun Jul Aug Sep Oct Nov Dec Jan Feb Mar
                                                            2011 2011 2011 2011 2011 2011 2011 2011 2011 2012 2012 2012
 Source: REC Registry, Trade Numbers in ‘000 RECs


Participants are warming up to the REC market. Evidence of this can be seen in various aspects of market
performance in the last twelve months.

a. Higher prices of RECs – prices picked up from floor level of Rs. 1500 to Rs. 3000 by last quarter of FY 2011-
   12. There is more clarity now on what levels of pricing can be expected in the coming financial year.
b. Increase in number of participants in trading – number of participants rose from mere double digits in first few
   months to around 400 in the last trading session. Higher number of participants encouraged better price
   discovery for RECs.
c. More successful buy as well as sell bids – higher proportion of bids were cleared both from sellers as well as
   buyers. This shows better clarity on prices, which have been stable in the range of Rs 2,700 to Rs. 3100.


28 Mar, 2012                                                                                                      Page 2 of 4
March 2012, Volume I, Issue VIII                                                                                          agneya
                                Prices and Trade Volumes in FY2011-12

                                                                                  3,051     3,065   2,907
                                                                  2,891   2,950
                                                         2,710                                      200

                                                 2,300                            172       206


                                         1,789
    1,500    1,500      1,505    1,554                                     112
                                                                   106
                                                          96


                                                  46
                                          25
              19         16       19
     0

     Apr     May         Jun Jul 2011 Aug        Sep      Oct     Nov     Dec      Jan      Feb     Mar
    2011     2011       2011          2011       2011    2011     2011    2011    2012      2012    2012

                                         Traded Volume           Average Price


Source: REC Registry, IEX


            % Redemption of available RECs in the month                                   The     REC     market    displays  seasonal
                                                                 81%
                                                                       86% 85%            characteristics. Pattern of increase in price
                                                                                          and redemption may change in coming
            57%                                                                           financial year.
                                            48% 44% 51%
                  40%            39%
                         34% 37%                                                          a. Prices reached higher levels in last quarter
                                                                                             – this could be partly attributed to
   6%                                                                                        compliance pressure from buyers’ side and
                                                                                             to urgency of sellers to cash in on the
    Apr May Jun Jul Aug Sep Oct Nov Dec Jan Feb Mar
   2011 2011 2011 2011 2011 2011 2011 2011 2011 2012 2012 2012
                                                                                             energy generated within the financial year.
                                                                                          b. More redemption in last quarter – driven by
                                                                                             expectation of higher prices. Prices may
             Cumulative Redemption for FY by month end                                       increase in the first and second quarters in
                                                                                             the coming FY with more buyers looking to
                                                                 94% 96% 97%                 comply with RPO early in the year to avoid
                                    71%
                                                         80%                                 last quarter rush. Redemption may become
                        65% 64% 68%
            58% 59% 60%                                                                      even faster if quarterly compliance is
                                                                                             followed.
   14%


    Apr May Jun Jul Aug Sep Oct Nov Dec Jan Feb Mar
   2011 2011 2011 2011 2011 2011 2011 2011 2011 2012 2012 2012
                                                                                          Source: REC Registry


28 Mar, 2012                                                                                                                   Page 3 of 4
March 2012, Volume I, Issue VIII                                                                                agneya
   Scope for REC market in India is wide –                  Installed Capacity vs. Registered Capacity of RE
   FY2011-12 was encouraging in many ways.

   a. Significant unutilized potential yet to           Installed MW
      come on line – installed RE capacity grew
      by 23% in FY2011-12. REC mechanism
                                                      Registered MW
      will further boost investment in wind
      energy while solar photovoltaic market is
                                                                       0%       20%        40%       60%         80%        100%
      yet to start in earnest.
   b. Skew between installed capacity of RE              Wind    Bio-fuel cogeneration   Biomass   Small Hydro   Solar    Others
      and RE capacity registered for REC –
      Biomass and Cogen capacity has a
      comparatively bigger share in REC                           Registered REC capacity by State, MW
      registrations compared to installed wind           Uttar Pradesh                                                     658
      energy capacity.                                    Maharashtra                                             542
                                                           Tamil Nadu                                            529
   c. Participation from more States to boost                   Gujarat                   211
      market further – Uttar Pradesh,                     Chhattisgarh              92
                                                             Rajasthan         50
      Maharashtra and Tamil Nadu alone                          Punjab         46
                                                      Himachal Pradesh        35
      account for three quarters of RE capacity            Uttarakhand       24
      registration (in MW). Gradual entry of                     Kerala      21
                                                       Madhya Pradesh        21
      other States and more participation from                     J&K       18
      them will strengthen REC market further.                 Haryana      9


agneya
Promoted by alumni of IIM Ahmedabad and IIM Bangalore, we at agneya work with Renewable Energy
Generators to manage their REC accreditation, registration, issuances and trading. We also work with
companies covered by the Renewable Purchase Obligation (RPO) on optimum ways to fulfill these obligations.
agneya also provides services in the following areas –

Renewable Energy Project Management – advising clients on the best possible portfolio of renewable energy
(wind, solar, bio) across tariff regimes, technology options, electricity sales structuring and availing incentives
like REC and GBI.

Electricity Market Regulations – advising clients on regulatory aspects of electricity market, options for
realizing the maximum value from their energy assets and minimizing costs related to regulatory compliance.

Carbon & Energy – measuring carbon footprint, energy audits and current/future energy profiling to assess
risks and opportunities related to energy security and climate change.

Sustainability – building robust long term foundations for business i.e. managing economic, environmental and
social aspects of business. These include water management, sustainability management and reporting.

For further information on Renewable Energy Certificates or other services, please contact us at –
E-mail – rahul@agneya.in | Phone – +91-88 06 07 07 83 | Website – www.agneya.in


 28 Mar, 2012                                                                                                            Page 4 of 4

Contenu connexe

Plus de Agneya Carbon Ventures Private Limited

Agneya\'s Newsletter on Renewable Energy Sector and REC market in India
Agneya\'s Newsletter on Renewable Energy Sector and REC market in IndiaAgneya\'s Newsletter on Renewable Energy Sector and REC market in India
Agneya\'s Newsletter on Renewable Energy Sector and REC market in IndiaAgneya Carbon Ventures Private Limited
 

Plus de Agneya Carbon Ventures Private Limited (20)

Agneya\'s Newsletter on Renewable Energy Sector and REC market in India
Agneya\'s Newsletter on Renewable Energy Sector and REC market in IndiaAgneya\'s Newsletter on Renewable Energy Sector and REC market in India
Agneya\'s Newsletter on Renewable Energy Sector and REC market in India
 
Agneya\'s Newsletter on Renewable Energy Sector and REC market in India
Agneya\'s Newsletter on Renewable Energy Sector and REC market in IndiaAgneya\'s Newsletter on Renewable Energy Sector and REC market in India
Agneya\'s Newsletter on Renewable Energy Sector and REC market in India
 
Horizon V2 Issue 1
Horizon V2 Issue 1Horizon V2 Issue 1
Horizon V2 Issue 1
 
Rec Newsletter V1 Issue 1 Sep
Rec Newsletter   V1 Issue 1 SepRec Newsletter   V1 Issue 1 Sep
Rec Newsletter V1 Issue 1 Sep
 
Rec Newsletter V1 Issue 3 Nov
Rec Newsletter   V1 Issue 3 NovRec Newsletter   V1 Issue 3 Nov
Rec Newsletter V1 Issue 3 Nov
 
Rec Newsletter V1 Issue 5 Jan
Rec Newsletter   V1 Issue 5 JanRec Newsletter   V1 Issue 5 Jan
Rec Newsletter V1 Issue 5 Jan
 
Rec Newsletter V1 Issue 6 Feb
Rec Newsletter   V1 Issue 6 FebRec Newsletter   V1 Issue 6 Feb
Rec Newsletter V1 Issue 6 Feb
 
Rec Newsletter V1 Issue 7 Mar
Rec Newsletter   V1 Issue 7 MarRec Newsletter   V1 Issue 7 Mar
Rec Newsletter V1 Issue 7 Mar
 
Agneya Clientele
Agneya ClienteleAgneya Clientele
Agneya Clientele
 
Agneya Introduction Presentation
Agneya Introduction PresentationAgneya Introduction Presentation
Agneya Introduction Presentation
 
Rec newsletter v1 issue 1 sep
Rec newsletter   v1 issue 1 sepRec newsletter   v1 issue 1 sep
Rec newsletter v1 issue 1 sep
 
REC newsletter v1 issue 3 nov
REC newsletter   v1 issue 3 novREC newsletter   v1 issue 3 nov
REC newsletter v1 issue 3 nov
 
Rise of green buildings
Rise of green buildingsRise of green buildings
Rise of green buildings
 
Responsible investing
Responsible investingResponsible investing
Responsible investing
 
Introductory note on iso 14064
Introductory note on iso 14064Introductory note on iso 14064
Introductory note on iso 14064
 
Insight sustainability world_gbc
Insight sustainability world_gbcInsight sustainability world_gbc
Insight sustainability world_gbc
 
Insight climate change_india
Insight climate change_indiaInsight climate change_india
Insight climate change_india
 
Insight cdm redd
Insight cdm reddInsight cdm redd
Insight cdm redd
 
Carbon accounting advisory
Carbon accounting advisoryCarbon accounting advisory
Carbon accounting advisory
 
Agneya insight cdm and forestry
Agneya insight  cdm and forestryAgneya insight  cdm and forestry
Agneya insight cdm and forestry
 

Rec Newsletter V1 Issue 8 Apr

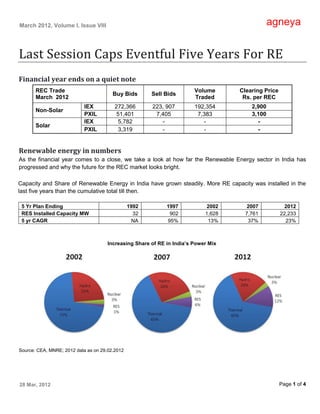
  • 1. March 2012, Volume I, Issue VIII agneya Last Session Caps Eventful Five Years For RE Financial year ends on a quiet note REC Trade Volume Clearing Price Buy Bids Sell Bids March 2012 Traded Rs. per REC IEX 272,366 223, 907 192,354 2,900 Non-Solar PXIL 51,401 7,405 7,383 3,100 IEX 5,782 - - - Solar PXIL 3,319 - - - Renewable energy in numbers As the financial year comes to a close, we take a look at how far the Renewable Energy sector in India has progressed and why the future for the REC market looks bright. Capacity and Share of Renewable Energy in India have grown steadily. More RE capacity was installed in the last five years than the cumulative total till then. 5 Yr Plan Ending 1992 1997 2002 2007 2012 RES Installed Capacity MW 32 902 1,628 7,761 22,233 5 yr CAGR NA 95% 13% 37% 23% Increasing Share of RE in India’s Power Mix Source: CEA, MNRE; 2012 data as on 29.02.2012 28 Mar, 2012 Page 1 of 4
  • 2. March 2012, Volume I, Issue VIII agneya Distribution of total installed power generating capacity Distribution of Total Capacity and RE Capacity and capacity of Renewable Energy is skewed amongst Regions. South accounts for 27% of total installed power generation capacity but 49% of installed RE capacity Total North South East West owing to wind energy capacity in Tamil Nadu. RE Source: CEA, East includes North East, South includes 0% 20% 40% 60% 80% 100% Islands; 2012 data as on 29.02.2012 REC trading was launched in March 2011. It Cumulative Trade Value in FY2011-12: Rs. 286 provides a market driven route for addressing Crores skewed availability of RE. After a hesitant first 286 few months, the market has now picked up and is substantial in size now – total traded value of 228 RECs in FY2011-12 was Rs. 286 crores. 165 113 80 49 13 23 0 3 5 8 Apr May Jun Jul Aug Sep Oct Nov Dec Jan Feb Mar 2011 2011 2011 2011 2011 2011 2011 2011 2011 2012 2012 2012 Source: REC Registry, Trade Numbers in ‘000 RECs Participants are warming up to the REC market. Evidence of this can be seen in various aspects of market performance in the last twelve months. a. Higher prices of RECs – prices picked up from floor level of Rs. 1500 to Rs. 3000 by last quarter of FY 2011- 12. There is more clarity now on what levels of pricing can be expected in the coming financial year. b. Increase in number of participants in trading – number of participants rose from mere double digits in first few months to around 400 in the last trading session. Higher number of participants encouraged better price discovery for RECs. c. More successful buy as well as sell bids – higher proportion of bids were cleared both from sellers as well as buyers. This shows better clarity on prices, which have been stable in the range of Rs 2,700 to Rs. 3100. 28 Mar, 2012 Page 2 of 4
  • 3. March 2012, Volume I, Issue VIII agneya Prices and Trade Volumes in FY2011-12 3,051 3,065 2,907 2,891 2,950 2,710 200 2,300 172 206 1,789 1,500 1,500 1,505 1,554 112 106 96 46 25 19 16 19 0 Apr May Jun Jul 2011 Aug Sep Oct Nov Dec Jan Feb Mar 2011 2011 2011 2011 2011 2011 2011 2011 2012 2012 2012 Traded Volume Average Price Source: REC Registry, IEX % Redemption of available RECs in the month The REC market displays seasonal 81% 86% 85% characteristics. Pattern of increase in price and redemption may change in coming 57% financial year. 48% 44% 51% 40% 39% 34% 37% a. Prices reached higher levels in last quarter – this could be partly attributed to 6% compliance pressure from buyers’ side and to urgency of sellers to cash in on the Apr May Jun Jul Aug Sep Oct Nov Dec Jan Feb Mar 2011 2011 2011 2011 2011 2011 2011 2011 2011 2012 2012 2012 energy generated within the financial year. b. More redemption in last quarter – driven by expectation of higher prices. Prices may Cumulative Redemption for FY by month end increase in the first and second quarters in the coming FY with more buyers looking to 94% 96% 97% comply with RPO early in the year to avoid 71% 80% last quarter rush. Redemption may become 65% 64% 68% 58% 59% 60% even faster if quarterly compliance is followed. 14% Apr May Jun Jul Aug Sep Oct Nov Dec Jan Feb Mar 2011 2011 2011 2011 2011 2011 2011 2011 2011 2012 2012 2012 Source: REC Registry 28 Mar, 2012 Page 3 of 4
  • 4. March 2012, Volume I, Issue VIII agneya Scope for REC market in India is wide – Installed Capacity vs. Registered Capacity of RE FY2011-12 was encouraging in many ways. a. Significant unutilized potential yet to Installed MW come on line – installed RE capacity grew by 23% in FY2011-12. REC mechanism Registered MW will further boost investment in wind energy while solar photovoltaic market is 0% 20% 40% 60% 80% 100% yet to start in earnest. b. Skew between installed capacity of RE Wind Bio-fuel cogeneration Biomass Small Hydro Solar Others and RE capacity registered for REC – Biomass and Cogen capacity has a comparatively bigger share in REC Registered REC capacity by State, MW registrations compared to installed wind Uttar Pradesh 658 energy capacity. Maharashtra 542 Tamil Nadu 529 c. Participation from more States to boost Gujarat 211 market further – Uttar Pradesh, Chhattisgarh 92 Rajasthan 50 Maharashtra and Tamil Nadu alone Punjab 46 Himachal Pradesh 35 account for three quarters of RE capacity Uttarakhand 24 registration (in MW). Gradual entry of Kerala 21 Madhya Pradesh 21 other States and more participation from J&K 18 them will strengthen REC market further. Haryana 9 agneya Promoted by alumni of IIM Ahmedabad and IIM Bangalore, we at agneya work with Renewable Energy Generators to manage their REC accreditation, registration, issuances and trading. We also work with companies covered by the Renewable Purchase Obligation (RPO) on optimum ways to fulfill these obligations. agneya also provides services in the following areas – Renewable Energy Project Management – advising clients on the best possible portfolio of renewable energy (wind, solar, bio) across tariff regimes, technology options, electricity sales structuring and availing incentives like REC and GBI. Electricity Market Regulations – advising clients on regulatory aspects of electricity market, options for realizing the maximum value from their energy assets and minimizing costs related to regulatory compliance. Carbon & Energy – measuring carbon footprint, energy audits and current/future energy profiling to assess risks and opportunities related to energy security and climate change. Sustainability – building robust long term foundations for business i.e. managing economic, environmental and social aspects of business. These include water management, sustainability management and reporting. For further information on Renewable Energy Certificates or other services, please contact us at – E-mail – rahul@agneya.in | Phone – +91-88 06 07 07 83 | Website – www.agneya.in 28 Mar, 2012 Page 4 of 4