Challenges of urban Growth in India: By Anumita Roychowdhury
MOBILITY IN CITIES DATABASE - June 2015
1. JUNE 2015
INTRODUCTION
After a period of erosion, public transport is on a growing trend again,
particularly in developed economies, where urban sprawl tends to be
slowing down. In developing and transition economies, urban mo-
bility demand is pushed up by population and economic growth.1
This puts public transport networks under pressure; furthermore
the share of public transport tends to be declining in those cities,
while car ownership is soaring. Overall, public transport growth is the
strongest where efforts to increase its supply are matched by policies
that manage private vehicle demand and increase urban density.
This report provides information on the evolution of urban mobility
patterns in the last 20 years, highlighting new trends and different tra-
jectories for different groups of cities. In particular, it shows which policies
underpin strong growth in the modal share of public transport and other
sustainable modes. At the mid-term of the UITP strategy of doubling the
market share of public transport by 2025, this report will provide support
and inspiration to cities gearing themselves towards reaching this ambi-
tious objective. The report also highlights important relationships between
the modal share of public transport and the characteristics of the urban
transport system.
Data used in this report were collected for 60 metropolitan areas world-
wide for the year 2012.2
The database covers demography, the economy,
urban structure, the number and use of private vehicles (including taxi),
the road network, public transport networks (infrastructure and rolling
stock, supply and demand, farebox revenue), and mobility patterns.
These data were compared to those collected for the years 1995 and
2001, in previous editions of the Mobility in Cities Database, when the
same detailed definitions for data and metropolitan areas could be used.
The harmonisation of data between cities and through time was made dif-
ficult by the dispersion of sources, the diversity of methodologies, and
the limited availability of data. Detailed common definitions were used to
provide data of the best possible quality.
SYNTHESIS REPORT
MOBILITY IN CITIES DATABASE
1 Cities in developed countries are those from OECD countries plus Hong Kong, Singapore and Dubai. The rest of the cities in the sample were grouped as ‘developing’.
2 Larger cities are over-represented in the sample.
OVERALL URBAN MOBILITY TRENDS
URBAN DENSITY
In the second half of the twentieth century urban planning, particularly
in developed countries, has focused on private cars as the primary means
of transport for residents, leading to urban sprawl, characterised by a
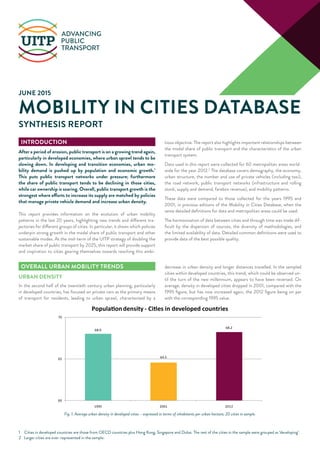
decrease in urban density and longer distances travelled. In the sampled
cities within developed countries, this trend, which could be observed un-
til the turn of the new millennium, appears to have been reversed. On
average, density in developed cities dropped in 2001, compared with the
1995 figure, but has now increased again, the 2012 figure being on par
with the corresponding 1995 value.
68.0
64.5
68.2
60
65
70
1995 2001 2012
Populationdensity - Cities in developed countries
Fig. 1. Average urban density in developed cities – expressed in terms of inhabitants per urban hectare; 20 cities in sample.
2. 2
URBAN DENSITY AND MODAL SPLIT
Urban residents’ mobility choices are strongly linked with density. In denser areas there is a higher propensity to opt for modes other than private
cars. The shorter trip distances associated with high density areas naturally lend themselves to more walking and cycling. Higher density areas also
involve high concentration of activities, thereby allowing public transport to efficiently connect the locations where the origins or destinations of
trips are concentrated.
Vienna
Geneva
Birmingham
Berlin
Hamburg
Munich
Rome
Turin
Paris
London
Oslo
Prague
Stockholm
Goteborg
Mashhad
Lagos
Casablanca
Tokyo
Hong Kong
Ankara
Singapore
Budapest
Barcelona
Zurich
Delhi
Brisbane
Abu Dhabi
Milan Strasbourg
Niigata
Shizuoka
Jerusalem
R² = 0.43
0%
10%
20%
30%
40%
50%
60%
70%
80%
90%
100%
0 50 100 150 200 250 300
Urban population density
Modalshareofsustainabletransportmodes(walking,cycling
andpublictransporttripsasapercentageoftotaltrips)
Fig. 2. Share of total daily trips undertaken by sustainable transport modes – walking, cycling and public transport – out of the total number of daily trips (vertical axis)
explained by urban population density in metropolitan area (horizontal axis).
MOTORISATION
The total number of cars owned by urban residents increased at a diffe-
rent pace around the world: in developed cities there was an average an-
nual growth of 2.9% from 1995 to 2001 and only of 1.5% per year since
2001. In the developing cities considered, the total number of cars nearly
quadrupled between 1995 and 2012 (at an annual growth rate of 8.3%)
creating considerable pressure on urban transport infrastructure. While
population increase plays a role in the growth in the number of cars, the
comparison of motorisation rates shows different dynamics for cities in
developed and developing countries.
The rate of motorisation in developed cities has almost stopped growing
between 2001 and 2012. Motorisation grew by an annual average of 2.3%
between 1995 and 2001, while the annual average growth has been 0.5%
after that. Cities in developing countries saw a strong increase in motori-
sation between 1995 and 2012 (4.6% average annual growth), but it must
be said that developing cities still have a much lower motorisation rate.
345
403
418
117
254
0
50
100
150
200
250
300
350
400
450
1995 2001 2012
Motorisation
Cities in developed countries Cities in developingcountries
Fig. 3. Average rate of motorisation – expressed in registered cars per 1000 inhabitants – in 20 cities in developed countries and 5 cities in developing countries.
3. 3
Furthermore, it is interesting to note a shift in the use of cars within cities
in developed countries. Analysing data from city-wide mobility surveys,
UITP calculated the average annual distance travelled in cars, whether as
a driver or a passenger. The data refer to trips undertaken by residents
within the area. Since 1995 we notice a consistent downward trend in dis-
tances travelled by private vehicles: the average distance travelled in cars
by each resident has decreased from 4,700 kilometres annually in 1995,
to 4,400 in 2001 and 3,800 in 2012.
These developments would seem to suggest that the context is quite
conducive to public transport growth in cities within developed econo-
mies, while being more challenging in those within developing economies.
PUBLIC TRANSPORT SUPPLY
In developed cities, the total supply of public transport, expressed in
vehicle x km, has increased by an average of 2.3% annually between 1995
and 2001 and by 1.2% per year since. In developing cities supply grew by
an estimated 3.9% annually from 1995 to 2012 (see figure 4).
On average, the supply of public transport per urban resident has re-
mained stable since 2001, at just over 100 vehicle x kilometres per inha-
bitant in cities within developed economies. Cities such as Beijing, Gene-
va, Madrid, Oslo, or London have increased supply at a higher rate than
the population increase over the 2001-2012 period. Conversely, while
the total supply of public transport in Singapore increased significantly,
by approximately 20%, it did not grow as fast as the population (+ 60%).
However, it must be noted that expressing public transport supply in
terms of vehicle x kilometres, as done above, has the disadvantage of
overlooking the replacement of older vehicles by newer ones of higher
capacity. Analysing data on the number of place x kilometres provided
by operators showed that cities such as Vienna, Geneva, Hong Kong, or
Warsaw improved public transport supply in this way. On average, in the
developed cities analysed supply expressed in place x kilometres increased
at an annual rate of 1.8%, between 2001 and 2012, above the correspon-
ding figure for vehicle x kilometres.
114
130
190
80
100
120
140
160
180
200
1995 2012
Index1995=100
Public transport supply in Vehicle x km
Cities in developed countries Cities in developingcountries
Fig. 4. Average evolution of public transport supply between 1995 and 2012 in 21 cities in developed countries and 4 cities in developing countries.
PUBLIC TRANSPORT DEMAND
The total number of journeys3
by public transport in developed cities has
steadily increased at a rate of 1.5% per year up to 2001 and 1.6% per year
afterwards. In developing cities, the corresponding average annual rate of
growth in demand was 2.7%.
In cities in developed economies public transport demand per capita grew
from an average of 395 trips per capita in 1995, to 414 in 2001 and it
continued to grow afterwards, albeit at a slower pace, reaching an average
of 419 journeys per inhabitant in 2012.
3 A public transport journey is befined as a boarding in a public transport vehicle.
4. 4
It is also expected that the number of journeys by public transport in a
city varies with resident population. In the graph above the red line des-
cribes equal changes in public transport demand and resident population,
between 2001 and 2012. In cities plotted above the line, like Berlin, Hong
Kong or Paris, the number of journeys by public transport increased at a
faster pace than the resident population.
34.1%
33.2%
39.7%
35.5%
23.7%
0%
5%
10%
15%
20%
25%
30%
35%
40%
45%
1995 2001 2012
Percentageofmechanisedandmotorisedtrips
Public transport modal share
Cities in developed countries Cities in developingcountries
Fig. 6. Average public transport modal share in 2012 – calculated as the share of daily trips by public transport out of the total number of motorised and mechanised trips
– in 16 cities in developed countries an 4 cities in developing countries.
Vienna
Geneva
Berlin
Munich
Rome
Paris
London
Oslo
Prague
Tallinn
Tehran
Stockholm
Johannesburg
Casablanca
Hong Kong
Singapore
Beijing
Budapest
Madrid
Warsaw
Athens
-20%
-10%
0%
10%
20%
30%
40%
50%
60%
-20% -10% 0% 10% 20% 30% 40% 50% 60%
Changeinpublictransportdemand
Change in population
Fig. 5. Change in the number of metropolitan area residents between 2001 and 2012 (horizontal axis) and change in the number of total journeys undertaken by public transport
between 2001 and 2012 (vertical axis). The dotted line shows equal changes in the two variables.
MODAL SPLIT4
The share of public transport trips out of motorised and mechanised urban
trips (referred in this document as the modal share of public transport) in-
creased, on average, by about 20% between 2001 and 2012 in developed
cities. This is a reversal of the trend observed between 1995 and 2001, when
the modal share of public transport had been slowly decreasing. By contrast,
in developing cities, the modal share of public transport decreased, on ave-
rage, by 33% between 1995 and 2012.
4 Mobility figures used by UITP consider each door-to-door movement as one trip. Each trip is assigned to a principal mode (walking, cycling, public transport,
private motorised).
5. 5
EXPLORING URBAN MOBILITY TRAJECTORIES
The analysis of the database highlights different trajectories for different
groups of cities. Each trajectory is associated with specific variations of
urban density, motorisation, public transport supply - expressed in vehicle
x km per inhabitant and distance travelled by private car - expressed in
passenger x km per inhabitant. The description of these different trajecto-
ries sheds light on the adequate policy mix needed to reach the objective
of increasing the modal share of public transport worldwide. Table 1 provi-
des a synthesis of the groups of cities and their respective variations across
the indicators considered.
MODAL CHOICE AND RELATIVE SPEED
0%
10%
20%
30%
40%
50%
60%
70%
80%
90%
100%
0.5 1 1.5 2 2.5 3 3.5 4
Modalshareofsustainabletravelmodes
(%ofthetotaltripsbypublictransport,cyclingandwalking)
Relative door to door speed of trips by private cars vs. public transport
Fig. 7. Modal share of sustainable travel modes – calculated as the share of walking, cycling and public transport trips out of the total number of urban trips – as explained by
the relative door-to-door speed of private cars and public transport.
Using data on the average lengths and durations of trips undertaken in metropolitan areas, UITP computed the average door-to-door speed of
different transport modes, and investigated if the relative speed of the modes influences residents’ modal choice. Door-to-door speed gives a more
accurate representation of the traveller’s experience as it also takes into account time spent while transferring on different public transport modes,
as well as walking stages to or from the parking space or public stops. It is interesting to note that in five of the cities analysed the door-to-door speed
of trips by public transport was better, or on par with that of trips by private car, while in an additional nine cities the ratio between door-to-door
speeds is below 1.5. The graph suggests that when private and public motorised transport modes are comparable in terms of speed, urban residents
are more likely to move away from private cars.
TRAJECTORY 1: ON TRACK FOR BETTER MOBILITY
In Vienna, Paris, London, Oslo, Prague and Geneva, the modal share of
public transport increased by 20% or more between 2001 and 2012. In
Vienna, following two decades of regular growth, the share of daily trips
made by public transport reached 54% in 2012 – one of the highest in Eu-
rope. Another case in point is Prague, where a decline in public transport
modal share was reversed.
Urban density increased in Vienna, London, Oslo and Prague between
1995 and 2012. The motorisation rate decreased in Vienna, London, Pa-
6. 6
ris and Geneva between 2001 and 2012, marking a reversal of trend in
all four cities. In London, Paris and Geneva, the motorisation rate was
actually lower in 2012 than in 1995. For instance it fell to 307 cars per
1000 inhabitants in London. These cities implemented a range of traffic
restriction measures in the past ten years (such as congestion charging in
London or parking restrictions in Paris).
In this context, distances travelled by private car per person decreased by
more than 30% in Vienna, Paris, London, Oslo, and Prague between 1995
and 2012.
Public transport supply (expressed in vehicle x km) per inhabitant in-
creased in all six cities, including in those exhibiting strong population
increases, such as London and Oslo. In these cities the volume of public
transport supply increased by 37% between 1995 and 2012.
TRAJECTORY 2: MAINTAINING THE STATUS QUO
In Berlin, Munich, Helsinki, and Barcelona, the modal share of public
transport compared to that of private cars was broadly similar in 1995
and 2012, but the share of walking and cycling increased significantly. In
Hamburg, Glasgow and Tokyo, the relative share of all modes was broadly
similar in 1995 and 2012 – even though it fluctuated during this period.
The motorisation rate increased in all cities – except for Munich. Average
distances travelled by private car per person increased everywhere, except
for Tokyo. Tokyo reflects a general decrease in trip length as the popula-
tion is growing faster in the central area - within 10 km of the city centre
– than further out within the metropolitan area.
Public transport supply per inhabitant increased everywhere (except in
Helsinki where its growth was not as fast as the population). This shows
that the development of public transport supply alone may not be suf-
ficient to increase the modal share of public transport, it must also be
complemented by private vehicle demand management measures. Fur-
thermore, public transport must be integrated in urban planning and de-
sign policies aimed at maintaining urban density. Only by combining these
measures in an integrated way can cities reap the full benefits of supply
improvements.
TRAJECTORY 3: UNDER PRESSURE
The modal share of public transport has decreased by 20% or more in
Tehran, Casablanca, Johannesburg and Delhi between 1995 and 2012. It
represents less than 30% of the trips in these cities, which are characte-
rised by strong population growth and economic development.
In that economic context, motorisation is increasing very fast: it tripled in
Delhi and quadrupled in Tehran between 1995 and 2012.
In these cities, the growth in public transport supply did not match the
growth in population. Keeping the attractiveness of public transport thus
requires massive investments.
OTHER TRAJECTORIES
Quite a unique case, Hong Kong sees public transport having a dominant
role (about 80% of trips in 2012). Public transport supply per inhabitant
increased by more than 20% between 1995 and 2012.
In spite of a strong growth in motorisation (460 cars per 1000 inhabitants
in 2012), the modal share of public transport in Dubai increased by 15%
between 2001 and 2012, while public transport supply doubled during the
same period.
The erosion of the modal share of public transport in Budapest (-40%
between 1995 and 2012) is relatively typical of Eastern European cities.
Public transport supply decreased by about 20% between 1995 and 2012
and motorisation is catching up with the level of other similar European
cities.
7. 7
Table 1: Summary of developments in selected cities across five indicators between 1995 and 2012: public transport modal share, urban density, motorisation rate, passenger x
kilometres travelled by private cars per capita and public transport supply per capita.
City
Public transport
modal share
Urban density Motorisation rate
Passenger x km
per inhabitant in
private cars
Vehicle x km per
inhabitant by
public transport
On track for better mobility
Vienna
Paris
London
Oslo
Prague
Geneva
Maintaining the status quo
Barcelona
Berlin
Munich
Helsinki
Hamburg
Glasgow
Tokyo
Under pressure
Tehran
Casablanca
Delhi
Other trajectories
Hong Kong
Budapest
Singapore
Dubai
The colours in each cell represent the evolution over the studied period according to the following scale:
Growth above 10%
Relative stability: the variation is between -10% and +10%
Decrease by 10% or more
Data not available, or not verified at the time of publication
8. rue Sainte-Marie 6, B-1080 Brussels | Belgium | Tel +32 (0)2 673 61 00 | Fax +32 (0)2 660 10 72 | info@uitp.org | www.uitp.org
This is a publication of the International Association of Public Transport. UITP has over 1,400 member companies in 96 countries throughout
the world and represents the interests of key players in this sector. Its membership includes transport authorities, operators, both private and
public, in all modes of collective passenger transport, and the industry. UITP addresses the economic, technical, organisation and management
aspects of passenger transport, as well as the development of policy for mobility and public transport world-wide.
For further information please contact Jérôme Pourbaix, Mircea Steriu, Pedram Saeidizand.
CONCLUSION
The modal share of public transport is growing in cities which demons-
trated a long term commitment not only to improving public transport
supply, but also to managing demand for individual mobility and control-
ling urban sprawl.
Data presented in this report shows that reaching the objective of dou-
bling the market share of public transport by 2025 would require in-
creased efforts in terms of public transport supply improvements, private
vehicle demand management and integrated urban planning policies. This
study also highlighted the need to improve the availability and comparabi-
lity of urban transport data, and to develop new methodologies to better
describe new mobility habits and intermodal travel.
The data gathered and quoted throughout this synthesis report will be re-
leased in electronic format.
UITP wishes to thank its member organisations and contacts world-
wide for their continuous support during this exercise.
PUBLIC TRANSPORT AND USE OF URBAN SPACE FOR MOBILITY
It has been demonstrated that public transport enables a more efficient use of urban road space. Additionally, the graph below showsthe relationship
between public transport modal share and functional use of urbanised land within metropolitan areas. There is a negative relation between the two,
as illustrated in the chart above: when public transport is more widely used – i.e. a higher modal share of trips – the percentage of the urban space
serving the transport function is lower. Given that land is one of the scarcest resources in cities, aiming for a higher use of public transport could
bring the added benefits of allowing urbanised space to serve other functions, which can in turn improve the liveability, or productivity of the me-
tropolitan area.
0%
5%
10%
15%
20%
25%
30%
35%
10% 20% 30% 40% 50% 60% 70% 80% 90%
Shareofurbanisedareausedforlandtransport
Public transport modal share (% of motorised and mechanised trips)
Fig. 8. The share of the urbanised area used for transport – calculated as the ratio between the urban surface used for land transport and the total urbanised surface – ex-
plained by the modal share of public transport – calculated as the share of trips undertaken by public transport out of the number of daily motorised and mechanised trips.