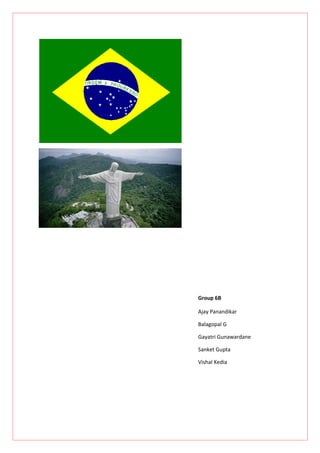
Macroeconomical Overview Of Brazil
•
20 j'aime•13,400 vues

A research report on the Macroeconomical factors of Brazil

Recommandé
Contenu connexe
Tendances
Tendances (20)
En vedette
En vedette (20)
Similaire à Macroeconomical Overview Of Brazil
Similaire à Macroeconomical Overview Of Brazil (20)
Macroeconomical Overview Of Brazil
- 1. Group 6B Ajay Panandikar Balagopal G Gayatri Gunawardane Sanket Gupta Vishal Kedia
- 2. In our quest to know more about the macroeconomic policies in detail of one of the emerging economies, we have selected Brazil as the country to dwell more into. Although the study list is an exhaustive one we nailed down on four key aspects we thought would help us in this study. We define those key aspects as CCCF which resounds the erstwhile CCCP. They are Capital Flows, Competitive advantage, Communication and Fiscal policy (synonymous to Politics is many aspects). The history and other aspects of Brazil would be covered in each of the parts based on the relevance. Capital Flows Brazil’s achievement of macroeconomic stability and its success in strengthening its flexibility to external shocks help explain the growth of the country’s attractiveness as a destination for foreign capital flows. The Brazilian economy has been open to foreign capital inflows since a long time now. In fact it is of significance importance to the country has the domestic savings only account of 20% of the total GDP. The economy of Brazil has grown from 3.2% in 2005 to 6% till June 2008 but its current account as a percentage of its GDP has shrunk to a deficit of 1.2% from a surplus of 1.6%.
- 3. Brazil continued to have foreign inflow growth through the year of 2000 despite the Asian crisis of 1997, the Russian crisis of 1998 & the Brazilian crisis of 1999. But it started seeing a turnaround from the year 2001 with the shrinkage of trade & investment flows due to a world economic slowdown with the Foreign Direct Investment (FDI) inflows reaching a new low in 2003 at US$ 10.1 billion. But this slightly improved in the year 2004 only to see it fall again in 2005. The net FDI liabilities reached $328.5 billion in 2007 which was as much as 1/3rd of its gross external liabilities. The increase of FDI inflows coupled with the increase of outflows of the income has seen to have a relation with the non-resident investments. The outflows had almost doubled from 2005 as compared to the previous years, touching $11 billion. Since then Brazil has seen an upward trend and has also resulted in the appreciation of Brazilian real (BRL).
- 4. This growth in the domestic market along with the predictability of policies has made Brazil an attractive place for the foreign investors and thereby resulted in increased foreign capital flows. The increased flows have also been largely due to the increased mergers and acquisitions which have taken place in Brazil. It has been observed that since the privatization process in the second half of the 1990’s the number of mergers and acquisitions have substantially increased. But in spite of this increase these inflows have not contributed significantly to the development of new productive capacity. Thus since the change in the economic policies in the second half of 1990s Brazil has seen immense flexibility in its financial sector. The macroeconomic stabilization along with higher inflation had led to the rapid growth of the country. The country has seen strong inflows on account of increased exports and imports which have led to trade surpluses contributing to the growing trends. These growing inflows combined with decrease in debts have changed the capital structure of the balance of payments of Brazil. The country has overall reduced its risk through its public sector developments. Therefore these developments will make the economy stronger and sturdy which will result in making it more resilient to shocks due to external factors.
- 5. Tax rates Fiscal Policies Government Expenditures Blast from the past Politics and fiscal policies go hand in hand, hence the political winds of change Brazil has gone through is of prime importance. It had a democratic stint and a military regime from the 1950’s to mid 1980’s. The kind of growth Brazil achieved by a mix of higher exports and protectionism (Import- substitution industrialization) was enviable. The country used to achieve consistently nearly 7.5% growth. During this high growth phase there was a period of five years when Brazil experienced stagnation in the growth. This led to some of the important reforms in Brazil which included the creation of BACEN (central bank). Since the high growth phase had its cons and one of that was the overvaluation of its currency. The currency which was pegged to dollar had overvalued and this affected the exports. The only measure to undervalue the currency then was to increase the money supply which led to the hyper inflation
- 6. which hit the spine of the economy of Brazil. The 1980’s period is also known as the lost decade in Brazil because of stagflation. Since then a slew of measures including the real plan of 1994 helped the economy sustain and withstand many crisis which hit the world economy since then. Tastes of Today The present fiscal policy is an expansionary one. The government set out a new policy initiative in January 2007 which was nearly 3 billion USD and would increase to around 5 billion USD. The investment is planned by mainly through tax cuts. The primary concentration was infrastructure development and housing. This coupled with rising commodity prices was helping Brazil in growing at a sustained rate of 4.5-5% and increasing their surplus till 2008, however this downturn has cut that growth prospects to nearly 0.5 percent. Since the interest rates were high in Brazil a lot of carry trade also helped bolster the economy of the country. Brazil is able to keep the neck out of water and achieve some positive growth is only because of the sound economic policies of the government led by Luiz Inancio Lula Da Silva. The current Forex Reserve of Brazil is a sound 200 billion USD which helps in providing a cushion for the government to roll out expansionary fiscal policies which can help the country tide over this recession. As always the only fear in infusing more fiscal spending is the threat of Inflation. Brazil was wrecked during the hyper inflation period and under the Lula governance the inflation has come down and has been stable around the 4 – 5 % mark which is a healthy rate. "'In this world nothing can be said to be certain, except death and taxes."-Benjamin Franklin Brazil follows a progressive tax system wherein the individual tax rates vary between 0% and 27.5% and is based on the income levels. People with an Annual income less than BRL 15764 are exempt from taxes and henceforth progressive. Tax deductions are directly from the salaries. There are several types of deductions like payments for educational expense, pension plans etc. In the wake of recession Brazil has taken proactive steps in cutting tax rates where tax on financial transactions was cut from 3% to 1.5%. Income taxes were also lowered and the costs of these cuts were estimated to be 0.5% of GDP. The nominal budget deficit for the year 2008 fell to nearly 1.2 percentage of the GDP. The debts which were accumulated might not be wiped out as soon as the government had predicted when the going was good due to the current situation. Government expenditures are on the rise in Brazil since the public payroll bill has been escalating ever since. This would only add to the woes of the government in the wake of this recession.
- 7. Fantasies of the Future B for basement If the B of the BRIC stands for Brazil in the books of Goldmansachs then one could also consider the B as basement. Hence for the success story to continue a proactive fiscal policy is imperative Brazil could infuse a lot of government spending in to the economy by means of fiscal stimulus. Lula is a proactive president and in the wake of the current recession Brazil might have to pull up their socks if they have to sustain their growth story. The government could bail the country out by means of infrastructure spending which would mean that the economy would get a boost if Keynes equation of aggregate demand is considered. The income levels would rise which means there is a chance of inflation in the long run. A suggestion to the government would be to increase the individual tax rates from the present 27.5% to nearly 40% by introducing another slab of income tax rates. Since it is progressive the levels of income and slabs could be increased as a strategy so that Government could increase its revenues. This would ensure that the disparity in the distribution of income comes down and also the government can reduce the fiscal deficit they would encounter by infusing more fiscal spending. In the long run as the economy revives Brazil would be better off following Keynes advice of levying higher tax rates so as to reduce the deficits which was a nightmare for them in the 1980’s. Stability in the Government is also an important factor to be considered for a stable macroeconomic policy. The growth story would be better off if Brazil gets a single party majority to rule the government. The present story is quite different since Lula who is a proactive president is unable to
- 8. Communication Brazil contributes to more than 45% of IT markets in Latin America. This number is projected to grow at a rate of 11 percent for the coming years. It can be said that Brazil has a very diverse market with expenditures evenly segmented in the software, hardware and the services sectors. The south of Brazil is one for the fastest growing region and it can be said that it is prospering due to various incentives by the Brazilian government. In contrast, the northern Brazil contributes only 8.3 % of the investments. In 2007, around 20 percent of Brazils IT spending was on financial sector, and most of this was invested into banks. Brazil also has a huge market for mobile phones, with 3 of the biggest players in the mobile phone market being foreign investors. It has 143 million mobile phone subscribers, ad this number is growing steadily. Also, several broadband operators and fixed lines are also owned by international companies. Brazil is in the process of expanding IT in various segments in a big way. In 2009, a 300,000 PC units tender will be implemented which will be used in the education sector. The government has special facilities through which teachers and schools are eligible for easy financing when they buy laptops or other PC equipments. Also growth in the consumer segment for PC and laptops is expected to be stronger due to a wide array of financing schemes and flexible payment options. In general, Brazil’s economy has shown a considerable growth in finances for IT products and services. Currently Brazil is 12th positioned in the software development and services sector. Although software piracy rate in Brazil is very high, there are some stringent anti-piracy laws in place due to which this industry is beginning to gain grounds in Brazil. There are around 8000 software companies
- 9. in Brazil, but most of them are small and mid-sized companies, and none of them have an international presence. The market leaders in PC hardware in Brazil is the local company Positivo Informatica and it owns around 15% of the market share. As a matter of fact, it sold more than twice the number of units sold in 2008 by its closest competitors Dell and HP. Philips is also planning to invest into the Brazilian IT market with its line of notebook computers. As the PC penetration is limited to below 25 percent currently, there is a lot of scope for growth in this sector over the coming 5 years in Brazil. It is estimated that currently there are around 30 million PCs in Brazil and this number is expected to grow to at least 100 million in the next decade. The tremendous projected growth in the PC industry is also reflected number of broadband subscribers. The number of broadband subscribers is expected to grow to 22 million in the next 5 year. With the various applications requiring higher and higher bandwidths, the operators are constantly challenged to offer high speed connections to the consumers. Due to this stiff competition, fixed line operators are also encouraged to offer better and more competitive services. E-commerce Brazil has more than 40 million Internet users which is around 20 percent of Brazilian population. This number is expected to increase steadily over the next few years. The government has also started a lot of projects which are aimed at increasing the population of internet users. The Brazilian economy is expected to grow at 3 percent despite the current economic crisis. The electronic industry is expected to grow at an even better rate because of the increase in competition and the favorable exchange rate. As a result of the infrastructure projects announced in recent
- 10. times, the generation, transmission and consumption of electric energy is expected to grow over the years. The employment trend in this sector is also stable with 166,000 employees in this segment in the current year. Some of the key market indicators in Brazil are as follows: • The PC penetration rate is below 25 percent and the government has plans of equipping all the elementary schools with computers – this shows that there is a lot of scope for expansion in this sector. • The government has a Growth Acceleration Plan (PAC) through which US$ 23 billion will be invested on science and technology. • There is a very competitive scenario between fixed-line and mobile wherein both seek to remain ahead of each other through investments and providing new services. • Telecoms regulator is looking at ways of accessing Brazil’s more remote areas with CDMA450 networks are being used to provide access to Brazil’s more remote area by the telecom regulator. • There is plenty of opportunity for growth in broadband market – the penetration in 2008 was 5 percent. Opportunities One of the major sectors which has potential for growth in IT and telecom services is the banking sector. This is because of the scope of growth in the wide portfolio in terms of branches, ATMs, internet banking etc. Technologies like IP-based solutions, digital signature, WLAN, and mobile data transmission, has found enormous potential in specific market segments, and is expected to raise the overall level of technology investments by the Brazilian financial market. The PC market leader in Brazil Positivo is expanding and the growth is expected to continue extending its reach to the retail segment and the SME segment. IBM is the leading company and has the largest market share in the IT services sector. The mobile operators have a challenge to reach to new markets by extending their subscribers by reaching into the rural market by providing new services. Vivo, TIM and Claro are the top three operators and Oi is expected to experience a significant gain in terms of market share.
- 11. Competitive Advantage The world’s tenth largest economy Brazil is the largest and most populous country of South America. Brazil has today emerged as one of the fastest growing countries in the world, and stands as a part of BRIC nation fueling world growth. Till 1985 Brazil was under military rule until 1988 when a new constitution was ratified, and biggest challenge for the country that time was to arrest Hyperinflation and advance reforms to liberalize economy. Till 2003 Brazil has huge external debt and Inflation rate, but today it has been able to arrest both External debt to GDP Ratio and Inflation. Brazil emerged as one of the visionary nation of the world, and it first focused on macroeconomic stability as pre-condition for growth. Today, the macroeconomic conditions of Brazil are more favorable then they have been for decades. Some of the key macroeconomic conditions favorable for Brazil as compared to other BRIC (Brazil, Russia, India and China) are –
- 12. • Inflation is stabilized at 4% since 2006 • Huge forex reserve of $203 billion USD as of Mar-2009 • Unlike other BRIC nation, Brazil don’t have any serious disputes with its neighbors Brazil biggest strength is commodity trading ranging from Beef to Soybean. Today Brazil economy is regarded as Investment grade economy (credit Rating of BBB-) driven by diverse range of economic activities such as agriculture, industry and a multitude of services. The opening of Brazil economy after formation of federal republic in 1988 was a turnaround for Brazil success. Brazil maintains good trade relationship with United States, China, Germany and Argentina. Competitive Advantage of Nations Diamond Model Let’s now use Porter’s Diamond model to analyze the competitive advantage for Brazil. Comparative Advantage factors for Brazil are as follow – Land- Occupying more than 50% of South America, Brazil is the fifth largest country in the world. It has diverse topography, including hills, mountains, plains and scrublands. Brazil occupies area along the shores Atlantic Ocean, with continuous supply of water and acting as hinterland for trade activities. Location – Brazil due to its location and different time zones is rapidly emerging as a global offshore service destination. Natural Resources- Perhaps the biggest advantage for Brazil over other nation is its natural resources. Brazil is a natural resource rich country. Brazil exports with little effort export
- 13. around $90million worth of pine every year, and still around 600 varieties of palm trees - source of fiber, sacking, fuel, cattle-feed and oils stand unused. Other natural strengths of Brazil are Iron ore, Bauxite, Rubber and Seafood. Brazil soil is so rich that it can grow any crop, with potential to make Brazil world greatest agriculture nation. Currently, Brazil is major exporter of Coffee, Soya bean, Rice, Tomatoes, jute and cotton. Brazil grows more banana and Pineapple than any other country of the world but export very little (a untapped area for Brazil to focus) Labor – With huge population base and Brazil provides cheap labor to develop economies of the world. Labor in Brazil is cheaper than most of European and North American countries. Demography – Brazil population is a diverse mix of all races and ethnic groups. Genetically, most Brazilian has some degree of European, African and Amerindian origin. Such a wide diversity provides Brazil a comparative advantage over other nations. Above factors are of no benefit for Brazil, if they are not used for competitive advantage over other emerging countries having similar comparative advantage. Today Brazil Government and Industry are working together to establish competitive advantage for Brazil. • Factor Condition- Skilled Labor, Capital, Infrastructure facilities along with comparative advantage factors acts as a specialized factor for growth. And as Brazil has started investing huge on education, Infrastructure etc, these specialized factors are providing Brazil a competitive advantage. • Demand Condition- Due to growing consumerism and education, people of Brazil have become more informed and demanding. And so the industries are under high pressure to for innovation and high quality products. • Related and Supporting Industries- Major Industries in Brazil are automobiles, steel and petrochemicals, accounting one-third of Brazil’s GDP ($1.9 trillion). All these industries are related to abundant supply of natural resources of Iron ore, Bauxite, Rubber etc. • Firm Strategy, Structure and Rivalry – Brazil firms have today become more informed and structured. Today Brazil has the second most advanced industrial sector in American sub continent. Brazil has highly diversified and sophisticated service industry with intention growing competition. The government of Brazil with help from International agencies such as IMF and World Bank are fueling the growth of Brazil by investing big time on infrastructure and education. Moreover, trade liberalization policy since 1990, along with large devaluation of BRL twice in 1999 and 2002, has helped Brazil to maintain competitive advantage in the world market. Brazil exhibits a competitive advantage in many fronts. Of course, this is a non-exhaustive list, but some light is shed upon on some of the fronts below (1) Agricultural/Farm produce (2) Automobile industry
- 14. (3) Possession of a Strategic Satellite Launching Centre (4) Innovation (5) Tourism (6) Industry (7) Forestry Products (1) Agriculture/Farm produce Brazil is a major producer and exporter of agricultural/farm produce such as sugar, soybean, orange juice, coffee, beef, chicken etc. Brazil has a major competitive advantage on export of these products owing to country’s core competency in agriculture, and its dependency on agriculture for development of the country. The government backs the country in promoting food production with credit, research and extension programs8. Further the abundance of land, availability of a favourable climate, availability of cheap labour and the abundance of water, and fertile soil all contribute to greater volumes of production. Brazil also extensively makes use of new technology in agriculture to achieve increased productivity. Let’s analyze its position with respect to other countries in the production and export of some of these food produce. Brazil is 2nd in place in terms of soybean production and exports only to the U.S. The pie chart below illustrates the soybean production percentage of Brazil for 2008. Brazil leads in world sugar production and export. The pie charts below depicts Brazil is 1st in ranking when in comes to producing and exporting sugar in 2007/2008.
- 15. Brazil is ranked 1st in the production and export of orange juice. The graph below shows the comparison with its’ closest competitor U.S. Brazil is the 2nd largest producer of beef in the world, but ranks 1st in the export of beef. The graph below shows the comparison between four countries.
- 16. Brazil rank no. 1 in world’s coffee production and export. The graph below depicts the comparison of Brazil with its’ closest competitors. (2) Automobile industry The auto car industry in Brazil has attracted has attracted ten largest car manufacturers in the world. This is because of the conducive government policy that attracts many automobile manufacturers into the country. The availability of cheap labour is also another driver for the foreign automobile investors to expand into the Brazil’s auto industry. Another important factor is the huge population and the associated buying capacity of the people.
- 17. For the period 2004 to 2007 Brazil’s vehicle production has increased, and by 2007 Brazil has becomes the 07th largest vehicle manufacturer in the world. The main reason for foreign automobile giants to setup manufacturing plants in Brazil is that in 1990’s Brazilian government eliminated economic restrictions by opening up the economy. Production of cars in 2003 in Brazil stood at 1.72 million out of which 1.23 million is for domestic requirement. Brazilian auto industry follows the Order To Delivery (OTD) strategy to maximize customer satisfaction thereby increasing its competitive advantage. They also practice supply chain optimization strategies for achieving economies of scale. The domestic automobile market is Brazil is growing due to its’ economic stability, growing economy, and access to favourable credit. However, the outlook for exports in automobile industry is not promising because of the current economic crisis. The growth of the export of automobiles in Brazil from 2000 to 2007e is given by the following graph.
- 18. (3) Possession of a Strategic Satellite Launching Centre Brazil has in possession of a strategic Satellite launching centre named Alcantara Launch Centre (ALC) which is a unique launch pad for satellites. Its strategic location makes it attractive for mant countries around the world to launch satellites. Its strategic importance comes from its locality, i.e., being the closest launch centre to the equator. It is the best location among the other launch centres in the world. Due to its nearness to the equator the advantages gained are rapid orbit entry and fuel savings. Additionally, the climate at the site also is a plus point for its operation. The location can be accessed by both sea as well as air making it attractive for many countries to request the services of ALC for satellite launches. Because of its strategic location ALC has attracted many satellite launches from NASA, Russia, China etc. It is the only satellite launch pad in the Southern Hemisphere. Brazil plans to upgrade ALC into an International Rocket Launching Centre. The many successes that ALC has had in the past have made it possible to explore space research. Brazil hopes to launch its first satellite rocket in 2011.This will open up its possibilities to enter into “Orbital Tourism” thereby obtaining a competitive edge to earn more revenue to the country. (4) Innovation Brazil has been able to diversify from commodity-based and agricultural sectors to entrepreneurship and innovation, which has given Brazil to become competitive in an emerging economy. To illustrate, Brazil is going ahead with flex-fuel vehicles based on ethanol. Brazil produces more than 33% or world’s ethanol and this is a classis example of Brazil innovation and entrepreneurship. This effort can also be seen as an effort for use of renewable energy due to the scarcity and also the environmental impact of fossil based fuels. (5) Tourism Even though, not falling to the top ten mostly visited countries in the world Brazil attracts many tourists. In 2008 alone, Brazil attracts 5.2 million visitors. It is the sixth largest tourism industry in the
- 19. Americas. The reason for attraction of such amounts of tourists is that Brazil offers a lot of attractions to the tourists such as historic and cultural tourism, ecotourism and adventure travel. The competitive advantages for attracting tourism are attributed to natural, cultural, and human resources that Brazil possesses. Brazil can progress still better in its ranking by developing the information and communication technology infrastructure, land transport infrastructure, and security. (6) Industry Brazil has a extremely sophisticated technology industry, and is the second most industrialized nation in the Americas. Some of the most prominent industries in Brazil are petrochemicals, automobile, cement and construction, banking, electronics, food and beverages, mining, textiles, consumer durables, space research, submarine, and tourism. The reasons for the vast development of industry are that talented workforce, abundant resources, government backing, improved lending, innovation, and so forth. (7) Forestry Products Brazil has the third largest remaining forest frontier in the world. Brazilian Amazon forest provides the largest stock of forestry products. Brazil forests are rich with timber, gums, resins, waxes, cellulose, nuts, fibres, etc. Brazilian wood is of highest quality in the world which is its competitive advantage in the wood industry. Brazil exports value added products such as lumber, hardboard, plywood, etc. Annex: GDP 2007 USD Ranking Economy millions United 1 States 13,811,200 2 Japan 4,376,705
- 20. 3 Germany 3,297,233 4 China 3,280,053 United 5 Kingdom 2,727,806 6 France 2,562,288 7 Italy 2,107,481 8 Spain 1,429,226 9 Canada 1,326,376 10 Brazil 1,314,170 Russian 11 Federation 1,291,011 12 India 1,170,968 13 Korea, Rep 969,795 14 Mexico 893,364 15 Australia 821,716 http://siteresources.worldbank.org/DATASTATISTICS/Resources/GDP.pdf Soybean production in the world 2008 2007 2006 2004 Million Millio Million Million Million Million Million Milli n n Bushels Metric Bushels Metric Bushel Metric Bushel Metr Tons Tons s Tons s c Ton United States 2,677 72.9 2,585 70.4 3,188 86.8 3,141 85 Brazil 2,241 61 2,241 61 2,057 56 1,947 5 Argentina 1,697 46.2 1,727 47 1,617 44 1,433 3 China 514 14 525 14.3 595 16.2 661 1 India 342 9.3 342 9.3 268 7.3 220 Paraguay 250 6.8 257 7 173 4.7 140 3 Canada 99 2.7 99 2.7 129 3.5 Other 295 8 301 8.2 365 9.9 426 11 . . . . . . Total 8,115 220.9 8,077 219.8 8,391 228.4 7,968 216 http://www.soystats.com/ Soybean exports in the world 2008 2007 2006 2004 Million Millio Million Million Million Million Million Milli
- 21. n n Bushels Metric Bushels Metric Bushel Metric Bushel Metr Tons Tons s Tons s c Ton United States 1,161 31.6 1,025 27.9 1,100 29.9 1,100 29 Brazil 932 25.4 1,017 27.7 946 25.8 744 20 Argentina 508 13.8 423 11.5 270 7.4 278 7 Paraguay 187 5.1 169 4.6 121 3.3 77 2 Canada 65 1.8 54 1.5 Other 67 1.8 56 1.5 121 3.3 88 2 Total 2,920 79.5 2,743 74.7 2,558 69.6 2,287 62 http://www.soystats.com/ World Sugar Production and Exports 2007/2008 PRODUCTION EXPORTS POPULATION PER CAPITA MILLION MILLION CONSUMPTION TONS TONS MILLIONS KGS 20.957 BRAZIL 31.355 [1] 190 58 INDIA 28.804 3.298 [4] 1 117 20 EU 17.567 1.400 [8] 490 34 CHINA 14.674 - 1 314 11 THAILAND 8.033 5.288 [2] 65 36 UNITED STATES 7.701 - 301 29 0.350 MEXICO 5.978 [15] 107 52 SADC 5.834 2.410 [5] 157 22 AUSTRALIA 5.013 3.750 [3] 20 47 PAKISTAN 4.891 - 165 25 [#] = World export ranking http://www.illovosugar.com/worldofsugar/internationalSugarStats.htm World Orange Juice Production, Imports, Exports, Consumption Domestic Marketin Productio Total Ending Country Imports Exports Consumptio g Year n Supply Stocks n 2006/07 10,461 32,500 44,122 1,600 41,500 1,022 2007/08 11,538 30,000 42,560 1,750 40,000 810 Australia 2008/09 12,700 29,500 43,010 1,800 40,500 710
- 22. 2006/07 1,480,000 0 1,495,000 1,298,000 31,000 166,000 2007/08 1,165,000 0 1,331,000 1,230,000 34,000 67,000 Brazil 2008/09 1,240,000 0 1,307,000 1,220,000 34,000 53,000 2006/07 0 65,000 65,000 0 65,000 0 Canada 2007/08 0 62,000 62,000 0 62,000 0 2008/09 0 62,000 62,000 0 62,000 0 2006/07 11,000 56,991 75,991 3,302 62,689 10,000 China 2007/08 18,000 50,624 78,624 3,770 66,854 8,000 2008/09 14,000 43,000 65,000 3,000 62,000 0 2006/07 161,066 666,836 877,902 13,662 854,240 10,000 EU-27 2007/08 148,385 620,000 778,385 15,000 748,385 15,000 2008/09 136,324 600,000 751,324 15,000 721,324 15,000 2006/07 7,560 26,000 33,660 18,000 15,000 660 Israel 2007/08 3,600 28,500 32,760 17,000 15,500 260 2008/09 5,500 26,700 32,460 16,000 15,700 760 2006/07 0 89,741 106,741 0 89,741 17,000 Japan 2007/08 0 74,608 91,608 0 81,608 10,000 2008/09 0 74,000 84,000 0 79,000 5,000 2006/07 8,760 33,362 44,895 154 42,247 2,494 Korea 2007/08 11,103 28,053 41,650 489 38,847 2,314 2008/09 8,000 31,000 41,314 500 38,574 2,240 2006/07 70,000 1,200 72,200 64,700 6,500 1,000 Mexico 2007/08 90,000 1,000 92,000 84,500 6,500 1,000 2008/09 60,000 1,000 62,000 54,500 6,500 1,000 2006/07 600 1,064 1,664 0 1,664 0 Morocco 2007/08 600 1,700 2,300 0 2,300 0 2008/09 600 1,000 1,600 0 1,600 0 2006/07 0 64,000 64,000 0 64,000 0 Russian 2007/08 0 62,000 62,000 0 62,000 0 Federation 2008/09 0 62,000 62,000 0 62,000 0 2006/07 23,220 741 26,426 13,010 10,916 2,500 South Africa 2007/08 23,400 900 26,800 13,300 11,000 2,500 2008/09 18,000 900 21,400 11,000 9,100 1,300 2006/07 0 27,000 27,000 0 27,000 0 Switzerland 2007/08 0 29,000 29,000 0 29,000 0 2008/09 0 29,000 29,000 0 29,000 0 2006/07 9,100 6,400 16,800 1,650 13,950 1,200 Turkey 2007/08 8,700 7,000 16,900 1,380 14,420 1,100 2008/09 8,800 6,800 16,700 1,300 14,300 1,100 2006/07 633,767 283,808 1,244,061 87,257 886,804 270,000 United States 2007/08 830,819 295,131 1,395,950 108,430 830,820 456,700 2008/09 754,000 205,000 1,415,700 113,000 862,700 440,000
- 23. 2006/07 2,415,534 1,354,643 4,195,462 1,501,335 2,212,251 481,876 Total 2007/08 2,311,145 1,290,516 4,083,537 1,475,619 2,043,234 564,684 2008/09 2,257,924 1,171,900 3,994,508 1,436,100 2,038,298 520,110 http://www.fas.usda.gov/psdonline/psdReport.aspx?hidReportRetrievalName=Orange+Juice%3a+ +Production %2c+Supply+and+Distribution+in+Selected+Countries&hidReportRetrievalID=1599&hidReportRetrie valTemplateID=3 Productions and Export of Beef (in Metric Tons) 2005 2006 2007 2008 Country Production Exports Production Exports Production Exports Production Expor United States 11,318 316 11,980 519 12,096 7,643 12,163 856 Brazil 8,592 1,845 9,025 2,084 9,303 2,189 9,024 1,801 EU-27 8,090 1,388 8,150 1,430 8,188 1,400 8,100 1,407 China, Peoples Republic of 5,681 617 5,767 681 6,134 678 6,100 625 Argentina 3,200 596 3,100 477 3,300 457 3,150 494 India 2,250 577 2,375 530 2,413 496 2,470 533 Mexico 2,125 754 2,175 552 2,207 534 2,225 421 Australia 2,102 417 2,183 460 2,172 385 2,159 361 Canada 1,523 180 1,391 232 1,279 196 1,285 232 Russian Federation 1,525 253 1,430 218 1,370 140 1,315 201 Pakistan 1,005 13 1,057 31 1,089 114 1,121 206 Others 9,268 359 9,526 303 9,347 404 9,426 428 Total 56,679 7,315 58,159 7,517 58,898 650 58,538 7,565 http://www.fas.usda.gov/psdonline/psdReport.aspx? hidReportRetrievalName=Beef+and+Veal+Summary+Selected+Countries&hidReportRetrievalID=49& hidReportRetrievalTemplateID=7 Three leading coffee producers and exporters (thousand 60 kilogram bags) 2008/2009 2007/2008 2006/2007 Total Production Bean Exports Total Production Bean Exports Total Production Bean Exports Brazil 51100 24570 37600 23770 46700 26185 Colombia 12250 10600 12392 10874 12164 10507 Vietnam 19500 18500 18333 16000 19500 18,500 http://www.fas.usda.gov/psdonline/psdReport.aspx? hidReportRetrievalName=Table+07+World+Coffee+Supply+and+Distribution %2c+2006%2f07&hidReportRetrievalID=1570&hidReportRetrievalTemplateID=3
- 24. Total No. of vehicles produced Total No. of vehicles produced 2004 2005 2006 2007 Japan 10,511,518 10,799,659 11,484,233 11,596,327 USA 11,989,387 11,946,653 11,263,986 10,780,729 China 5,234,496 5,708,421 7,188,708 8,882,456 Germany 5,569,954 5,757,710 5,819,614 6,213,460 South Korea 3,469,464 3,699,350 3,840,102 4,086,308 France 3,665,990 3,549,008 3,169,219 3,015,854 Brazil 2,317,227 2,530,840 2,611,034 2,970,818 Spain 3,012,174 2,752,500 2,777,435 2,889,703 Canada 2,711,536 2,687,892 2,572,292 2,578,238 India 1,511,157 1,638,674 2,019,808 2,306,768 Mexico 1,577,159 1,684,238 2,045,518 2,095,245 UK 1,856,539 1,803,109 1,648,388 1,750,253 Russia 1,386,127 1,354,504 1,508,358 1,660,120 http://oica.net/category/production-statistics/ SOURCES: http://www.sep.org.br/artigo/1330_64b77dc07cd6341f7991090190bc034c.pdf? PHPSESSID=71396f885ac0f003c47acc7b7bc802fd http://ase.tufts.edu/gdae/Pubs/rp/DP10HiratukaApr08.pdf http://ideas.repec.org/h/bis/bisbpc/44-06.html