

Recommandé
Contenu connexe
Tendances
Tendances (20)
En vedette
En vedette (8)
Similaire à Research Report-SRF
Similaire à Research Report-SRF (20)
Dernier
Dernier (20)
Research Report-SRF
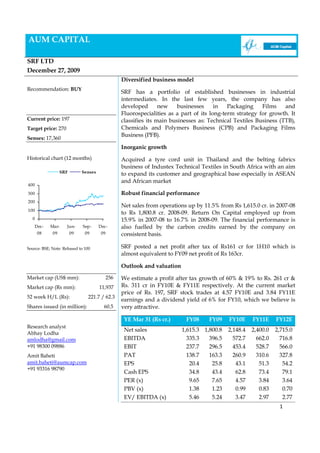
- 1. AUM CAPITAL SRF LTD December 27, 2009 Diversified business model Recommendation: BUY SRF has a portfolio of established businesses in industrial intermediates. In the last few years, the company has also developed new businesses in Packaging Films and Fluorospecialities as a part of its long-term strategy for growth. It Current price: 197 classifies its main businesses as: Technical Textiles Business (TTB), Target price: 270 Chemicals and Polymers Business (CPB) and Packaging Films Business (PFB). Sensex: 17,360 Inorganic growth Historical chart (12 months) Acquired a tyre cord unit in Thailand and the belting fabrics business of Industex Technical Textiles in South Africa with an aim SRF Sensex to expand its customer and geographical base especially in ASEAN and African market 400 300 Robust financial performance 200 Net sales from operations up by 11.5% from Rs 1,615.0 cr. in 2007-08 100 to Rs 1,800.8 cr. 2008-09. Return On Capital employed up from 0 15.9% in 2007-08 to 16.7% in 2008-09. The financial performance is Dec- Mar- Jun- Sep- Dec- also fuelled by the carbon credits earned by the company on 08 09 09 09 09 consistent basis. Source: BSE; Note: Rebased to 100 SRF posted a net profit after tax of Rs161 cr for 1H10 which is almost equivalent to FY09 net profit of Rs 163cr. Outlook and valuation Market cap (US$ mm): 256 We estimate a profit after tax growth of 60% & 19% to Rs. 261 cr & Market cap (Rs mm): 11,937 Rs. 311 cr in FY10E & FY11E respectively. At the current market price of Rs. 197, SRF stock trades at 4.57 FY10E and 3.84 FY11E 52 week H/L (Rs): 221.7 / 62.3 earnings and a dividend yield of 6% for FY10, which we believe is Shares issued (in million): 60.5 very attractive. YE Mar 31 (Rs cr.) FY08 FY09 FY10E FY11E FY12E Research analyst Net sales 1,615.3 1,800.8 2,148.4 2,400.0 2,715.0 Abhay Lodha amlodha@gmail.com EBITDA 335.3 396.5 572.7 662.0 716.8 +91 98300 09886 EBIT 237.7 296.5 453.4 528.7 566.0 Amit Baheti PAT 138.7 163.3 260.9 310.6 327.8 amit.baheti@aumcap.com EPS 20.4 25.8 43.1 51.3 54.2 +91 93316 98790 Cash EPS 34.8 43.4 62.8 73.4 79.1 PER (x) 9.65 7.65 4.57 3.84 3.64 PBV (x) 1.38 1.23 0.99 0.83 0.70 EV/ EBITDA (x) 5.46 5.24 3.47 2.97 2.77 1
- 2. Company overview Established in 1973, SRF has grown into a global entity with operations in 4 countries. Business segment comprise of Technical SRF is world’s 2nd largest Textiles, Chemicals and Polymers and Packaging Films Business. producer of Nylon 6 tyre cord The company enjoys a significant presence among the key domestic fabrics and belring fabrics manufacturers of Polyester Films and Fluoro specialities. Building on its in-house R&D facilities for Technical Textiles Business and Chemicals Business, the company strives to stay ahead in business through innovations in operations and product development. SNAPSHOT • Rs. 2,000 cr. multi-product, multi-business organisation • Market leader in Technical Textiles, Refrigerants, Engineering Plastics and Industrial Yarns • 8 locations in India, one in Dubai, one in South Africa and one in Thailand • World’s 2nd largest producer of Nylon 6 tyre cord fabrics • World’s 2nd largest producer of belting fabrics • Exporting to over 60 countries Management SRF has created a strong management team – both at the board level Shareholding and at the operating level. The management team has a large experience in economic and financial analysis, asset management, structured products, policy making and infrastructure lending. Ownership Non institution 35.9 Arun Bharat Ram and associated companies are the largest Promoters 47.3 shareholding of more than 47%. However, the shareholding is widely dispersed with institutions holding about 17% stake. Buyback of shares Institutio n 16.8 • SRF completed buyback of 73,81,425 shares for a total amount of Rs 67.9 cr. in June 2008 to June 2009 Source: NSE website • SRF Board approved another share buyback for price not exceeding Rs 165 per share with a total cap of Rs 65 cr
- 3. Investment themes 1. Diversified business model : SRF Ltd operates in 3 business segments Tyre cord fabrics are used as Technical Textiles Business (TTB) reinforcement material for all categories of tyres – from Technical Textiles Business, which includes Tyre Cord Fabrics, bicycles to heavy commercial Belting Fabrics and Coated Fabrics, continues to be SRF’s largest vehicles business segment. TTB market segment is poised to grow at an average growth of 5-6% for FY10 and FY11 compared to a 9-10% expected growth in tyre business segment over the same period. Though the revenues declined marginally in 2009 compared to 2008 due to global slowdown, it contributes 50% (apprx) of the total revenues. The increase in anti dumping duty on nylon tyre cord fabric from China will help SRF both on volume and pricing front. Chemicals and Polymers Business (CPB) Derives its revenue from the sale of fluorine-based Refrigerants, Chloromethanes, the fast-growing speciality chemicals business space and Engineering Plastics. It also includes receipts from the sale of CERs generated by destruction of the greenhouse gas, Hydrofluorocarbon-23 (HFC-23) under the mechanism defined by the Kyoto Protocol. Growth in the Engineering Plastics will continue to be driven by automobile and electrical sector. Packaging Films Business (PFB) Packaging Film Business are SRF’s is focused on timely project implementation and complete used in packaging of food, booking of its capacities. Overall, the long-term prospects of this cosmetics, personal and health business are encouraging. With domestic demand for Packaging care products Films Business expected to grow at 11-12% and overseas business of 5-6% over FY10 and FY11, SRF will continue to explore various organic and inorganic opportunities. SRF – Strategic project expansion of Rs 600 cr • Commissioned wind energy project of 15MW in Tamil Nadu for Rs 90cr • Setting up a Polyster Industrial yarn Plant in Tamil Nadu for Rs 250 cr • Plans to set up 27,000 MT manufacture of PET films under Pakaging Films Business for Rs 165 cr • Intends to invest Rs 100 cr for its chemical business especially in the area of upgrading its R&D facilities 3
- 4. 3. Inorganic growth 1. Tyre cord unit in Thailand Thai Baroda Industries has a In line with SRF’s long-term strategy of consolidation in this production capacity of around business segment, the Company acquired a tyre cord unit in 12,000 TPA Thailand with an aim to expand its customer and geographical base. This facility has provided SRF a presence in the coveted automobile manufacturing hub in South East Asia region. When leveraged, this would enable growth in tyre cord business with associated benefits in other segments of Technical Textiles. The acquisition not only positions SRF as a leader in the ASEAN region, but also makes it the second largest Nylon 6 Tyre Cord producer and fifth largest textile Tyre Cord producer in the world. SRF Technical Textiles has earned a profit of Thai Baht 3,802 mm (Rs546 cr) for the period from 8th Sep 2008 to March 2009 2. Beltic Fabric Business in South Africa Industex Technical Textile is Acquisition of a belting fabric manufacturing unit in South Africa uniquely positioned to capture located in Port Elizabeth has not only strengthened its position in the conveyor belts business in the mining hub of South Africa, but is also positioned to expand its the mining industry of Africa customer base with entry into new geographical markets such as South America. With this acquisition, SRF has become the 2nd largest belting fabric producer in the world. With a capacity of only 7,500 TPA of belting fabrics, SRF enjoys market leadership with a 50% market share and its exports contribute to 57% of sales 3. Engineering Plastics Business / Industrial Yarn Business SRF acquired Engineering Plastic Business and Industrial yarn Business from SRF Polymers at Rs 151.6 cr. With this business acquisition, SRF’s turnover will rise above Rs 2,000 cr and will enable further consolidation through synergies between businesses SRF dividend history SRF has a long dividend SRF with an excellent track record of rewarding its shareholders payment history with dividend has recommended an interim dividend of 70% for March 2010. March 2006 – 30% March 2007 – 60% March 2008 – 50% March 2009 – 100% 4
- 5. Income statement YE March 31 (Rs cr) FY08 FY09 FY10E FY11E FY12E Net sales 1,615 1,801 2,148 2,400 2,715 Other income 20 18 22 24 28 Total income 1,635 1,819 2,170 2,424 2,743 Operating expense 1,300 1,423 1,597 1,762 2,026 EBITDA 335 396 573 662 717 Depreciation 98 100 119 133 151 EBIT 238 296 453 529 566 Interest charges 36 51 60 61 72 PBT 202 246 393 468 494 Tax 64 83 132 157 166 PAT 139 163 261 311 328 Source: Company and AUM Capital research estimates Balance sheet YE March 31 (Rs cr) FY08 FY09 FY10E FY11E FY12E Share capital 69 62 62 62 62 Reserves & surplus 903 915 1,144 1,384 1,641 Shareholders fund 972 976 1,205 1,445 1,702 Total debt 499 885 749 898 1,057 Other liabilities 148 173 173 173 173 Total liabilities 1,619 2,035 2,127 2,516 2,933 Net fixed assets 1,236 1,660 1,777 1,950 2,182 Investments 148 134 134 134 134 Current assets 563 572 617 855 1,084 - Cash 7 3 (46) 124 267 - other assets 555 569 663 732 817 Current liabilities 327 332 401 423 467 Net current assets 235 241 216 433 617 Total Assets 1,619 2,035 2,127 2,516 2,933 Source: Company and AUM Capital research estimates 5
- 6. Financial snapshot YE March (Rs cr.) 2QFY10 2QFY09 Q-o-Q 1QFY10 1HFY10 growth (%) Income from operations 527 509 3% 498 1,025 Other income 1 3 NM 2 4 Total income 528 512 3% 500 1,028 Operating expenses 375 364 3% 342 717 EBITDA 153 149 3% 158 311 Depreciation 32 23 37% 29 61 EBIT 121 125 NM 129 251 Interest and finance 16 10 57% 14 30 charges PBT 103 87 18% 138 241 PAT 69 59 16% 93 161 Source: Company and AUM Capital research estimates Key ratios YE March 31 FY08 FY09 FY10E FY11E FY12E EPS (Rs) 20.44 25.78 43.13 51.34 54.18 Growth (%) (52.0%) 26.1% 67.3% 19.0% 5.5% DPS (Rs) 5 10 12 10 10 EBITDA margin 20.8% 22.0% 26.7% 27.6% 26.4% EBIT margin 14.7% 16.5% 21.1% 22.0% 20.8% Debt / Equity (x) 0.51 0.91 0.62 0.62 0.62 PER (x) 9.65 7.65 4.57 3.84 3.64 PBV (x) 1.38 1.23 0.99 0.83 0.70 EV/ EBITDA (x) 5.46 5.24 3.47 2.97 2.77 Source: Company and AUM Capital research estimates 6
- 7. Disclaimer: - This report provides information and opinions as reference resource only. This report is not intended to be and does not constitute financial advice, investment advice, trading advice or any other advice. It is not to be construed as a solicitation or an offer to buy or sell any securities or related financial products. The information and commentaries are also not meant to be endorsements or offerings of any securities, options, stocks or other investment vehicles. The report has been prepared without regard to the individual financial circumstances, needs or objectives of persons who receive it. The securities discussed in this report may not be suitable for all investors. Readers should not rely on any of the information herein as authoritative or substitute for the exercise of their own skill and judgment in making any investment or other decision. Readers should independently evaluate particular investments and strategies, and are encouraged to seek the advice of a financial adviser before making any investment or entering into any transaction in relation to the securities mentioned in this report. The appropriateness of any particular investment or strategy whether opined on or referred to in this report or otherwise will depend on an investor’s individual circumstances and objectives and should be confirmed by such investor with his advisers independently before adoption or implementation (either as is or varied). You agree that any and all use of this report which you make, is solely at your own risk and without any recourse whatsoever to KER, its related and affiliate companies and/or their employees. You understand that you are using this report AT YOUR OWN RISK. This report is being disseminated to or allowed access by Authorised Persons in their respective jurisdictions by AUM Capital Private Limited and its affiliates. AUM Capital Private Limited hereafter referred to as AUM, are a full-service, integrated investment banking, investment management, brokerage and financing group. AUM, its related and affiliate companies and/or their employees may have investments in securities or derivatives of securities of companies mentioned in this report, and may trade them in ways different from those discussed in this report. AUM and its related and affiliated companies are involved in many businesses that may relate to companies mentioned in this report. These businesses include market making and specialized trading, fund management, investment services and corporate finance. Except with respect the disclosures of interest made above, this report is based on public information. AUM makes reasonable effort to use reliable, comprehensive information, but we make no representation that it is accurate or complete. The reader should also note that unless otherwise stated, none of AUM or any third-party data providers make ANY warranties or representations of any kind relating to the accuracy, completeness, or timeliness of the data they provide and shall not have liability for any damages of any kind relating to such data. Proprietary Rights to Content. The reader acknowledges and agrees that this report contains information, photographs, graphics, text, images, logos, icons, typefaces, and/or other material (collectively “Content”) protected by copyright, trademarks, or other proprietary rights, and that these rights are valid and protected in all forms, media, and technologies existing now or hereinafter developed. The compilation (meaning the collection, arrangement, and assembly) of all content on this report is the exclusive property of AUM. The reader may not copy, modify, remove, delete, augment, add to, publish, transmit, participate in the transfer, license or sale of, create derivative works from, or in any way exploit any of the Content, in whole or in part, except as specifically permitted herein. If no specific restrictions are stated, the reader may make one copy of select portions of the Content, provided that the copy is made only for personal, information, and non-commercial use and that the reader does not alter or modify the Content in any way, and maintain any notices contained in the Content, such as all copyright notices, trademark legends, or other proprietary rights notices. Except as provided in the preceding sentence or as permitted by the fair dealing privilege under copyright laws, the reader may not reproduce, or distribute in any way any Content without obtaining permission of the owner of the copyright, trademark or other proprietary right. AUM CAPITAL INDIA (P) LTD Registered office: 5, Lower Rawdon Street, Akashdeep, 1st floor, Kolkata 700020, India. Tel: 91-33-2486 1040, Fax: 91-33-2476 0191 7