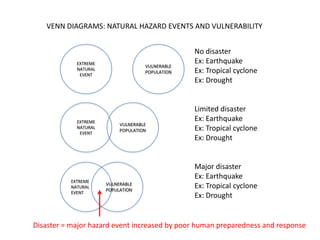
The document presents a Venn diagram showing the relationship between extreme natural events, vulnerable populations, and the level of disaster. It shows that:
1) An extreme natural event with no vulnerable population results in no disaster.
2) An extreme event combined with a vulnerable population may result in a limited disaster.
3) The combination of an extreme event and a highly vulnerable population leads to a major disaster.
It defines disaster as a major hazardous event exacerbated by poor human preparedness and response.
1. VENN DIAGRAMS: NATURAL HAZARD EVENTS AND VULNERABILITY
No disaster
EXTREME Ex: Earthquake
VULNERABLE
NATURAL
EVENT
POPULATION Ex: Tropical cyclone
Ex: Drought
Limited disaster
EXTREME Ex: Earthquake
VULNERABLE
NATURAL
EVENT
POPULATION Ex: Tropical cyclone
Ex: Drought
Major disaster
Ex: Earthquake
EXTREME
VULNERABLE
NATURAL
POPULATION
Ex: Tropical cyclone
EVENT
Ex: Drought
Disaster = major hazard event increased by poor human preparedness and response
2. VULNERABILITY
1. Suggest factors which may explain why people live in hazardous areas
• Earthquakes: San Francisco Bay
• Tropical Cyclones: Irrawady or Mississippi Delta
• Droughts: Sahel
• Flooding: Delta of the Ganges
• Volcanoes: Bali
2. Referring to named examples, explain how the following factors impact the vulnerability of
a population to a hazardous event:
• Population density
• Understanding/knowledge of the area
• Public education/awareness
• Existence of an early warning system
• Effective lines of communication
• Availability and preparedness of emergency responders
• Insurance coverage
• Building codes
• Efficiency/coordination of local/regional/national authorities
• Cultural factors
3. Referring to named examples, explain why certain social groups of a population may be
more vulnerable than others
3. VULNERABILITY: COSTA RICA
See also Haiti, p.215 Droughts
Natural hazards in Costa Rica: Volcanoes
• Volcanoes (central mountain range)
• Earthquakes (West coast) Flooding
• Tropical cyclones (both coasts) Earthquakes
• Droughts (North West)
Hurricanes
• Floods (Caribbean floodplain)
Economic Social vulnerability Educational Environmental
vulnerability vulnerability vulnerability
Poverty: High hazard acceptance (survey): • Few emergency preparedness • Deforestation + Poor land
• 46% of pop makes less than local • 27% believe hazards are “natural” programs in schools, and usually management = increase risk of
minimum wage • 11% believe hazards are “wrath of relate to seismic/volcanic activity flooding, landslides
• 28% live in poverty God” rather than flooding • Urbanization of slopes and
Poor urban planning • 24% do not know the cause of • Hazard zoning are ignored and hilltops = increased runoff and
• 63% of homes in Limon are not hazards high-risk areas are populated with vulnerability of low-lying
elevated • Most people believe that risk help of government! populations (often poor)
• 99% of homes are not anti- reduction is beyond their control • Warning systems are general
seismic (radio/TV), not targeted to
• Many public buildings also lack specific communities
preparedness
Three main needs for change in Costa Rica
1. Improve government organization: less centralization, more focus on local scale
2. Shift priorities: hazards should not be viewed as “inevitable” and “unpredictable” and “uncontrollable”
3. Increase local participation: all-inclusive disaster preparedness programs tailored to local needs,
environmental management
A recent string of hurricanes in Central America since 1997 has led to improved collective awareness for disaster
prevention and strategic planning
4. VULNERABILITY: NEW ORLEANS (p.214)
• Median household income in Lower Ninth Ward:
$32k ($10k less than national average)
• 20% of households had no car (10% nationwide)
• 25% of people in flooded areas below poverty
level (twice national average)
• 60% of people affected came from minorities
(30% national average)
• Levees not designed to withstand 6m+ surge
• Pumping stations not designed to handle
massive flood
• No mandatory evacuation until 24hrs earlier, no
buses/alternate lodging provided for people
with no cars
• Poor communication between city/state/federal
authorities
• Poor organization of relief efforts
(Superdome, looting)