SlideShare une entreprise Scribd logo
1  sur  25
Télécharger pour lire hors ligne
INTERIM REPORT                                        1(25)


Nokia Corporation                                                               October 15, 2009 at 13:00 (CET +1)

Nokia Q3 2009 net sales EUR 9.8 billion, non-IFRS EPS EUR 0.17 (reported EPS EUR -0.15)
Nokia Siemens Networks non-cash asset impairments negatively impacted reported EPS by EUR 0.29


                                                   Non-IFRS third quarter 2009 results1, 2, 3
                                                                     YoY                       QoQ
 EUR million                           Q3/2009       Q3/2008       Change     Q2/2009         Change
 Net sales                                9 810        12 239       -19.8%        9 913         -1.0%
  Devices & Services                      6 915          8 605      -19.6%        6 586          5.0%
  NAVTEQ                                    166            157        5.7%          148         12.2%
  Nokia Siemens Networks                  2 760          3 504      -21.2%        3 199        -13.7%

 Operating profit                            741         1 756       -57.8%             775        -4.4%
  Devices & Services                         787         1 602       -50.9%             802        -1.9%
  NAVTEQ                                      43            29        48.3%              19       126.3%
  Nokia Siemens Networks                     -53           177                            2

 Operating margin                          7.6%         14.3%                         7.8%
  Devices & Services                      11.4%         18.6%                        12.2%
  NAVTEQ                                  25.9%         18.5%                        12.8%
  Nokia Siemens Networks                  -1.9%          5.1%                         0.1%

 EPS, EUR Diluted                           0.17          0.33       -48.5%            0.15        13.3%

                                                   Reported third quarter 2009 results1, 3
                                                                    YoY                          QoQ
 EUR million                           Q3/2009       Q3/2008      Change     Q2/2009            Change
 Net sales                                9 810        12 237      -19.8%        9 912            -1.0%
  Devices & Services                      6 915         8 605      -19.6%        6 586             5.0%
  NAVTEQ                                    166           156        6.4%          147            12.9%
  Nokia Siemens Networks                  2 760         3 503      -21.2%        3 199           -13.7%

 Operating profit                           -426         1 469                          427
  Devices & Services                         785         1 602       -51.0%             763         2.9%
  NAVTEQ                                     -68           -80                         -100
  Nokia Siemens Networks                  -1 107            -1                         -188

 Operating margin                         -4.3%         12.0%                         4.3%
  Devices & Services                      11.4%         18.6%                        11.6%
  NAVTEQ                                 -41.0%        -51.3%                       -68.0%
  Nokia Siemens Networks                 -40.1%          0.0%                        -5.9%

 EPS, EUR Diluted                          -0.15          0.29                         0.10
Note 1 relating to NAVTEQ: Nokia completed the acquisition of NAVTEQ Corporation on July 10, 2008. Accordingly, NAVTEQ's results for the third quarter
2008 are not directly comparable to those for the third quarter 2009.

Note 2 relating to non-IFRS results: Non-IFRS results exclude special items for all periods. In addition, non-IFRS results exclude intangible asset
amortization, other purchase price accounting related items and inventory value adjustments arising from i) the formation of Nokia Siemens Networks
and ii) all business acquisitions completed after June 30, 2008. More specific information about the exclusions from the non-IFRS results may be found
in this press release on pages 3, 14-16 and 18.

Nokia believes that these non-IFRS financial measures provide meaningful supplemental information to both management and investors regarding
Nokia’s performance by excluding the above-described items that may not be indicative of Nokia’s business operating results. These non-IFRS financial
measures should not be viewed in isolation or as substitutes to the equivalent IFRS measure(s), but should be used in conjunction with the most
directly comparable IFRS measure(s) in the reported results. A reconciliation of the non-IFRS results to our reported results for Q3 2009 and Q3 2008
can be found in the tables on pages 11 and 14-18 of this press release. A reconciliation of our Q2 2009 non-IFRS results can be found on pages 10 and
13-17 of our Q2 2009 Interim Report of July 16, 2009.

Note 3: Nokia reported net sales were EUR 28 996 million and earnings per share (diluted) were EUR -0.02 for the period from January 1 to September
30, 2009. Further information about the results for the period from January 1 to September 30, 2009 can be found in this press release on pages 10,
12, 19-20 and 22.
INTERIM REPORT                         2(25)


Nokia Corporation                                        October 15, 2009 at 13:00 (CET +1)

THIRD QUARTER 2009 HIGHLIGHTS
- Nokia net sales of EUR 9.8 billion, down 20% year on year and down 1% sequentially (down 19% and flat at
   constant currency).
- Devices & Services net sales of EUR 6.9 billion, down 20% year on year and up 5% sequentially (down 20% and
   up 6% at constant currency), and non-IFRS operating margin of 11.4% (18.6% in Q3 2008 and 12.2% in Q2
   2009).
- Devices & Services gross margin of 30.9%, down from 34.0% in Q2 2009.
- Services net sales of EUR 148 million (billings of EUR 172 million). Due to the divestment of the security
   appliance business in April 2009, services net sales are not directly comparable to prior periods.
- Estimated industry mobile device volumes of 288 million units, down 7% year on year and up 7% sequentially.
- Nokia mobile device volumes of 108.5 million units, down 8% year on year and up 5% sequentially.
- Nokia estimated mobile device market share of 38% in Q3 2009, at the same level as in Q3 2008 and in Q2
   2009.
- Nokia mobile device ASP of EUR 62, at the same level as in Q2 2009.
- NAVTEQ non-IFRS net sales of EUR 166 million, up 6% year on year and up 12% sequentially, and non-IFRS
   operating margin of 25.9% (18.5% in Q3 2008).
- Nokia Siemens Networks net sales of EUR 2.8 billion, down 21% year on year and down 14% sequentially
   (down 20% and down 14% at constant currency), and non-IFRS operating margin of -1.9% (5.1% in Q3 2008).
- Nokia operating cash flow of EUR 720 million.
- Total cash and other liquid assets of EUR 7.4 billion at the end of Q3 2009.
- Nokia taxes were favorably impacted by country profit mix as well as prior year tax benefits. If Nokia’s
    estimated long-term tax rate of 26% had been applied, non-IFRS EPS would have been approximately 2 Euro
    cents lower.

OLLI-PEKKA KALLASVUO, NOKIA CEO:
“The demand for mobile devices improved in many markets during Q3. With the average selling price of our
devices holding firm quarter-on-quarter, our higher device volumes translated into increased net sales in our
Devices & Services business. Our volumes and net sales were, however, somewhat constrained by component
shortages we encountered across the portfolio. I also want to highlight the good operating expense management
that helped the segment deliver solid earnings.

The challenging competitive factors and market conditions in the infrastructure and related services business
necessitated non-cash impairment charges at Nokia Siemens Networks. We continue to support Nokia Siemens
Networks actions to improve its performance.”

INDUSTRY AND NOKIA OUTLOOK
- Nokia expects industry mobile device volumes in the fourth quarter 2009 to be up sequentially.
- Nokia expects its mobile device market share in the fourth quarter 2009 to be approximately at the same level
   sequentially.
- Nokia expects industry mobile device volumes to be approximately 1.12 billion units in 2009, down
   approximately 7% from approximately 1.21 billion units Nokia estimated for 2008. This is an update to Nokia’s
   earlier estimate of industry mobile device volumes declining approximately 10% in 2009 from 2008 levels.
- Nokia expects its non-IFRS operating margin in Devices & Services in the fourth quarter 2009 to be up by one
   percentage point or more sequentially.
– Nokia and Nokia Siemens Networks now expect the mobile infrastructure and fixed infrastructure and related
   services market to decline approximately 5% in Euro terms in 2009, from 2008 levels. This is an update to
   Nokia and Nokia Siemens Networks earlier expected decline of approximately 10%.
– Nokia and Nokia Siemens Networks also now expect that Nokia Siemens Networks market share will decline by
   more than previously expected in 2009, compared with 2008. This is an update to Nokia and Nokia Siemens
   Networks earlier expected moderate decline. Nokia and Nokia Siemens Networks continue to see strong
   performance in its Services business unit expected to be offset by declines in certain product businesses.
INTERIM REPORT                           3(25)


Nokia Corporation                                         October 15, 2009 at 13:00 (CET +1)


THIRD QUARTER 2009 FINANCIAL HIGHLIGHTS
(Comparisons are given to the third quarter 2008, unless otherwise indicated.)

The non-IFRS results exclusions
Q3 2009 — EUR 1 167 million consisting of:
– EUR 908 million impairment of goodwill in Nokia Siemens Networks
– EUR 29 million restructuring charge and other one-time items in Nokia Siemens Networks
– EUR 117 million of intangible assets amortization and other purchase price related items arising from the
   formation of Nokia Siemens Networks
– EUR 111 million of intangible assets amortization and other purchase price related items arising from the
   acquisition of NAVTEQ
– EUR 2 million of intangible assets amortization and other purchase price related items arising from the
   acquisition of OZ Communications in Devices & Services

Q3 2009 taxes — EUR 432 million valuation allowance for Nokia Siemens Networks deferred tax assets impacting
Nokia taxes

Q2 2009 — EUR 348 million (net) consisting of:
– EUR 22 million of impairment of intangible assets in Devices & Services
– EUR 83 million restructuring charge in Devices & Services
– EUR 68 million gain on sale of security appliance business in Devices & Services
– EUR 69 million restructuring charge and other one-time items in Nokia Siemens Networks
– EUR 121 million of intangible assets amortization and other purchase price related items arising from the
   formation of Nokia Siemens Networks
– EUR 119 million of intangible assets amortization and other purchase price related items arising from the
   acquisition of NAVTEQ
– EUR 2 million of intangible assets amortization and other purchase price related items arising from the
   acquisition of OZ Communications in Devices & Services

Q3 2008 — EUR 287 million consisting of:
- EUR 59 million restructuring charge and other one-time items in Nokia Siemens Networks
- EUR 119 million of intangible asset amortization and other purchase price accounting related items
   arising from the formation of Nokia Siemens Networks
- EUR 109 million of intangible asset amortization and other purchase price accounting related items arising
   from the acquisition of NAVTEQ

Non-IFRS results exclude special items for all periods. In addition, non-IFRS results exclude intangible asset
amortization, other purchase price accounting related items and inventory value adjustments arising from i) the
formation of Nokia Siemens Networks and ii) all business acquisitions completed after June 30, 2008.

Nokia Group
Nokia's third quarter 2009 net sales decreased 20% to EUR 9.8 billion, compared with EUR 12.2 billion in the third
quarter 2008. At constant currency, Group net sales would have decreased 19% year on year.

The following chart sets out the year on year and sequential growth rates in our net sales on a reported basis
and at constant currency for the periods indicated.
INTERIM REPORT                                         4(25)


Nokia Corporation                                                              October 15, 2009 at 13:00 (CET +1)

 NOKIA THIRD QUARTER 2009 NET SALES, REPORTED & CONSTANT CURRENCY1
                                                                                              Q3/2009 vs.            Q3/2009 vs.
                                                                                               Q3/2008                Q2/2009
                                                                                                Change                 Change
 Group net sales – reported                                                                      -20%                   -1%
 Group net sales - constant currency1                                                            -19%                    0%

 Devices & Services net sales – reported                                                         -20%                     5%
 Devices & Services net sales - constant currency1                                               -20%                     6%

 Nokia Siemens Networks net sales – reported                                                     -21%                    -14%
 Nokia Siemens Networks net sales - constant currency1                                           -20%                    -14%
Note 1: Change in net sales at constant currency excludes the impact of changes in exchange rates in comparison to the Euro, our reporting currency.

Nokia’s third quarter 2009 reported operating loss was EUR 426 million, compared with an operating profit of
EUR 1.5 billion in the third quarter 2008. Nokia’s third quarter 2009 non-IFRS operating profit decreased 58%
to EUR 741 million, compared with EUR 1.8 billion in the third quarter 2008. Nokia’s third quarter 2009
reported operating margin was -4.3% (12.0%). Nokia’s third quarter 2009 non-IFRS operating margin was
7.6% (14.3%).

Operating cash flow for the third quarter 2009 was EUR 720 million, compared with EUR 1.3 billion in the third
quarter 2008. Total cash and other liquid assets were EUR 7.4 billion at September 30, 2009, compared with EUR
7.2 billion at September 30, 2008. At September 30, 2009, Nokia’s net debt-equity ratio (gearing) was –15%,
compared with -18% at September 30, 2008.

Devices & Services
In the third quarter 2009, the total mobile device volumes of our Devices & Services group were 108.5 million
units, representing a decline of 8% year on year and a 5% increase sequentially. The overall industry mobile device
volumes for the same period were 288 million units based on Nokia’s preliminary estimate, representing a 7% year
on year decrease and a 7% sequential increase. The lower device volumes year on year for Nokia and the industry
continued to be driven by the negative impact of the deteriorated global economic conditions. The sequential
industry device volume increase primarily reflected an improved demand environment for mobile devices. In
addition, Nokia’s device volumes for the third quarter 2009 were somewhat constrained by component shortages
across the portfolio, which are expected to continue to some degree in the fourth quarter 2009.

Of the total industry mobile device volumes, converged mobile device industry volumes in the third quarter 2009
were 47.0 million units, based on Nokia’s preliminary estimate, compared with an estimated 44.2 million units in
the third quarter 2008 and 41.0 million units in the second quarter 2009. Our own converged mobile device
volumes were 16.4 million units in the third quarter 2009, compared with 15.5 million units in the third quarter
2008 and 16.9 million units in the second quarter 2009. Nokia’s share of the converged mobile device market was
an estimated 35% in the third quarter 2009, at the same level as in the third quarter 2008 and down from 41% in
the second quarter 2009. We shipped 4.5 million Nokia Nseries and 4.4 million Nokia Eseries devices during the
third quarter 2009, down from the combined 9.3 million Nseries and Eseries devices we shipped in the second
quarter 2009.

The following chart sets out our mobile device volumes for the periods indicated, as well as the year on year and
sequential growth rates, by geographic area.
INTERIM REPORT                           5(25)


Nokia Corporation                                             October 15, 2009 at 13:00 (CET +1)


NOKIA MOBILE DEVICE VOLUME BY GEOGRAPHIC AREA
(million units)                                    Q3/2009        Q3/2008    YoY Change     Q2/2009    QoQ Change
Europe                                                 27.1           27.4         -1.1%        23.3         16.3%
Middle East & Africa                                   19.6           21.5         -8.8%        18.9          3.7%
Greater China                                          18.5           19.8         -6.6%        18.6         -0.5%
Asia-Pacific                                           30.5           33.6         -9.2%        30.3          0.7%
North America                                           3.1            4.5        -31.1%         3.2         -3.1%
Latin America                                           9.7           11.0        -11.8%         8.9          9.0%
Total                                                108.5          117.8          -7.9%      103.2           5.1%

Based on our preliminary market estimate, Nokia’s mobile device market share for the third quarter 2009 was
38%, compared with 38% in the third quarter 2008 and in the second quarter 2009. Our year on year market
share was higher in Europe, Latin America and Middle East & Africa. This was offset by lower market share in
Greater China, Asia-Pacific and North America. Sequentially, our market share declined in Greater China, Asia-
Pacific, Middle East & Africa and North America, but was offset by our increased market share in Europe and
Latin America.

Our mobile device average selling price (ASP) in the third quarter 2009 was EUR 62, down from EUR 72 in the
third quarter 2008 and at the same level as in the second quarter 2009. The year on year decline was primarily
due to a higher proportion of sales of lower priced products as well as general price pressure. Sequentially, our
ASP benefited from new product shipments, offset however by general price pressure.

Third quarter 2009 Devices & Services net sales declined 20% to EUR 6.9 billion, compared with EUR 8.6 billion
in the third quarter 2008. Devices & Services net sales were down year on year in all geographic areas. At
constant currency, Devices & Services net sales would have decreased 20%. The net sales decline resulted
primarily from lower volumes, combined with the ASP decline, compared with the third quarter 2008. Of our
total Devices & Services net sales, services contributed EUR 148 million in the third quarter 2009, representing
29% year on year growth and a 6% sequential growth. Nokia completed the divestment of its security
appliances business in April 2009 and accordingly services net sales for the third and second quarter 2009 as
well as for the prior periods are not directly comparable.

Beginning with the third quarter 2009, we are providing additional sequential comparative information for
our Devices & Services business to reflect our product and solutions mode of operation and performance. We
are now providing total net sales for Devices & Services divided into (i) net sales from smartphones and
mobile computer solutions; that is, net sales of converged mobile devices, including the services and
accessories sold with them, and (ii) net sales from mobile phones and embedded services; that is, net sales of
Series 30 and Series 40-powered devices, including the services and accessories sold with them. We are also
providing ASPs for each of these two categories of sales. Net sales from smartphones and mobile computer
solutions totaled EUR 3.1 billion in the third quarter 2009, at the same level as in the second quarter 2009.
The ASP for smartphones and mobile computer solutions was EUR 190, up from EUR 182 in the second quarter
2009. Net sales from mobile phones and embedded services totaled EUR 3.8 billion in the third quarter 2009,
compared with EUR 3.5 billion in the second quarter 2009. The ASP for mobile phones and embedded services
was EUR 41, at the same level as in the second quarter 2009.

Devices & Services reported gross profit and non-IFRS gross profit decreased 32% to EUR 2.1 billion, compared
with EUR 3.1 billion in the third quarter 2008, with a reported and non-IFRS gross margin of 30.9% (36.5%).
The year on year gross margin decrease was primarily due to higher cost of sales driven by a stronger
Japanese Yen, as well as general price pressure.
INTERIM REPORT                          6(25)


Nokia Corporation                                          October 15, 2009 at 13:00 (CET +1)

During the third quarter 2009, Devices & Services reported operating profit decreased 51% to EUR 785 million,
compared with EUR 1.6 billion in the third quarter 2008, with a reported operating margin of 11.4% (18.6%).
Devices & Services non-IFRS operating profit decreased 51% to EUR 787 million, compared with EUR 1.6 billion
in the third quarter 2008, with a non-IFRS operating margin of 11.4% (18.6%). The year on year decrease in
non-IFRS operating profit for the third quarter 2009 was due primarily to lower net sales and higher cost of
sales compared with the third quarter 2008. These factors were somewhat mitigated by a reduction in our
operating expenses, compared to the third quarter 2008.

NAVTEQ
(Nokia completed the acquisition of NAVTEQ Corporation on July 10, 2008. Accordingly, NAVTEQ's results for
the third quarter 2008 are not directly comparable to those for the third quarter 2009.)

Third quarter 2009 NAVTEQ net sales increased 6% to EUR 166 million, compared with EUR 156 million in the
third quarter 2008. NAVTEQ reported gross profit was EUR 146 million (EUR 138 million), with a reported gross
margin of 88.0% (88.5%). Non-IFRS gross profit was EUR 146 million (EUR 139 million), with a non-IFRS gross
margin of 88.0% (88.5%). NAVTEQ had a reported operating loss of EUR 68 million (EUR 80 million loss). The
reported operating margin was -41.0% (-51.3%). NAVTEQ non-IFRS operating profit was EUR 43 million (EUR
29 million), with a non-IFRS operating margin of 25.9% (18.5%).

When Nokia assessed goodwill for impairment on its annual impairment testing date in the fourth quarter 2008,
Nokia concluded that a reasonably possible change of 1% in the valuation assumptions for long-term growth rate
and pre-tax discount rate would give rise to an impairment loss for NAVTEQ. Nokia conducted a review and update
of the assumptions used in the 2008 annual impairment testing analysis and performed a sensitivity analysis on
these assumptions to assess the recoverability of NAVTEQ. This assessment resulted in no indication of impairment
for NAVTEQ. However, Nokia has once again concluded that a reasonably possible change of 1% in the valuation
assumptions for long-term growth rate and pre-tax discount rate would give rise to an impairment loss for
NAVTEQ. Nokia continues to evaluate the financial performance and future strategies of NAVTEQ as well as market
and economic conditions to assess the recoverability of NAVTEQ’s carrying amount. Nokia will conduct its annual
goodwill impairment testing in the fourth quarter 2009.

Nokia Siemens Networks
Third quarter 2009 net sales decreased 21% to EUR 2.8 billion, compared with EUR 3.5 billion in the third
quarter 2008, reflecting challenging competitive factors and market conditions. At constant currency, Nokia
Siemens Networks net sales would have decreased 20%. Of total Nokia Siemens Networks net sales, services
contributed EUR 1.3 billion.

The following chart sets out Nokia Siemens Networks net sales for the periods indicated, as well as the year on
year and sequential growth rates, by geographic area.

NOKIA SIEMENS NETWORKS NET SALES BY GEOGRAPHIC AREA
EUR million                                Q3/2009            Q3/2008 YoY Change         Q2/2009 QoQ Change
Europe                                        1 062             1 358     -21.8%           1 209     -12.2%
Middle East & Africa                            387               424       -8.7%            459     -15.7%
Greater China                                   335               288      16.3%             353      -5.1%
Asia-Pacific                                    567               894     -36.6%             648     -12.5%
North America                                   127               150     -15.3%             208     -38.9%
Latin America                                   282               389     -27.5%             322     -12.4%
Total                                         2 760             3 503     -21.2%           3 199     -13.7%

Nokia Siemens Networks reported gross profit decreased 28% to EUR 778 million, compared with EUR 1.1 billion in
the third quarter 2008, with a reported gross margin of 28.2% (30.8%). Nokia Siemens Networks non-IFRS gross
INTERIM REPORT                          7(25)


Nokia Corporation                                         October 15, 2009 at 13:00 (CET +1)

profit decreased 27% to EUR 794 million, compared with EUR 1.1 billion in the third quarter 2008, with a non-IFRS
gross margin of 28.8% (31.2%). The lower year on year non-IFRS gross profit in the third quarter 2009 was due
primarily to lower year on year net sales.

Nokia Siemens Networks had a third quarter 2009 reported operating loss of EUR 1 107 million, compared with an
operating loss of EUR 1 million in the third quarter 2008, with an operating margin of -40.1% (0.0%). The
operating loss in the third quarter 2009 was primarily driven by the EUR 908 million impairment of goodwill. Nokia
Siemens Networks non-IFRS operating loss was EUR 53 million in the third quarter 2009, compared with a non-
IFRS operating profit of EUR 177 million in the third quarter 2008, with a non-IFRS operating margin of -1.9%
(5.1%). The year on year decline in Nokia Siemens Networks non-IFRS operating profit primarily reflected lower
net sales.

Nokia recorded a charge to operating profit in the third quarter 2009 of EUR 908 million for the impairment of
goodwill in Nokia Siemens Networks. After the impairment charge Nokia no longer carries any goodwill with
regard to Nokia Siemens Networks. An additional charge of EUR 432 million was recorded to tax expense to
provide a valuation allowance on Nokia Siemens Networks’ deferred tax assets. The net impact of the asset
impairment charges after minority interest totaled EUR 1 072 million, negatively impacting reported EPS by EUR
0.29.

The recoverability of the investment in Nokia Siemens Networks has declined as a result of the decline in
forecasted profits and cash flows. The asset impairment charges are the result of an evaluation of the historical
and projected financial performance of Nokia Siemens Networks, taking into consideration the challenging
competitive factors and market conditions in the infrastructure and related services business, which have resulted
in lower net sales projections and which, in turn, have reduced the projected scale and thus negatively impacted
projected margins and profitability.

The recognition of a valuation allowance does not impact the validity of the deferred tax assets and Nokia Siemens
Networks retains the possibility of recovering these assets if sufficient future taxable profits become available.

Q3 2009 OPERATING HIGHLIGHTS
– Nokia announced the formation of Solutions, a new unit responsible for driving Nokia’s offering of solutions,
   with the aim of integrating the mobile device, services and content into a unique and compelling offering for
   the consumer. The unit formally started operating on October 1, 2009.
– Nokia announced changes to its Group Executive Board, with Robert Andersson leaving Nokia’s Group Executive
   Board as of September 30, 2009 in connection with his transfer to new duties in Nokia’s Corporate
   Development unit from October 1, 2009; Alberto Torres joining Nokia’s Group Executive Board as of October 1,
   2009 in connection with his appointment as head of Solutions, and; Simon Beresford-Wylie leaving the Group
   Executive Board on September 30, 2009 after stepping down as Chief Executive Officer of Nokia Siemens
   Networks.
– Nokia announced that Rajeev Suri had been appointed as Chief Executive Officer of Nokia Siemens Networks as
   of October 1, 2009.
– Nokia was named as the world's most sustainable technology company according to the 2009-10 edition of
   the prestigious Dow Jones Sustainability Indexes that went live during September. Already rated for several
   years as the leader within the Europe and Communications categories, this year Nokia was also chosen as
   “World Technology Supersector Leader” making it number one across the entire global technology sector.
– Nokia announced that a United States International Trade Commission (ITC) judge issued an Initial
   Determination in favor of Nokia in the action brought by InterDigital against Nokia. The judge's Initial
   Determination is consistent with a previous judgment in the United Kingdom that found several InterDigital
   patents not to be essential to the UMTS mobile standard.
INTERIM REPORT                           8(25)


Nokia Corporation                                          October 15, 2009 at 13:00 (CET +1)

Devices & Services
- Nokia acquired certain assets of cellity, a mobile software company that has developed a solution for
   aggregating address book data, as well as certain assets of Plum Ventures, Inc, a privately held company that
   develops and operates a cloud-based social media sharing and messaging service for private groups. Nokia
   also acquired Dopplr Oy, a privately-held mobile service provider for international travelers. All three
   acquisitions enable Nokia to accelerate the delivery of Ovi services and bring additional internet services talent
   to its Services unit.
- Nokia announced Nokia Money, a new mobile financial service giving mobile device users access to basic
   financial services. The service is to be rolled out gradually to selected markets in early 2010 and will be
   operated in cooperation with Obopay, a leading developer of mobile payment solutions in which Nokia
   invested earlier this year.
- Nokia announced a global alliance with Microsoft to design and market a suite of productivity applications for
   Nokia's range of Symbian smartphones, starting with Nokia’s business-optimized Eseries range of devices.
- Nokia announced the Nokia N900, a handset that delivers computer-grade performance in a compact QWERTY
   and touch form factor. The Nokia N900 runs on Maemo, a desktop PC-like software architecture based on the
   open source Linux software.
- Nokia announced the Nokia Booklet 3G, a new Windows 7-based mini-laptop. The Nokia Booklet 3G is encased
   in an ultra-portable aluminum chassis, runs for up to 12 hours on a single charge and has a broad range of
   connectivity options.
- Nokia announced the Nokia N97 mini, a companion to the Nokia N97. The Nokia N97 mini will be the first
   device to feature Ovi lifecasting, an application developed together with Facebook that enables people for the
   first time to publish their location and status updates directly to their Facebook account from the home screen
   of a mobile device.
- Nokia announced the Nokia X6, a powerful entertainment device with 32GB of on-board memory that, in select
   markets, will be available in combination with Comes With Music, Nokia’s ‘all-you-can-eat-music’ offering.
   Nokia also announced the Nokia X3, an affordable music device and the first Series 40-powered device enabled
   for Ovi Store, Nokia’s store for applications and content.
- Nokia announced the Nokia 5230, an affordable touch smartphone that, in select markets, will also be
   available in combination with Comes With Music.
- Nokia launched Comes With Music in Austria, the Netherlands and South Africa during the quarter, with the
   offering now available on 17 Nokia devices across 12 countries altogether. Additionally, Nokia launched Nokia
   Music Store in India during the quarter, with the chain of digital music stores now localized for 22 countries.
- Nokia announced the Nokia 5800 Navigation Edition, a touch handset preloaded with a lifetime of voice-
   guided Drive and Walk navigation licenses for the user’s region.
- Nokia announced and commenced shipments of the Nokia 3720 classic, a rugged handset designed to resist
   water, dust and shock.
- Nokia Messaging, Nokia’s consumer email service, continued to gain traction among operators with six new
   agreements announced during the quarter. Nokia Messaging is now available to Nokia users in more than 50
   countries and approximately 1 million users are now registered. Additionally, more than 2 million people have
   now activated an Ovi Mail account. Ovi Mail is an email solution developed especially for consumers in
   emerging markets.
- Nokia announced the Ovi SDK Beta, the Ovi Maps Player API for mobile and Ovi Navigation Player API, enabling
   the creation of rich applications for the web as well as the Symbian and Maemo platforms, and which will be
   distributed through the Ovi Store. Ovi developer tools are a key focus area as we continue to expand our
   services offering for consumers and create opportunities for developers and content providers.

NAVTEQ
– NAVTEQ announced the European availability of Motorway Junction Objects, which enables navigation systems
   to display full 3D animation of complex junctions, with coverage of over 6 000 locations.
– NAVTEQ significantly increased major city coverage for its India map, now encompassing 84 cities.
INTERIM REPORT                           9(25)


Nokia Corporation                                          October 15, 2009 at 13:00 (CET +1)

–   NAVTEQ announced that NAVTEQ Discover Cities™ reached a global pedestrian navigation milestone of 100
    cities with the addition of Johannesburg.
–   NAVTEQ acquired Acuity, a US-based company with a leading mobile location-based advertising delivery
    platform. The acquisition underscores NAVTEQ’s commitment to and investment in location-based advertising
    technology and solutions.
–   NAVTEQ launched real time traffic in 11 European countries and expanded NAVTEQ Traffic Patterns™ to 9
    European countries.
–   NAVTEQ announced the integration of Nokia GPS data for availability in NAVTEQ traffic products in North
    America and Europe.
–   NAVTEQ along with Nokia and Magnetti Marelli announced innovative technology to integrate smartphones
    into car infotainment systems.
–   NAVTEQ announced that Nextar selected NAVTEQ Location Point™ to offer their consumers a lifetime of free
    traffic supported by targeted location-based advertising.

Nokia Siemens Networks
– Globe Telecommunications, one of the leading communication service providers in the Philippines can now
   offer Web 2.0 services and roll out new promotional service packages up to 10 times faster than before after
   Nokia Siemens Networks, in collaboration with IBM, implemented a Service Delivery Framework for the
   operator, which offers an agile and efficient service creation environment, and reduces the time to market for
   new services.
– Nokia Siemens Networks in September made the world’s first LTE call using commercial base station and fully
   standard compliant, commercial software. The successful demonstration, as well as the fact that Nokia
   Siemens Networks had delivered LTE-compatible Flexi Base Station hardware to over 100 customers by end
   September, illustrates the readiness of Nokia Siemens Networks’ products for early commercial deployments
   worldwide.
– Nokia Siemens Networks continued to make inroads in North America with a 3G network roll out deal in
   Canada for Globalive Wireless that includes a services-led turnkey deal for the implementation, maintenance,
   design and service assurance as well as a system-led deal for the WCDMA network.
– Nokia Siemens Networks won a number of other key 3G deals in the quarter including a contract with Megafon
   in Russia as the main supplier for the extension of its 3G radio network, and deals with Viettel in Vietnam,
   Hutchison 3G Austria, Nuevatel in Bolivia, T-Mobile in the Czech Republic and Hutchison Telecom in Hong Kong.
– In fixed line, Nokia Siemens Networks was appointed by Belgacom International Carrier Services to upgrade its
   optical network transmission capacity from 10 Gigabit per second (Gbps) per wavelength to 40 Gbps. Other
   deals included an upgrade for České Radiokomunikace for data rates of up to 10 Gbps and a 4 000 km
   extension of a nationwide fiber backbone network for Zain Nigeria.
– Nokia Siemens Networks demonstrated DSL with download speeds of 25 Mbps at a distance of up to 1 500
   meters from the local exchange at Broadband World Forum in Paris with its VDSL2 bonding solution.

For more information on the operating highlights mentioned above, please refer to related press announcements
at the following links: http://www.nokia.com/press, http://www.navteq.com/about/press.html,
http://www.nokiasiemensnetworks.com/press

NOKIA IN THE THIRD QUARTER 2009
(The following discussion is of Nokia's reported results. Comparisons are given to the third quarter 2008 results,
unless otherwise indicated.)

Nokia’s net sales decreased 20% to EUR 9 810 million (EUR 12 237 million). Net sales of Devices & Services
decreased 20% to EUR 6 915 million (EUR 8 605 million). Net sales of NAVTEQ increased 6% to EUR 166 million
(EUR 156 million). Net sales of Nokia Siemens Networks decreased 21% to EUR 2 760 million (EUR 3 503 million).
INTERIM REPORT                           10(25)


Nokia Corporation                                           October 15, 2009 at 13:00 (CET +1)

Operating loss was EUR 426 million (compared with an operating profit of EUR 1 469 million), representing an
operating margin of -4.3% (12.0%). Operating profit in Devices & Services decreased 51% to EUR 785 million (EUR
1 602 million), representing an operating margin of 11.4% (18.6%). Operating loss in NAVTEQ was EUR 68 million
(loss of EUR 80 million), representing an operating margin of -41.0% (-51.3%). Operating loss in Nokia Siemens
Networks was EUR 1 107 million (loss of EUR 1 million), representing an operating margin of -40.1% (0.0%). The
operating loss in Nokia Siemens Networks included a non-deductible impairment of goodwill charge of EUR 908
million. Corporate Common Functions reported expense totaled EUR 36 million (EUR 52 million).

In the third quarter 2009, net financial expense was EUR 48 million (net financial expense EUR 57 million). Loss
before tax was EUR 469 million (profit of EUR 1 410 million). The results after taxes included a charge of EUR 432
million recorded to provide a valuation allowance on Nokia Siemens Networks’ deferred tax assets. Loss was EUR
913 million (profit of EUR 1 055 million), based on a loss of EUR 559 million (profit of EUR 1 087 million)
attributable to equity holders of the parent and a negative EUR 354 million (negative EUR 32 million) attributable
to minority interests. Earnings per share decreased to EUR -0.15 (basic) and EUR -0.15 (diluted), compared with
EUR 0.29 (basic) and EUR 0.29 (diluted) in the third quarter of 2008.

NOKIA IN JANUARY - SEPTEMBER 2009
(The following discussion is of Nokia's reported results. Comparisons are given to the January-September 2008
results, unless otherwise indicated.)

Nokia’s net sales decreased 24% to EUR 28 996 million (EUR 38 048 million). Net sales of Devices & Services
decreased 27% to EUR 19 674 million (EUR 26 958 million). Net sales of NAVTEQ were EUR 445 million. Net sales of
Nokia Siemens Networks decreased 18% to EUR 8 949 million (EUR 10 971 million).

Operating profit decreased 99% to EUR 56 million (EUR 4 474 million), representing an operating margin of 0.2%
(11.8%). Operating profit in Devices & Services decreased 59% to EUR 2 095 million (EUR 5 050 million),
representing an operating margin of 10.6% (18.7%). Operating loss in NAVTEQ was EUR 288 million, representing
an operating margin of -64.7%. Operating loss in Nokia Siemens Networks was EUR 1 656 million (loss of EUR 122
million), representing an operating margin of -18.5% (-1.1%). The operating loss in Nokia Siemens Networks
included a non-deductible impairment of goodwill charge of EUR 908 million. Corporate Common Functions
reported expense totaled EUR 95 million (EUR 374 million).

In the period from January to September 2009, net financial expense was EUR 186 million (net financial income
EUR 14 million). Loss before tax was EUR 101 million (profit of EUR 4 494 million). The results after taxes included a
charge of EUR 432 million recorded to provide a valuation allowance on Nokia Siemens Networks’ deferred tax
assets. Loss was EUR 622 million (profit of EUR 3 338 million), based on a loss of EUR 57 million (profit of EUR 3 412
million) attributable to equity holders of the parent and a negative EUR 565 million (negative EUR 74 million)
attributable to minority interests. Earnings per share decreased to EUR -0.02 (basic) and EUR -0.02 (diluted),
compared with EUR 0.91 (basic) and EUR 0.90 (diluted) in January-September 2008.

PERSONNEL
The average number of employees during January-September 2009 was 123 139, of which the average number of
employees at Nokia Siemens Networks was 61 575. At September 30, 2009, Nokia employed a total of 123 347
people (123 006 September 30, 2008), of which 63 943 were employed by Nokia Siemens Networks (60 183
people at September 30, 2008).

SHARES
The total number of Nokia shares at September 30, 2009 was 3 744 956 052. At September 30, 2009, Nokia
and its subsidiary companies owned 37 380 257 Nokia shares, representing approximately 1.0% of the total
number of Nokia shares and the total voting rights.
INTERIM REPORT                              11(25)


Nokia Corporation                                          October 15, 2009 at 13:00 (CET +1)


CONSOLIDATED INCOME STATEMENT, EUR million
(unaudited)

                                               Reported     Reported         Non-IFRS   Non-IFRS
                                               7-9/2009     7-9/2008         7-9/2009   7-9/2008

Net sales                                          9 810      12 237            9 810      12 239
Cost of sales                                     -6 749      -7 878           -6 733      -7 867

Gross profit                                       3 061        4 359           3 077       4 372
Research and development expenses                 -1 386       -1 466          -1 257      -1 337
Selling and marketing expenses                      -920       -1 068            -822        -967
Administrative and general expenses                 -267         -293            -251        -266
Impairment of goodwill                              -908            -               -           -
Other income                                          40          102              40         102
Other expenses                                       -46         -165             -46        -148

Operating profit                                   -426        1 469              741       1 756
Share of results of associated companies              5           -2                5          -2
Financial income and expenses                       -48          -57              -48         -57

Profit before tax                                  -469        1 410              698       1 697
Tax                                                -444         -355              -96        -444

Profit                                             -913        1 055              602       1 253


Profit attributable to equity holders of the
parent                                             -559        1 087              634       1 219
Profit attributable to minority interests          -354          -32              -32          34
                                                   -913        1 055              602       1 253

Earnings per share, EUR
(for profit attributable to the equity
holders of the parent)
Basic                                              -0.15         0.29            0.17           0.33
Diluted                                            -0.15         0.29            0.17           0.33

Average number of shares (1 000 shares)
Basic                                          3 707 535   3 700 704        3 707 535   3 700 704
Diluted                                        3 714 202   3 736 440        3 714 202   3 736 440


Depreciation and amortization, total                428          490              198           262

Share-based compensation expense, total              15           31               15            31
INTERIM REPORT                              12(25)


Nokia Corporation                                          October 15, 2009 at 13:00 (CET +1)


CONSOLIDATED INCOME STATEMENT, EUR million
(unaudited)

                                               Reported     Reported         Non-IFRS   Non-IFRS
                                               1-9/2009     1-9/2008         1-9/2009   1-9/2008

Net sales                                         28 996      38 048           28 999      38 057
Cost of sales                                    -19 805     -24 738          -19 691     -24 520

Gross profit                                       9 191      13 310            9 308      13 537
Research and development expenses                 -4 344      -4 237           -3 941      -4 017
Selling and marketing expenses                    -2 885      -3 093           -2 575      -2 855
Administrative and general expenses                 -851        -939             -764        -837
Impairment of goodwill                              -908           -                -           -
Other income                                         239         266              171         201
Other expenses                                      -386        -833             -169        -237

Operating profit                                     56        4 474            2 030       5 792
Share of results of associated companies             29            6               29           6
Financial income and expenses                      -186           14             -186          14

Profit before tax                                  -101         4 494           1 873       5 812
Tax                                                -521        -1 156            -417      -1 532

Profit                                             -622        3 338            1 456       4 280


Profit attributable to equity holders of the
parent                                              -57        3 412            1 543       4 115
Profit attributable to minority interests          -565          -74              -87         165
                                                   -622        3 338            1 456       4 280

Earnings per share, EUR
(for profit attributable to the equity
holders of the parent)
Basic                                              -0.02         0.91            0.42           1.09
Diluted                                            -0.02         0.90            0.41           1.08

Average number of shares (1 000 shares)
Basic                                          3 704 106   3 759 091        3 704 106   3 759 091
Diluted                                        3 721 107   3 802 880        3 721 107   3 802 880


Depreciation and amortization, total              1 333        1 171              618           705

Share-based compensation expense, total               -1         127               -1           127
INTERIM REPORT                       13(25)


Nokia Corporation                                            October 15, 2009 at 13:00 (CET +1)


NOKIA NET SALES BY GEOGRAPHIC AREA, EUR million
(unaudited)

                                         Y-o-Y
                                       change,
Reported                  7-9/2009          %     7-9/2008     1-12/2008

Europe                       3 558         -19       4 386        18 842
Middle-East & Africa         1 357         -25       1 804         7 265
Greater China                1 736           1       1 722         6 420
Asia-Pacific                 2 040         -25       2 711        11 344
North America                  392         -29         554         2 068
Latin America                  727         -31       1 060         4 771

Total                        9 810         -20      12 237        50 710


NOKIA PERSONNEL BY GEOGRAPHIC AREA

                                          Y-o-Y
                                        change,
                           30.09.09          %      30.09.08     31.12.08

Europe                       58 814          -4      61 268       61 971
Middle-East & Africa          4 140         -20       5 161        5 160
Greater China                15 059           5      14 319       14 879
Asia-Pacific                 23 370          13      20 646       21 832
North America                 7 936          -7       8 547        8 862
Latin America                14 028           7      13 065       13 125

Total                       123 347           0     123 006      125 829
INTERIM REPORT                              14(25)


Nokia Corporation                                              October 15, 2009 at 13:00 (CET +1)


DEVICES & SERVICES, EUR million
(unaudited)

                                                           Special                               Special
                                                          items &                               items &
                                           Reported           PPA    Non-IFRS      Reported         PPA    Non-IFRS
                                           7-9/2009     7-9/2009     7-9/2009      7-9/2008   7-9/2008     7-9/2008

Net sales                                      6 915             -         6 915      8 605            -      8 605
Cost of sales                                 -4 778             -        -4 778     -5 464            -     -5 464

Gross profit                                   2 137             -        2 137       3 141            -      3 141
 % of net sales                                 30.9                        30.9       36.5                    36.5

Research and development expenses 1)            -703             2         -701        -719            -      -719
 % of net sales                                 10.2                        10.1        8.4                     8.4

Selling and marketing expenses                  -552             -         -552        -684            -      -684
 % of net sales                                   8.0                        8.0        7.9                     7.9

Administrative and general expenses             -105             -         -105        -110            -      -110
 % of net sales                                   1.5                        1.5        1.3                     1.3

Other income and expenses                           8            -            8         -26            -        -26

Operating profit                                 785             2          787       1 602            -      1 602
 % of net sales                                 11.4                        11.4       18.6                    18.6

1) Amortization of acquired intangible assets of EUR 2 million in Q3/09
INTERIM REPORT                                15(25)


Nokia Corporation                                                        October 15, 2009 at 13:00 (CET +1)


NAVTEQ, EUR million
(unaudited)

                                                                  Special                                    Special
                                                                 items &                                    items &
                                                Reported             PPA       Non-IFRS     Reported            PPA      Non-IFRS
                                                7-9/2009       7-9/2009        7-9/2009     7-9/2008      7-9/2008       7-9/2008

Net sales 1)                                          166                 -         166            156            1             157
Cost of sales                                         -20                 -         -20            -18            -             -18

Gross profit                                          146                 -         146            138            1             139
 % of net sales                                       88.0                         88.0            88.5                         88.5

Research and development expenses
2)                                                   -152                83         -69           -158           81             -77
 % of net sales                                       91.6                         41.6           101.3                         49.0

Selling and marketing expenses 3)                      -49               28         -21            -50           27             -23
 % of net sales                                       29.5                         12.7            32.1                         14.6

Administrative and general expenses                    -13                -         -13            -13             -            -13
 % of net sales                                        7.8                          7.8             8.3                          8.3

Other income and expenses                                 -               -           -              3             -              3

Operating profit                                       -68           111             43            -80         109               29
 % of net sales                                      -41.0                         25.9           -51.3                         18.5

1) Deferred revenue related to acquisitions of EUR 1 million in Q3/08.

2) Amortization of acquired intangibles of EUR 83 million in Q3/09 and EUR 81 million in Q3/08.

3) Amortization of acquired intangibles of EUR 28 million in Q3/09 and EUR 27 million in Q3/08.
INTERIM REPORT                                 16(25)


Nokia Corporation                                                        October 15, 2009 at 13:00 (CET +1)


NOKIA SIEMENS NETWORKS, EUR million
(unaudited)

                                                                   Special                                   Special
                                                                  items &                                   items &
                                                  Reported            PPA      Non-IFRS      Reported           PPA      Non-IFRS
                                                  7-9/2009      7-9/2009       7-9/2009      7-9/2008     7-9/2008       7-9/2008

Net sales 1)                                          2 760                -        2 760       3 503              1          3 504
Cost of sales 2)                                     -1 982               16       -1 966      -2 423             11         -2 412

Gross profit                                            778               16          794       1 080             12         1 092
 % of net sales                                        28.2                           28.8        30.8                         31.2

Research and development expenses 3)                   -531               44        -487         -586             48          -538
 % of net sales                                        19.2                           17.6        16.7                         15.4

Selling and marketing expenses 4)                      -318               70        -248         -334             74          -260
 % of net sales                                        11.5                            9.0         9.5                           7.4

Administrative and general expenses 5)                 -128               16        -112         -141             27          -114
 % of net sales                                          4.6                           4.1         4.0                           3.3

Other income and expenses 6)                           -908              908             -         -20            17             -3

Operating profit                                     -1 107         1 054             -53            -1          178           177
 % of net sales                                       -40.1                           -1.9         0.0                           5.1

1) Deferred revenue related to acquisitions of EUR 1 million in Q3/08.

2) Restructuring charges of EUR 16 million in Q3/09 and of EUR 11 million in Q3/08.

3) Reversal of restructuring charges of EUR 1 million and amortization of acquired intangibles of EUR 45 million
in Q3/09. Restructuring charges of EUR 3 million and amortization of acquired intangibles of EUR 45 million in Q3/08.

4) Reversal of restructuring charges of EUR 2 million and amortization of acquired intangibles of EUR 72 million in Q3/09.
Restructuring charges of EUR 2 million and amortization of acquired intangibles of EUR 72 million in Q3/08.

5) Restructuring charges of EUR 16 million in Q3/09 and EUR 27 million in Q3/08.

6) Impairment of goodwill of EUR 908 million in Q3/09. Restructuring charges of EUR 16 million and
amortization of acquired intangibles of EUR 1 million in Q3/08.
INTERIM REPORT                            17(25)


Nokia Corporation                                        October 15, 2009 at 13:00 (CET +1)


GROUP COMMON FUNCTIONS, EUR million
(unaudited)

                                                    Special                            Special
                                                   items &                            items &
                                      Reported         PPA    Non-IFRS   Reported         PPA     Non-IFRS
                                      7-9/2009   7-9/2009     7-9/2009   7-9/2008   7-9/2008      7-9/2008

Net sales                                    -            -          -          -             -             -
Cost of sales                                -            -          -          -             -             -

Gross profit                                 -            -          -          -             -             -

Research and development expenses            -            -          -         -3             -         -3

Selling and marketing expenses              -1            -         -1          -             -             -

Administrative and general expenses        -21            -        -21        -29             -        -29

Other income and expenses                  -14            -        -14        -20             -        -20

Operating profit                           -36            -        -36        -52             -        -52
INTERIM REPORT                                    18(25)


Nokia Corporation                                                     October 15, 2009 at 13:00 (CET +1)


CONSOLIDATED INCOME STATEMENT, EUR million
(unaudited)
NOKIA GROUP
                                                                    Special                                  Special
                                                                     items                                    items
                                                      Reported       & PPA     Non-IFRS      Reported         & PPA     Non-IFRS
                                                      7-9/2009    7-9/2009     7-9/2009      7-9/2008      7-9/2008     7-9/2008
Net sales 1)                                              9 810            -        9 810        12 237             2       12 239
Cost of sales 2)                                         -6 749           16       -6 733        -7 878            11       -7 867
Gross profit                                             3 061            16        3 077         4 359            13        4 372
% of net sales                                             31.2                       31.4         35.6                        35.7
Research and development expenses 3)                     -1 386          129       -1 257        -1 466          129        -1 337
% of net sales                                             14.1                       12.8         12.0                        10.9
Selling and marketing expenses 4)                         -920            98         -822        -1 068          101          -967
% of net sales                                              9.4                        8.4           8.7                         7.9
Administrative and general expenses 5)                    -267            16         -251          -293            27         -266
% of net sales                                              2.7                        2.6           2.4                         2.2
Other income and expenses 6)                              -914           908            -6          -63            17           -46

Operating profit                                          -426         1 167          741         1 469          287         1 756
% of net sales                                             -4.3                        7.6         12.0                        14.3
Share of results of associated companies                     5                           5           -2                          -2
Financial income and expenses                              -48                         -48          -57                         -57

Profit before tax                                         -469         1 167          698         1 410          287         1 697
Tax                                                       -444           348          -96          -355          -89          -444

Profit                                                    -913         1 515          602         1 055          198         1 253

Profit attributable to equity holders of the parent       -559         1 193          634         1 087          132         1 219
Profit attributable to minority interests                 -354           322          -32           -32           66            34
                                                          -913         1 515          602         1 055          198         1 253

Earnings per share, EUR
(for profit attributable to the equity holders
of the parent)
Basic                                                     -0.15         0.32          0.17         0.29          0.04          0.33
Diluted                                                   -0.15         0.32          0.17         0.29          0.04          0.33
Average number of shares
(1 000 shares)
Basic                                                 3 707 535                 3 707 535     3 700 704                  3 700 704
Diluted                                               3 714 202                 3 714 202     3 736 440                  3 736 440

Depreciation and amortization, total                       428          -230          198           490          -228          262
Share-based compensation expense, total                     15             -           15            31             -            31

1) Deferred revenue related to acquisitions of EUR 2 million in Q3/08.
2) Restructuring charges of EUR 16 million in Q3/09 and EUR 11 million in Q3/08.
3) Reversal of restructuring charges of EUR 1 million and amortization of acquired intangible assets of EUR 130 million in Q3/09.
Restructuring charges of EUR 3 million and amortization of acquired intangible assets of EUR 126 million in Q3/08.
4) Reversal of restructuring charges of EUR 2 million and amortization of acquired intangible assets of EUR 100 million in Q3/09.
Restructuring charges of 2 million and amortization of acquired intangible assets of EUR 99 million in Q3/08.
5) Restructuring charges of EUR 16 million in Q3/09 and EUR 27 million in Q3/08.
6) Impairment of goodwill of EUR 908 million in Q3/09. Restructuring charges of EUR 16 million and amortization of acquired
intangibles of EUR 1 million in Q3/08.
INTERIM REPORT                              19(25)


Nokia Corporation                                                   October 15, 2009 at 13:00 (CET +1)


CONSOLIDATED INCOME STATEMENT, IFRS, EUR million
(unaudited)


                                                                7-9/2009    7-9/2008    1-9/2009    1-9/2008      1-12/2008

Net sales                                                           9 810     12 237       28 996      38 048        50 710
Cost of sales                                                      -6 749     -7 878      -19 805     -24 738       -33 337

Gross profit                                                        3 061       4 359       9 191     13 310         17 373
Research and development expenses                                  -1 386      -1 466      -4 344     -4 237         -5 968
Selling and marketing expenses                                       -920      -1 068      -2 885     -3 093         -4 380
Administrative and general expenses                                  -267        -293        -851       -939         -1 284
Impairment of goodwill                                               -908           -        -908          -              -
Other income                                                           40         102         239        266            420
Other expenses                                                        -46        -165        -386       -833         -1 195

Operating profit                                                    -426       1 469          56       4 474          4 966
Share of results of associated companies                               5          -2          29           6              6
Financial income and expenses                                        -48         -57        -186          14             -2

Profit before tax                                                   -469       1 410        -101        4 494         4 970
Tax                                                                 -444        -355        -521       -1 156        -1 081


Profit                                                              -913       1 055        -622       3 338          3 889


Profit attributable to equity holders of the parent                 -559       1 087         -57       3 412          3 988
Profit attributable to minority interests                           -354         -32        -565         -74            -99


                                                                    -913       1 055        -622       3 338          3 889


Earnings per share, EUR

(for profit attributable to the equity holders of the parent)
Basic                                                               -0.15        0.29       -0.02        0.91            1.07
Diluted                                                             -0.15        0.29       -0.02        0.90            1.05

Average number of shares (1 000 shares)
Basic                                                           3 707 535   3 700 704   3 704 106   3 759 091     3 743 622
Diluted                                                         3 714 202   3 736 440   3 721 107   3 802 880     3 780 363


Depreciation and amortization, total                                 428         490       1 333       1 171          1 617

Share-based compensation expense, total                               15          31           -1        127              67
INTERIM REPORT                           20(25)


Nokia Corporation                                       October 15, 2009 at 13:00 (CET +1)


CONSOLIDATED STATEMENT OF COMPREHENSIVE INCOME, IFRS, EUR million


                                             7-9/2009   7-9/2008    1-9/2009   1-9/2008      1-12/2008

Profit                                           -913      1 055        -622      3 338          3 889

Other comprehensive income
   Tax benefit on stock options exercised           -          4           -         4              4
   Excess tax benefit on share-based
   compensation                                    -1        -22         -14       -122           -128
   Translation differences                       -405        471        -566        422            595
   Net investment hedge gains/losses               74        -67         108        -41           -123
   Cash flow hedges                               398        189         110       -116            -40
   Available-for-sale investments                   9         11          -3         29            -15
   Other increase/decrease, net                     -         98         -12         65             28
Income tax related to components of other
comprehensive income                             -128        -26         -68        45             58

Other comprehensive income, net of tax            -53        658        -445       286            379

Total comprehensive income                       -966      1 713      -1 067      3 624          4 268


Total comprehensive income attributable to
  equity holders of the parent                  -644       1 835        -545      3 790          4 459
  minority interests                            -322        -122        -522       -166           -191
                                                -966       1 713      -1 067      3 624          4 268
INTERIM REPORT                             21(25)


Nokia Corporation                                                     October 15, 2009 at 13:00 (CET +1)


CONSOLIDATED STATEMENT OF FINANCIAL POSITION, IFRS, EUR million (unaudited)

ASSETS                                                                        30.09.2009   30.09.2008   31.12.2008
Non-current assets
  Capitalized development costs                                                     174          328          244
  Goodwill                                                                        5 189        5 577        6 257
  Other intangible assets                                                         3 013        4 117        3 913
  Property, plant and equipment                                                   1 930        2 047        2 090
  Investments in associated companies                                                71          335           96
  Available-for-sale investments                                                    495          492          512
  Deferred tax assets                                                             1 581        1 904        1 963
  Long-term loans receivable                                                         34           40           27
  Other non-current assets                                                            8           20           10
                                                                                 12 495       14 860       15 112
Current assets
   Inventories                                                                    2 034        3 246        2 533
   Accounts receivable                                                            8 263       10 772        9 444
   Prepaid expenses and accrued income                                            4 676        3 741        4 538
   Current portion of long-term loans receivable                                     13          100          101
   Other financial assets                                                           461          325        1 034
   Investments at fair value through profit and loss, liquid assets                 688            -            -
   Available-for-sale investments, liquid assets                                  1 770        1 466        1 272
   Available-for-sale investments, cash equivalents                               3 520        4 040        3 842
   Bank and cash                                                                  1 454        1 726        1 706
                                                                                 22 879       25 416       24 470
Total assets                                                                     35 374       40 276       39 582

SHAREHOLDERS' EQUITY AND LIABILITIES
Capital and reserves attributable to equity holders of the parent
   Share capital                                                                    246          246          246
   Share issue premium                                                              274          533          442
   Treasury shares                                                                 -694       -1 919       -1 881
   Translation differences                                                         -134          213          341
   Fair value and other reserves                                                     72           51           62
   Reserve for invested non-restricted equity                                     3 176        3 321        3 306
   Retained earnings                                                              9 175       11 145       11 692
                                                                                 12 115       13 590       14 208
Minority interests                                                                1 762        2 355        2 302
Total equity                                                                     13 877       15 945       16 510

Non-current liabilities
  Long-term interest-bearing liabilities                                          4 447          174          861
  Deferred tax liabilities                                                        1 365        1 797        1 787
  Other long-term liabilities                                                        64          159           69
                                                                                  5 876        2 130        2 717
Current liabilities
   Current portion of long-term loans                                                 14           62           13
   Short-term borrowing                                                              838        4 050        3 578
   Other financial liabilities                                                       139          526          924
   Accounts payable                                                                5 066        6 369        5 225
   Accrued expenses                                                                6 567        7 686        7 023
   Provisions                                                                      2 997        3 508        3 592
                                                                                  15 621       22 201       20 355
Total shareholders' equity and liabilities                                        35 374       40 276       39 582
Interest-bearing liabilities                                                       5 299        4 286        4 452
Shareholders' equity per share, EUR                                                 3.27         3.68         3.84
Number of shares (1 000 shares) 1)                                             3 707 576    3 696 490    3 697 872
1) Shares owned by Group companies are excluded.
INTERIM REPORT                               22(25)


Nokia Corporation                                                     October 15, 2009 at 13:00 (CET +1)


CONSOLIDATED STATEMENT OF CASH FLOWS, IFRS, EUR million
(unaudited)
                                                                                  1-9/2009      1-9/2008    1-12/2008
Cash flow from operating activities
Profit attributable to equity holders of the parent                                     -57         3 412       3 988
   Adjustments, total                                                                 2 603         2 947       3 469
   Change in net working capital                                                        587        -1 548      -2 546
Cash generated from operations                                                        3 133         4 811       4 911
   Interest received                                                                     93           341         416
   Interest paid                                                                       -177           -86        -155
   Other financial income and expenses, net                                            -513           216        -195
   Income taxes paid                                                                   -824        -1 786      -1 780
Net cash from operating activities                                                    1 712         3 496       3 197

Cash flow from investing activities
Acquisition of Group companies, net of acquired cash                                    -25        -5 463      -5 962
Purchase of current available-for-sale investments, liquid assets                    -1 198          -595        -669
Purchase of investments at fair value through profit and loss, liquid assets           -695             -           -
Purchase of non-current available-for-sale investments                                  -61           -49        -121
Purchase of shares in associated companies                                              -27           -15         -24
Additions to capitalized development costs                                              -26           -77        -131
Long-term loans made to customers                                                         -           -54           -
Proceeds from repayment and sale of long-term loans receivable                            -           108         129
Proceeds from (+) / payment of (-) other long-term loans receivable                       -           -48          -1
Proceeds from (+) / payment of (-) short-term loans receivable                            1            49         -15
Capital expenditures                                                                   -384          -665        -889
Proceeds from disposal of shares in associated companies                                 39             2           3
Proceeds from disposal of businesses                                                     62            61          41
Proceeds from maturities and sale of current available-for-sale investments,
liquid assets                                                                           690         4 184       4 664
Proceeds from sale of non-current available-for-sale investments                         10             9          10
Proceeds from sale of fixed assets                                                       18            55          54
Dividends received                                                                        2             3           6
Net cash used in investing activities                                                -1 594        -2 495      -2 905

Cash flow from financing activities
Proceeds from stock option exercises                                                      -            51          53
Purchase of treasury shares                                                               -        -3 121      -3 121
Proceeds from long-term borrowings                                                    3 899            14         714
Repayment of long-term borrowings                                                      -210           -33         -34
Proceeds from (+) / payment of (-) short-term borrowings                             -2 829         3 016       2 891
Dividends paid                                                                       -1 520        -2 010      -2 048
Net cash used in financing activities                                                  -660        -2 083      -1 545

Foreign exchange adjustment                                                             -32            -2         -49
Net increase (+) / decrease (-) in cash and cash equivalents                           -574        -1 084      -1 302
Cash and cash equivalents at beginning of period                                      5 548         6 850       6 850
Cash and cash equivalents at end of period                                            4 974         5 766       5 548
NB: The figures in the consolidated cash flow statement cannot be directly traced from the balance sheet
without additional information as a result of acquisitions and disposals of subsidiaries and net foreign
exchange differences arising on consolidation.
INTERIM REPORT                                      23(25)


Nokia Corporation                                                        October 15, 2009 at 13:00 (CET +1)


CONSOLIDATED STATEMENT OF CHANGES IN SHAREHOLDERS' EQUITY, IFRS, EUR million
(unaudited)

                                                                                               Reserve
                                                                                      Fair           for
                                                                                    value     invested
                                               Share                                 and          non-
                                   Share        issue   Treasury   Translation      other    restricted    Retained    Before    Minority    Total
                                  capital   premium       shares    difference   reserves       equity     earnings   minority   interest   equity
Balance at December 31, 2007        246          644     -3 146          -163          23        3 299      13 870     14 773      2 565    17 338
Total comprehensive income              -       -113           -          376          28             -      3 499      3 790       -166     3 624
Stock options exercised                                                                              51                    51                  51
Stock options exercised related
to acquisitions                                    1                                                                        1                   1
Share-based compensation                         132                                                                      132                 132
Settlement of performance
shares                                          -150        116                                     -29                   -63                  -63
Acquisition of treasury shares                           -3 123                                                        -3 123               -3 123
Reissuance of treasury shares                                 2                                                             2                   2
Cancellation of treasury shares                           4 232                                              -4 232          -                   -
Dividend                                                                                                     -1 992    -1 992        -11    -2 003
Acquisitions and other changes
in minority interests                                                                                                        -       -33       -33
Vested portion of share-based
payment awards related to
acquisitions                                      19                                                                       19                  19
Balance at September 30, 2008       246          533     -1 919           213          51        3 321      11 145     13 590      2 355    15 945


Balance at December 31, 2008        246          442     -1 881           341          62        3 306      11 692     14 208      2 302    16 510
Total comprehensive income              -        -13           -         -475          10             -        -67       -545       -522    -1 067
Stock options exercised related
to acquisitions                                   -1                                                                       -1                   -1
Share-based compensation                           1                                                                        1                   1
Settlement of performance
shares                                          -155        217                                   -130                    -68                  -68
Reissuance of treasury shares                                 1                                                             1                   1
Cancellation of treasury shares                             969                                               -969           -                   -
Dividend                                                                                                     -1 481    -1 481        -18    -1 499
Balance at September 30, 2009       246          274       -694          -134          72        3 176       9 175     12 115      1 762    13 877
INTERIM REPORT                             24(25)


Nokia Corporation                                       October 15, 2009 at 13:00 (CET +1)


COMMITMENTS AND CONTINGENCIES, EUR million
(unaudited)
                                                                          GROUP
                                                         30.09.2009   30.09.2008    31.12.2008

Collateral for own commitments
Property under mortgages                                         18           18              18
Assets pledged                                                   10           11              11

Contingent liabilities on behalf of Group companies
Guarantees for loans                                              -            -            -
Other guarantees                                              2 581        2 900        2 896

Contingent liabilities on behalf of other companies
Financial guarantees on behalf of third parties                   1          155               2
Other guarantees                                                  3            6               1

Leasing obligations                                           1 263        1 254        1 156

Financing commitments
Customer finance commitments                                     35          289             197
Venture fund commitments                                        324          489             467


1 EUR = 1.459 USD


The unaudited, consolidated interim financial statements of Nokia have been prepared in accordance with the
International Financial Reporting Standards (“IFRS”). The same accounting policies and methods of
computation are followed in the interim financial statements as were followed in the consolidated financial
statements of Nokia for 2008.
INTERIM REPORT                                          25(25)


Nokia Corporation                                                                 October 15, 2009 at 13:00 (CET +1)

FORWARD-LOOKING STATEMENTS
It should be noted that certain statements herein which are not historical facts, including, without limitation, those regarding: A) the timing of product,
services and solution deliveries; B) our ability to develop, implement and commercialize new products, services, solutions and technologies; C) our ability to
develop and grow our consumer Internet services business; D) expectations regarding market developments and structural changes; E) expectations
regarding our mobile device volumes, market share, prices and margins; F) expectations and targets for our results of operations; G) the outcome of pending
and threatened litigation; H) expectations regarding the successful completion of contemplated acquisitions on a timely basis and our ability to achieve the
set targets upon the completion of such acquisitions; and I) statements preceded by "believe," "expect," "anticipate," "foresee," "target," "estimate,"
"designed," "plans," "will" or similar expressions are forward-looking statements. These statements are based on management's best assumptions and beliefs
in light of the information currently available to it. Because they involve risks and uncertainties, actual results may differ materially from the results that we
currently expect. Factors that could cause these differences include, but are not limited to: 1) the deteriorating global economic conditions and related
financial crisis and their impact on us, our customers and end-users of our products, services and solutions, our suppliers and collaborative partners; 2) the
development of the mobile and fixed communications industry, as well as the growth and profitability of the new market segments that we target and our
ability to successfully develop or acquire and market products, services and solutions in those segments; 3) the intensity of competition in the mobile and
fixed communications industry and our ability to maintain or improve our market position or respond successfully to changes in the competitive landscape;
4) competitiveness of our product, services and solutions portfolio; 5) our ability to successfully manage costs; 6) exchange rate fluctuations, including, in
particular, fluctuations between the euro, which is our reporting currency, and the US dollar, the Japanese yen, the Chinese yuan and the UK pound sterling,
as well as certain other currencies; 7) the success, financial condition and performance of our suppliers, collaboration partners and customers; 8) our ability to
source sufficient amounts of fully functional components, sub-assemblies, software and content without interruption and at acceptable prices; 9) the impact
of changes in technology and our ability to develop or otherwise acquire and timely and successfully commercialize complex technologies as required by the
market; 10) the occurrence of any actual or even alleged defects or other quality, safety or security issues in our products, services and solutions; 11) the
impact of changes in government policies, trade policies, laws or regulations or political turmoil in countries where we do business; 12) our success in
collaboration arrangements with others relating to development of technologies or new products, services and solutions; 13) our ability to manage efficiently
our manufacturing and logistics, as well as to ensure the quality, safety, security and timely delivery of our products, services and solutions; 14) inventory
management risks resulting from shifts in market demand; 15) our ability to protect the complex technologies, which we or others develop or that we license,
from claims that we have infringed third parties' intellectual property rights, as well as our unrestricted use on commercially acceptable terms of certain
technologies in our products, services and solutions; 16) our ability to protect numerous Nokia, NAVTEQ and Nokia Siemens Networks patented, standardized
or proprietary technologies from third-party infringement or actions to invalidate the intellectual property rights of these technologies; 17) any disruption to
information technology systems and networks that our operations rely on; 18) developments under large, multi-year contracts or in relation to major
customers; 19) the management of our customer financing exposure; 20) our ability to retain, motivate, develop and recruit appropriately skilled employees;
21) whether, as a result of investigations into alleged violations of law by some former employees of Siemens AG ("Siemens"), government authorities or
others take further actions against Siemens and/or its employees that may involve and affect the carrier-related assets and employees transferred by Siemens
to Nokia Siemens Networks, or there may be undetected additional violations that may have occurred prior to the transfer, or violations that may have
occurred after the transfer, of such assets and employees that could result in additional actions by government authorities; 22) any impairment of Nokia
Siemens Networks customer relationships resulting from the ongoing government investigations involving the Siemens carrier-related operations transferred
to Nokia Siemens Networks; 23) unfavorable outcome of litigations; 24) allegations of possible health risks from electromagnetic fields generated by base
stations and mobile devices and lawsuits related to them, regardless of merit; as well as the risk factors specified on pages 11-28 of Nokia's annual report on
Form 20-F for the year ended December 31, 2008 under Item 3D. "Risk Factors." Other unknown or unpredictable factors or underlying assumptions
subsequently proving to be incorrect could cause actual results to differ materially from those in the forward-looking statements. Nokia does not undertake
any obligation to publicly update or revise forward-looking statements, whether as a result of new information, future events or otherwise, except to the
extent legally required.


Nokia, Helsinki – October 15, 2009

Media and Investor Contacts:
Corporate Communications, tel. +358 7180 34900
Investor Relations Europe, tel. +358 7180 34289
Investor Relations US, tel. +1 914 368 0555

     -     Nokia plans to publish its fourth quarter 2009 results on January 28, 2010.
     -     Nokia plans to report its other quarterly results in 2010 on the following dates: Q1 on April 22, Q2 on July
           22 and Q3 on October 21, 2010.
     -     Nokia plans to publish its annual report, Nokia in 2009, in week 12 of 2010
     -     Nokia’s Annual General Meeting is scheduled to be held on May 6, 2010.

www.nokia.com

Contenu connexe

En vedette

wal mart store 2001Financials
wal mart store 2001Financialswal mart store 2001Financials
wal mart store 2001Financialsfinance1
 
Evaluation of a clinical information system (cis)
Evaluation of a clinical information system (cis)Evaluation of a clinical information system (cis)
Evaluation of a clinical information system (cis)nikita024
 
liwoli_machine workshop
liwoli_machine workshopliwoli_machine workshop
liwoli_machine workshopminipimer tv
 
Sie republica de_colombia
Sie republica de_colombiaSie republica de_colombia
Sie republica de_colombia19472546
 
0. plan anticorrupcion abriaqui 2015 ok
0. plan anticorrupcion abriaqui 2015  ok0. plan anticorrupcion abriaqui 2015  ok
0. plan anticorrupcion abriaqui 2015 okAbriaqui-Antioquia
 

En vedette (9)

wal mart store 2001Financials
wal mart store 2001Financialswal mart store 2001Financials
wal mart store 2001Financials
 
Evaluation of a clinical information system (cis)
Evaluation of a clinical information system (cis)Evaluation of a clinical information system (cis)
Evaluation of a clinical information system (cis)
 
Guía 3
Guía 3Guía 3
Guía 3
 
Ley 115 de 1994
Ley 115 de 1994Ley 115 de 1994
Ley 115 de 1994
 
liwoli_machine workshop
liwoli_machine workshopliwoli_machine workshop
liwoli_machine workshop
 
Unidad5
Unidad5 Unidad5
Unidad5
 
Sie republica de_colombia
Sie republica de_colombiaSie republica de_colombia
Sie republica de_colombia
 
0. plan anticorrupcion abriaqui 2015 ok
0. plan anticorrupcion abriaqui 2015  ok0. plan anticorrupcion abriaqui 2015  ok
0. plan anticorrupcion abriaqui 2015 ok
 
Actividad #3
Actividad #3 Actividad #3
Actividad #3
 

Similaire à Nokia 2009 Üçüncü Çeyrek

Nokia Q4 2008 earnings report
Nokia Q4 2008 earnings reportNokia Q4 2008 earnings report
Nokia Q4 2008 earnings reportearningsreport
 
virgin media. FINAL_VM_Q308_Press_Release
virgin media. FINAL_VM_Q308_Press_Releasevirgin media. FINAL_VM_Q308_Press_Release
virgin media. FINAL_VM_Q308_Press_Releasefinance28
 
virgin media. FINAL_VM_Q308_Press_Release
virgin media. FINAL_VM_Q308_Press_Releasevirgin media. FINAL_VM_Q308_Press_Release
virgin media. FINAL_VM_Q308_Press_Releasefinance28
 
Quarterly report (Q3) 2008
Quarterly report (Q3) 2008Quarterly report (Q3) 2008
Quarterly report (Q3) 2008Tele2
 
Présentation des résultats financiers Ericsson (Q3 2009)
Présentation des résultats financiers Ericsson (Q3 2009)Présentation des résultats financiers Ericsson (Q3 2009)
Présentation des résultats financiers Ericsson (Q3 2009)Ericsson France
 
Quarterly Earnings Nokia
Quarterly Earnings NokiaQuarterly Earnings Nokia
Quarterly Earnings Nokiakimdhondt
 
Electrolux Interim Report Q1 2009
Electrolux Interim Report Q1 2009Electrolux Interim Report Q1 2009
Electrolux Interim Report Q1 2009Electrolux Group
 
Présentation des résultats financiers Sony Ericsson (Q2 2010)
  Présentation des résultats financiers Sony Ericsson (Q2 2010)  Présentation des résultats financiers Sony Ericsson (Q2 2010)
Présentation des résultats financiers Sony Ericsson (Q2 2010)Ericsson France
 
Enel 1 Q 2009 Results May 12 2009
Enel 1 Q 2009 Results   May 12 2009Enel 1 Q 2009 Results   May 12 2009
Enel 1 Q 2009 Results May 12 2009Enel S.p.A.
 
1 q09 presentation
1 q09 presentation1 q09 presentation
1 q09 presentationEquatorial
 
1 q09 presentation
1 q09 presentation1 q09 presentation
1 q09 presentationEquatorial
 
virgin media. _q12008_final
virgin media. _q12008_finalvirgin media. _q12008_final
virgin media. _q12008_finalfinance28
 
virgin media. _q12008_final
virgin media. _q12008_finalvirgin media. _q12008_final
virgin media. _q12008_finalfinance28
 
Telecom Italia 3Q 2010 Results
Telecom Italia 3Q 2010 ResultsTelecom Italia 3Q 2010 Results
Telecom Italia 3Q 2010 ResultsGruppo TIM
 
Press Release 3 Q02 Tele Celular Sul En
Press Release 3 Q02   Tele Celular Sul EnPress Release 3 Q02   Tele Celular Sul En
Press Release 3 Q02 Tele Celular Sul EnTIM RI
 
Third Quarter 2009 Financial Results
Third Quarter 2009 Financial ResultsThird Quarter 2009 Financial Results
Third Quarter 2009 Financial ResultsGruppo TIM
 
Q2 presentation
Q2 presentation Q2 presentation
Q2 presentation Tele2
 
virgin media. FINAL_VM_Q208_Press_Release
virgin media. FINAL_VM_Q208_Press_Releasevirgin media. FINAL_VM_Q208_Press_Release
virgin media. FINAL_VM_Q208_Press_Releasefinance28
 
virgin media. FINAL_VM_Q208_Press_Release
virgin media. FINAL_VM_Q208_Press_Releasevirgin media. FINAL_VM_Q208_Press_Release
virgin media. FINAL_VM_Q208_Press_Releasefinance28
 

Similaire à Nokia 2009 Üçüncü Çeyrek (20)

Nokia Q4 2008 earnings report
Nokia Q4 2008 earnings reportNokia Q4 2008 earnings report
Nokia Q4 2008 earnings report
 
virgin media. FINAL_VM_Q308_Press_Release
virgin media. FINAL_VM_Q308_Press_Releasevirgin media. FINAL_VM_Q308_Press_Release
virgin media. FINAL_VM_Q308_Press_Release
 
virgin media. FINAL_VM_Q308_Press_Release
virgin media. FINAL_VM_Q308_Press_Releasevirgin media. FINAL_VM_Q308_Press_Release
virgin media. FINAL_VM_Q308_Press_Release
 
Quarterly report (Q3) 2008
Quarterly report (Q3) 2008Quarterly report (Q3) 2008
Quarterly report (Q3) 2008
 
Présentation des résultats financiers Ericsson (Q3 2009)
Présentation des résultats financiers Ericsson (Q3 2009)Présentation des résultats financiers Ericsson (Q3 2009)
Présentation des résultats financiers Ericsson (Q3 2009)
 
Quarterly Earnings Nokia
Quarterly Earnings NokiaQuarterly Earnings Nokia
Quarterly Earnings Nokia
 
Electrolux Interim Report Q1 2009
Electrolux Interim Report Q1 2009Electrolux Interim Report Q1 2009
Electrolux Interim Report Q1 2009
 
Présentation des résultats financiers Sony Ericsson (Q2 2010)
  Présentation des résultats financiers Sony Ericsson (Q2 2010)  Présentation des résultats financiers Sony Ericsson (Q2 2010)
Présentation des résultats financiers Sony Ericsson (Q2 2010)
 
Enel 1 Q 2009 Results May 12 2009
Enel 1 Q 2009 Results   May 12 2009Enel 1 Q 2009 Results   May 12 2009
Enel 1 Q 2009 Results May 12 2009
 
1 q09 presentation
1 q09 presentation1 q09 presentation
1 q09 presentation
 
1 q09 presentation
1 q09 presentation1 q09 presentation
1 q09 presentation
 
Q1 2009 Earning Report of Comcast Corp.
Q1 2009 Earning Report of Comcast Corp.Q1 2009 Earning Report of Comcast Corp.
Q1 2009 Earning Report of Comcast Corp.
 
virgin media. _q12008_final
virgin media. _q12008_finalvirgin media. _q12008_final
virgin media. _q12008_final
 
virgin media. _q12008_final
virgin media. _q12008_finalvirgin media. _q12008_final
virgin media. _q12008_final
 
Telecom Italia 3Q 2010 Results
Telecom Italia 3Q 2010 ResultsTelecom Italia 3Q 2010 Results
Telecom Italia 3Q 2010 Results
 
Press Release 3 Q02 Tele Celular Sul En
Press Release 3 Q02   Tele Celular Sul EnPress Release 3 Q02   Tele Celular Sul En
Press Release 3 Q02 Tele Celular Sul En
 
Third Quarter 2009 Financial Results
Third Quarter 2009 Financial ResultsThird Quarter 2009 Financial Results
Third Quarter 2009 Financial Results
 
Q2 presentation
Q2 presentation Q2 presentation
Q2 presentation
 
virgin media. FINAL_VM_Q208_Press_Release
virgin media. FINAL_VM_Q208_Press_Releasevirgin media. FINAL_VM_Q208_Press_Release
virgin media. FINAL_VM_Q208_Press_Release
 
virgin media. FINAL_VM_Q208_Press_Release
virgin media. FINAL_VM_Q208_Press_Releasevirgin media. FINAL_VM_Q208_Press_Release
virgin media. FINAL_VM_Q208_Press_Release
 

Dernier

What is DBT - The Ultimate Data Build Tool.pdf
What is DBT - The Ultimate Data Build Tool.pdfWhat is DBT - The Ultimate Data Build Tool.pdf
What is DBT - The Ultimate Data Build Tool.pdfMounikaPolabathina
 
The Fit for Passkeys for Employee and Consumer Sign-ins: FIDO Paris Seminar.pptx
The Fit for Passkeys for Employee and Consumer Sign-ins: FIDO Paris Seminar.pptxThe Fit for Passkeys for Employee and Consumer Sign-ins: FIDO Paris Seminar.pptx
The Fit for Passkeys for Employee and Consumer Sign-ins: FIDO Paris Seminar.pptxLoriGlavin3
 
From Family Reminiscence to Scholarly Archive .
From Family Reminiscence to Scholarly Archive .From Family Reminiscence to Scholarly Archive .
From Family Reminiscence to Scholarly Archive .Alan Dix
 
Moving Beyond Passwords: FIDO Paris Seminar.pdf
Moving Beyond Passwords: FIDO Paris Seminar.pdfMoving Beyond Passwords: FIDO Paris Seminar.pdf
Moving Beyond Passwords: FIDO Paris Seminar.pdfLoriGlavin3
 
Passkey Providers and Enabling Portability: FIDO Paris Seminar.pptx
Passkey Providers and Enabling Portability: FIDO Paris Seminar.pptxPasskey Providers and Enabling Portability: FIDO Paris Seminar.pptx
Passkey Providers and Enabling Portability: FIDO Paris Seminar.pptxLoriGlavin3
 
Assure Ecommerce and Retail Operations Uptime with ThousandEyes
Assure Ecommerce and Retail Operations Uptime with ThousandEyesAssure Ecommerce and Retail Operations Uptime with ThousandEyes
Assure Ecommerce and Retail Operations Uptime with ThousandEyesThousandEyes
 
2024 April Patch Tuesday
2024 April Patch Tuesday2024 April Patch Tuesday
2024 April Patch TuesdayIvanti
 
Genislab builds better products and faster go-to-market with Lean project man...
Genislab builds better products and faster go-to-market with Lean project man...Genislab builds better products and faster go-to-market with Lean project man...
Genislab builds better products and faster go-to-market with Lean project man...Farhan Tariq
 
(How to Program) Paul Deitel, Harvey Deitel-Java How to Program, Early Object...
(How to Program) Paul Deitel, Harvey Deitel-Java How to Program, Early Object...(How to Program) Paul Deitel, Harvey Deitel-Java How to Program, Early Object...
(How to Program) Paul Deitel, Harvey Deitel-Java How to Program, Early Object...AliaaTarek5
 
Manual 508 Accessibility Compliance Audit
Manual 508 Accessibility Compliance AuditManual 508 Accessibility Compliance Audit
Manual 508 Accessibility Compliance AuditSkynet Technologies
 
Potential of AI (Generative AI) in Business: Learnings and Insights
Potential of AI (Generative AI) in Business: Learnings and InsightsPotential of AI (Generative AI) in Business: Learnings and Insights
Potential of AI (Generative AI) in Business: Learnings and InsightsRavi Sanghani
 
Generative Artificial Intelligence: How generative AI works.pdf
Generative Artificial Intelligence: How generative AI works.pdfGenerative Artificial Intelligence: How generative AI works.pdf
Generative Artificial Intelligence: How generative AI works.pdfIngrid Airi González
 
Long journey of Ruby standard library at RubyConf AU 2024
Long journey of Ruby standard library at RubyConf AU 2024Long journey of Ruby standard library at RubyConf AU 2024
Long journey of Ruby standard library at RubyConf AU 2024Hiroshi SHIBATA
 
[Webinar] SpiraTest - Setting New Standards in Quality Assurance
[Webinar] SpiraTest - Setting New Standards in Quality Assurance[Webinar] SpiraTest - Setting New Standards in Quality Assurance
[Webinar] SpiraTest - Setting New Standards in Quality AssuranceInflectra
 
Why device, WIFI, and ISP insights are crucial to supporting remote Microsoft...
Why device, WIFI, and ISP insights are crucial to supporting remote Microsoft...Why device, WIFI, and ISP insights are crucial to supporting remote Microsoft...
Why device, WIFI, and ISP insights are crucial to supporting remote Microsoft...panagenda
 
Generative AI for Technical Writer or Information Developers
Generative AI for Technical Writer or Information DevelopersGenerative AI for Technical Writer or Information Developers
Generative AI for Technical Writer or Information DevelopersRaghuram Pandurangan
 
The Future Roadmap for the Composable Data Stack - Wes McKinney - Data Counci...
The Future Roadmap for the Composable Data Stack - Wes McKinney - Data Counci...The Future Roadmap for the Composable Data Stack - Wes McKinney - Data Counci...
The Future Roadmap for the Composable Data Stack - Wes McKinney - Data Counci...Wes McKinney
 
A Journey Into the Emotions of Software Developers
A Journey Into the Emotions of Software DevelopersA Journey Into the Emotions of Software Developers
A Journey Into the Emotions of Software DevelopersNicole Novielli
 
The State of Passkeys with FIDO Alliance.pptx
The State of Passkeys with FIDO Alliance.pptxThe State of Passkeys with FIDO Alliance.pptx
The State of Passkeys with FIDO Alliance.pptxLoriGlavin3
 
Transcript: New from BookNet Canada for 2024: Loan Stars - Tech Forum 2024
Transcript: New from BookNet Canada for 2024: Loan Stars - Tech Forum 2024Transcript: New from BookNet Canada for 2024: Loan Stars - Tech Forum 2024
Transcript: New from BookNet Canada for 2024: Loan Stars - Tech Forum 2024BookNet Canada
 

Dernier (20)

What is DBT - The Ultimate Data Build Tool.pdf
What is DBT - The Ultimate Data Build Tool.pdfWhat is DBT - The Ultimate Data Build Tool.pdf
What is DBT - The Ultimate Data Build Tool.pdf
 
The Fit for Passkeys for Employee and Consumer Sign-ins: FIDO Paris Seminar.pptx
The Fit for Passkeys for Employee and Consumer Sign-ins: FIDO Paris Seminar.pptxThe Fit for Passkeys for Employee and Consumer Sign-ins: FIDO Paris Seminar.pptx
The Fit for Passkeys for Employee and Consumer Sign-ins: FIDO Paris Seminar.pptx
 
From Family Reminiscence to Scholarly Archive .
From Family Reminiscence to Scholarly Archive .From Family Reminiscence to Scholarly Archive .
From Family Reminiscence to Scholarly Archive .
 
Moving Beyond Passwords: FIDO Paris Seminar.pdf
Moving Beyond Passwords: FIDO Paris Seminar.pdfMoving Beyond Passwords: FIDO Paris Seminar.pdf
Moving Beyond Passwords: FIDO Paris Seminar.pdf
 
Passkey Providers and Enabling Portability: FIDO Paris Seminar.pptx
Passkey Providers and Enabling Portability: FIDO Paris Seminar.pptxPasskey Providers and Enabling Portability: FIDO Paris Seminar.pptx
Passkey Providers and Enabling Portability: FIDO Paris Seminar.pptx
 
Assure Ecommerce and Retail Operations Uptime with ThousandEyes
Assure Ecommerce and Retail Operations Uptime with ThousandEyesAssure Ecommerce and Retail Operations Uptime with ThousandEyes
Assure Ecommerce and Retail Operations Uptime with ThousandEyes
 
2024 April Patch Tuesday
2024 April Patch Tuesday2024 April Patch Tuesday
2024 April Patch Tuesday
 
Genislab builds better products and faster go-to-market with Lean project man...
Genislab builds better products and faster go-to-market with Lean project man...Genislab builds better products and faster go-to-market with Lean project man...
Genislab builds better products and faster go-to-market with Lean project man...
 
(How to Program) Paul Deitel, Harvey Deitel-Java How to Program, Early Object...
(How to Program) Paul Deitel, Harvey Deitel-Java How to Program, Early Object...(How to Program) Paul Deitel, Harvey Deitel-Java How to Program, Early Object...
(How to Program) Paul Deitel, Harvey Deitel-Java How to Program, Early Object...
 
Manual 508 Accessibility Compliance Audit
Manual 508 Accessibility Compliance AuditManual 508 Accessibility Compliance Audit
Manual 508 Accessibility Compliance Audit
 
Potential of AI (Generative AI) in Business: Learnings and Insights
Potential of AI (Generative AI) in Business: Learnings and InsightsPotential of AI (Generative AI) in Business: Learnings and Insights
Potential of AI (Generative AI) in Business: Learnings and Insights
 
Generative Artificial Intelligence: How generative AI works.pdf
Generative Artificial Intelligence: How generative AI works.pdfGenerative Artificial Intelligence: How generative AI works.pdf
Generative Artificial Intelligence: How generative AI works.pdf
 
Long journey of Ruby standard library at RubyConf AU 2024
Long journey of Ruby standard library at RubyConf AU 2024Long journey of Ruby standard library at RubyConf AU 2024
Long journey of Ruby standard library at RubyConf AU 2024
 
[Webinar] SpiraTest - Setting New Standards in Quality Assurance
[Webinar] SpiraTest - Setting New Standards in Quality Assurance[Webinar] SpiraTest - Setting New Standards in Quality Assurance
[Webinar] SpiraTest - Setting New Standards in Quality Assurance
 
Why device, WIFI, and ISP insights are crucial to supporting remote Microsoft...
Why device, WIFI, and ISP insights are crucial to supporting remote Microsoft...Why device, WIFI, and ISP insights are crucial to supporting remote Microsoft...
Why device, WIFI, and ISP insights are crucial to supporting remote Microsoft...
 
Generative AI for Technical Writer or Information Developers
Generative AI for Technical Writer or Information DevelopersGenerative AI for Technical Writer or Information Developers
Generative AI for Technical Writer or Information Developers
 
The Future Roadmap for the Composable Data Stack - Wes McKinney - Data Counci...
The Future Roadmap for the Composable Data Stack - Wes McKinney - Data Counci...The Future Roadmap for the Composable Data Stack - Wes McKinney - Data Counci...
The Future Roadmap for the Composable Data Stack - Wes McKinney - Data Counci...
 
A Journey Into the Emotions of Software Developers
A Journey Into the Emotions of Software DevelopersA Journey Into the Emotions of Software Developers
A Journey Into the Emotions of Software Developers
 
The State of Passkeys with FIDO Alliance.pptx
The State of Passkeys with FIDO Alliance.pptxThe State of Passkeys with FIDO Alliance.pptx
The State of Passkeys with FIDO Alliance.pptx
 
Transcript: New from BookNet Canada for 2024: Loan Stars - Tech Forum 2024
Transcript: New from BookNet Canada for 2024: Loan Stars - Tech Forum 2024Transcript: New from BookNet Canada for 2024: Loan Stars - Tech Forum 2024
Transcript: New from BookNet Canada for 2024: Loan Stars - Tech Forum 2024
 

Nokia 2009 Üçüncü Çeyrek

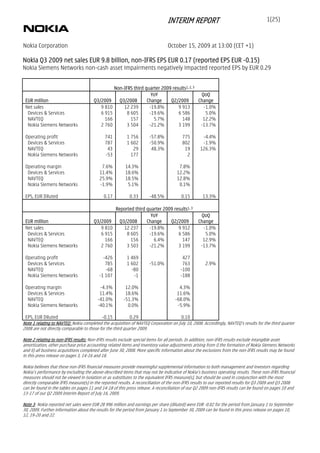
  • 1. INTERIM REPORT 1(25) Nokia Corporation October 15, 2009 at 13:00 (CET +1) Nokia Q3 2009 net sales EUR 9.8 billion, non-IFRS EPS EUR 0.17 (reported EPS EUR -0.15) Nokia Siemens Networks non-cash asset impairments negatively impacted reported EPS by EUR 0.29 Non-IFRS third quarter 2009 results1, 2, 3 YoY QoQ EUR million Q3/2009 Q3/2008 Change Q2/2009 Change Net sales 9 810 12 239 -19.8% 9 913 -1.0% Devices & Services 6 915 8 605 -19.6% 6 586 5.0% NAVTEQ 166 157 5.7% 148 12.2% Nokia Siemens Networks 2 760 3 504 -21.2% 3 199 -13.7% Operating profit 741 1 756 -57.8% 775 -4.4% Devices & Services 787 1 602 -50.9% 802 -1.9% NAVTEQ 43 29 48.3% 19 126.3% Nokia Siemens Networks -53 177 2 Operating margin 7.6% 14.3% 7.8% Devices & Services 11.4% 18.6% 12.2% NAVTEQ 25.9% 18.5% 12.8% Nokia Siemens Networks -1.9% 5.1% 0.1% EPS, EUR Diluted 0.17 0.33 -48.5% 0.15 13.3% Reported third quarter 2009 results1, 3 YoY QoQ EUR million Q3/2009 Q3/2008 Change Q2/2009 Change Net sales 9 810 12 237 -19.8% 9 912 -1.0% Devices & Services 6 915 8 605 -19.6% 6 586 5.0% NAVTEQ 166 156 6.4% 147 12.9% Nokia Siemens Networks 2 760 3 503 -21.2% 3 199 -13.7% Operating profit -426 1 469 427 Devices & Services 785 1 602 -51.0% 763 2.9% NAVTEQ -68 -80 -100 Nokia Siemens Networks -1 107 -1 -188 Operating margin -4.3% 12.0% 4.3% Devices & Services 11.4% 18.6% 11.6% NAVTEQ -41.0% -51.3% -68.0% Nokia Siemens Networks -40.1% 0.0% -5.9% EPS, EUR Diluted -0.15 0.29 0.10 Note 1 relating to NAVTEQ: Nokia completed the acquisition of NAVTEQ Corporation on July 10, 2008. Accordingly, NAVTEQ's results for the third quarter 2008 are not directly comparable to those for the third quarter 2009. Note 2 relating to non-IFRS results: Non-IFRS results exclude special items for all periods. In addition, non-IFRS results exclude intangible asset amortization, other purchase price accounting related items and inventory value adjustments arising from i) the formation of Nokia Siemens Networks and ii) all business acquisitions completed after June 30, 2008. More specific information about the exclusions from the non-IFRS results may be found in this press release on pages 3, 14-16 and 18. Nokia believes that these non-IFRS financial measures provide meaningful supplemental information to both management and investors regarding Nokia’s performance by excluding the above-described items that may not be indicative of Nokia’s business operating results. These non-IFRS financial measures should not be viewed in isolation or as substitutes to the equivalent IFRS measure(s), but should be used in conjunction with the most directly comparable IFRS measure(s) in the reported results. A reconciliation of the non-IFRS results to our reported results for Q3 2009 and Q3 2008 can be found in the tables on pages 11 and 14-18 of this press release. A reconciliation of our Q2 2009 non-IFRS results can be found on pages 10 and 13-17 of our Q2 2009 Interim Report of July 16, 2009. Note 3: Nokia reported net sales were EUR 28 996 million and earnings per share (diluted) were EUR -0.02 for the period from January 1 to September 30, 2009. Further information about the results for the period from January 1 to September 30, 2009 can be found in this press release on pages 10, 12, 19-20 and 22.
  • 2. INTERIM REPORT 2(25) Nokia Corporation October 15, 2009 at 13:00 (CET +1) THIRD QUARTER 2009 HIGHLIGHTS - Nokia net sales of EUR 9.8 billion, down 20% year on year and down 1% sequentially (down 19% and flat at constant currency). - Devices & Services net sales of EUR 6.9 billion, down 20% year on year and up 5% sequentially (down 20% and up 6% at constant currency), and non-IFRS operating margin of 11.4% (18.6% in Q3 2008 and 12.2% in Q2 2009). - Devices & Services gross margin of 30.9%, down from 34.0% in Q2 2009. - Services net sales of EUR 148 million (billings of EUR 172 million). Due to the divestment of the security appliance business in April 2009, services net sales are not directly comparable to prior periods. - Estimated industry mobile device volumes of 288 million units, down 7% year on year and up 7% sequentially. - Nokia mobile device volumes of 108.5 million units, down 8% year on year and up 5% sequentially. - Nokia estimated mobile device market share of 38% in Q3 2009, at the same level as in Q3 2008 and in Q2 2009. - Nokia mobile device ASP of EUR 62, at the same level as in Q2 2009. - NAVTEQ non-IFRS net sales of EUR 166 million, up 6% year on year and up 12% sequentially, and non-IFRS operating margin of 25.9% (18.5% in Q3 2008). - Nokia Siemens Networks net sales of EUR 2.8 billion, down 21% year on year and down 14% sequentially (down 20% and down 14% at constant currency), and non-IFRS operating margin of -1.9% (5.1% in Q3 2008). - Nokia operating cash flow of EUR 720 million. - Total cash and other liquid assets of EUR 7.4 billion at the end of Q3 2009. - Nokia taxes were favorably impacted by country profit mix as well as prior year tax benefits. If Nokia’s estimated long-term tax rate of 26% had been applied, non-IFRS EPS would have been approximately 2 Euro cents lower. OLLI-PEKKA KALLASVUO, NOKIA CEO: “The demand for mobile devices improved in many markets during Q3. With the average selling price of our devices holding firm quarter-on-quarter, our higher device volumes translated into increased net sales in our Devices & Services business. Our volumes and net sales were, however, somewhat constrained by component shortages we encountered across the portfolio. I also want to highlight the good operating expense management that helped the segment deliver solid earnings. The challenging competitive factors and market conditions in the infrastructure and related services business necessitated non-cash impairment charges at Nokia Siemens Networks. We continue to support Nokia Siemens Networks actions to improve its performance.” INDUSTRY AND NOKIA OUTLOOK - Nokia expects industry mobile device volumes in the fourth quarter 2009 to be up sequentially. - Nokia expects its mobile device market share in the fourth quarter 2009 to be approximately at the same level sequentially. - Nokia expects industry mobile device volumes to be approximately 1.12 billion units in 2009, down approximately 7% from approximately 1.21 billion units Nokia estimated for 2008. This is an update to Nokia’s earlier estimate of industry mobile device volumes declining approximately 10% in 2009 from 2008 levels. - Nokia expects its non-IFRS operating margin in Devices & Services in the fourth quarter 2009 to be up by one percentage point or more sequentially. – Nokia and Nokia Siemens Networks now expect the mobile infrastructure and fixed infrastructure and related services market to decline approximately 5% in Euro terms in 2009, from 2008 levels. This is an update to Nokia and Nokia Siemens Networks earlier expected decline of approximately 10%. – Nokia and Nokia Siemens Networks also now expect that Nokia Siemens Networks market share will decline by more than previously expected in 2009, compared with 2008. This is an update to Nokia and Nokia Siemens Networks earlier expected moderate decline. Nokia and Nokia Siemens Networks continue to see strong performance in its Services business unit expected to be offset by declines in certain product businesses.
  • 3. INTERIM REPORT 3(25) Nokia Corporation October 15, 2009 at 13:00 (CET +1) THIRD QUARTER 2009 FINANCIAL HIGHLIGHTS (Comparisons are given to the third quarter 2008, unless otherwise indicated.) The non-IFRS results exclusions Q3 2009 — EUR 1 167 million consisting of: – EUR 908 million impairment of goodwill in Nokia Siemens Networks – EUR 29 million restructuring charge and other one-time items in Nokia Siemens Networks – EUR 117 million of intangible assets amortization and other purchase price related items arising from the formation of Nokia Siemens Networks – EUR 111 million of intangible assets amortization and other purchase price related items arising from the acquisition of NAVTEQ – EUR 2 million of intangible assets amortization and other purchase price related items arising from the acquisition of OZ Communications in Devices & Services Q3 2009 taxes — EUR 432 million valuation allowance for Nokia Siemens Networks deferred tax assets impacting Nokia taxes Q2 2009 — EUR 348 million (net) consisting of: – EUR 22 million of impairment of intangible assets in Devices & Services – EUR 83 million restructuring charge in Devices & Services – EUR 68 million gain on sale of security appliance business in Devices & Services – EUR 69 million restructuring charge and other one-time items in Nokia Siemens Networks – EUR 121 million of intangible assets amortization and other purchase price related items arising from the formation of Nokia Siemens Networks – EUR 119 million of intangible assets amortization and other purchase price related items arising from the acquisition of NAVTEQ – EUR 2 million of intangible assets amortization and other purchase price related items arising from the acquisition of OZ Communications in Devices & Services Q3 2008 — EUR 287 million consisting of: - EUR 59 million restructuring charge and other one-time items in Nokia Siemens Networks - EUR 119 million of intangible asset amortization and other purchase price accounting related items arising from the formation of Nokia Siemens Networks - EUR 109 million of intangible asset amortization and other purchase price accounting related items arising from the acquisition of NAVTEQ Non-IFRS results exclude special items for all periods. In addition, non-IFRS results exclude intangible asset amortization, other purchase price accounting related items and inventory value adjustments arising from i) the formation of Nokia Siemens Networks and ii) all business acquisitions completed after June 30, 2008. Nokia Group Nokia's third quarter 2009 net sales decreased 20% to EUR 9.8 billion, compared with EUR 12.2 billion in the third quarter 2008. At constant currency, Group net sales would have decreased 19% year on year. The following chart sets out the year on year and sequential growth rates in our net sales on a reported basis and at constant currency for the periods indicated.
  • 4. INTERIM REPORT 4(25) Nokia Corporation October 15, 2009 at 13:00 (CET +1) NOKIA THIRD QUARTER 2009 NET SALES, REPORTED & CONSTANT CURRENCY1 Q3/2009 vs. Q3/2009 vs. Q3/2008 Q2/2009 Change Change Group net sales – reported -20% -1% Group net sales - constant currency1 -19% 0% Devices & Services net sales – reported -20% 5% Devices & Services net sales - constant currency1 -20% 6% Nokia Siemens Networks net sales – reported -21% -14% Nokia Siemens Networks net sales - constant currency1 -20% -14% Note 1: Change in net sales at constant currency excludes the impact of changes in exchange rates in comparison to the Euro, our reporting currency. Nokia’s third quarter 2009 reported operating loss was EUR 426 million, compared with an operating profit of EUR 1.5 billion in the third quarter 2008. Nokia’s third quarter 2009 non-IFRS operating profit decreased 58% to EUR 741 million, compared with EUR 1.8 billion in the third quarter 2008. Nokia’s third quarter 2009 reported operating margin was -4.3% (12.0%). Nokia’s third quarter 2009 non-IFRS operating margin was 7.6% (14.3%). Operating cash flow for the third quarter 2009 was EUR 720 million, compared with EUR 1.3 billion in the third quarter 2008. Total cash and other liquid assets were EUR 7.4 billion at September 30, 2009, compared with EUR 7.2 billion at September 30, 2008. At September 30, 2009, Nokia’s net debt-equity ratio (gearing) was –15%, compared with -18% at September 30, 2008. Devices & Services In the third quarter 2009, the total mobile device volumes of our Devices & Services group were 108.5 million units, representing a decline of 8% year on year and a 5% increase sequentially. The overall industry mobile device volumes for the same period were 288 million units based on Nokia’s preliminary estimate, representing a 7% year on year decrease and a 7% sequential increase. The lower device volumes year on year for Nokia and the industry continued to be driven by the negative impact of the deteriorated global economic conditions. The sequential industry device volume increase primarily reflected an improved demand environment for mobile devices. In addition, Nokia’s device volumes for the third quarter 2009 were somewhat constrained by component shortages across the portfolio, which are expected to continue to some degree in the fourth quarter 2009. Of the total industry mobile device volumes, converged mobile device industry volumes in the third quarter 2009 were 47.0 million units, based on Nokia’s preliminary estimate, compared with an estimated 44.2 million units in the third quarter 2008 and 41.0 million units in the second quarter 2009. Our own converged mobile device volumes were 16.4 million units in the third quarter 2009, compared with 15.5 million units in the third quarter 2008 and 16.9 million units in the second quarter 2009. Nokia’s share of the converged mobile device market was an estimated 35% in the third quarter 2009, at the same level as in the third quarter 2008 and down from 41% in the second quarter 2009. We shipped 4.5 million Nokia Nseries and 4.4 million Nokia Eseries devices during the third quarter 2009, down from the combined 9.3 million Nseries and Eseries devices we shipped in the second quarter 2009. The following chart sets out our mobile device volumes for the periods indicated, as well as the year on year and sequential growth rates, by geographic area.
  • 5. INTERIM REPORT 5(25) Nokia Corporation October 15, 2009 at 13:00 (CET +1) NOKIA MOBILE DEVICE VOLUME BY GEOGRAPHIC AREA (million units) Q3/2009 Q3/2008 YoY Change Q2/2009 QoQ Change Europe 27.1 27.4 -1.1% 23.3 16.3% Middle East & Africa 19.6 21.5 -8.8% 18.9 3.7% Greater China 18.5 19.8 -6.6% 18.6 -0.5% Asia-Pacific 30.5 33.6 -9.2% 30.3 0.7% North America 3.1 4.5 -31.1% 3.2 -3.1% Latin America 9.7 11.0 -11.8% 8.9 9.0% Total 108.5 117.8 -7.9% 103.2 5.1% Based on our preliminary market estimate, Nokia’s mobile device market share for the third quarter 2009 was 38%, compared with 38% in the third quarter 2008 and in the second quarter 2009. Our year on year market share was higher in Europe, Latin America and Middle East & Africa. This was offset by lower market share in Greater China, Asia-Pacific and North America. Sequentially, our market share declined in Greater China, Asia- Pacific, Middle East & Africa and North America, but was offset by our increased market share in Europe and Latin America. Our mobile device average selling price (ASP) in the third quarter 2009 was EUR 62, down from EUR 72 in the third quarter 2008 and at the same level as in the second quarter 2009. The year on year decline was primarily due to a higher proportion of sales of lower priced products as well as general price pressure. Sequentially, our ASP benefited from new product shipments, offset however by general price pressure. Third quarter 2009 Devices & Services net sales declined 20% to EUR 6.9 billion, compared with EUR 8.6 billion in the third quarter 2008. Devices & Services net sales were down year on year in all geographic areas. At constant currency, Devices & Services net sales would have decreased 20%. The net sales decline resulted primarily from lower volumes, combined with the ASP decline, compared with the third quarter 2008. Of our total Devices & Services net sales, services contributed EUR 148 million in the third quarter 2009, representing 29% year on year growth and a 6% sequential growth. Nokia completed the divestment of its security appliances business in April 2009 and accordingly services net sales for the third and second quarter 2009 as well as for the prior periods are not directly comparable. Beginning with the third quarter 2009, we are providing additional sequential comparative information for our Devices & Services business to reflect our product and solutions mode of operation and performance. We are now providing total net sales for Devices & Services divided into (i) net sales from smartphones and mobile computer solutions; that is, net sales of converged mobile devices, including the services and accessories sold with them, and (ii) net sales from mobile phones and embedded services; that is, net sales of Series 30 and Series 40-powered devices, including the services and accessories sold with them. We are also providing ASPs for each of these two categories of sales. Net sales from smartphones and mobile computer solutions totaled EUR 3.1 billion in the third quarter 2009, at the same level as in the second quarter 2009. The ASP for smartphones and mobile computer solutions was EUR 190, up from EUR 182 in the second quarter 2009. Net sales from mobile phones and embedded services totaled EUR 3.8 billion in the third quarter 2009, compared with EUR 3.5 billion in the second quarter 2009. The ASP for mobile phones and embedded services was EUR 41, at the same level as in the second quarter 2009. Devices & Services reported gross profit and non-IFRS gross profit decreased 32% to EUR 2.1 billion, compared with EUR 3.1 billion in the third quarter 2008, with a reported and non-IFRS gross margin of 30.9% (36.5%). The year on year gross margin decrease was primarily due to higher cost of sales driven by a stronger Japanese Yen, as well as general price pressure.
  • 6. INTERIM REPORT 6(25) Nokia Corporation October 15, 2009 at 13:00 (CET +1) During the third quarter 2009, Devices & Services reported operating profit decreased 51% to EUR 785 million, compared with EUR 1.6 billion in the third quarter 2008, with a reported operating margin of 11.4% (18.6%). Devices & Services non-IFRS operating profit decreased 51% to EUR 787 million, compared with EUR 1.6 billion in the third quarter 2008, with a non-IFRS operating margin of 11.4% (18.6%). The year on year decrease in non-IFRS operating profit for the third quarter 2009 was due primarily to lower net sales and higher cost of sales compared with the third quarter 2008. These factors were somewhat mitigated by a reduction in our operating expenses, compared to the third quarter 2008. NAVTEQ (Nokia completed the acquisition of NAVTEQ Corporation on July 10, 2008. Accordingly, NAVTEQ's results for the third quarter 2008 are not directly comparable to those for the third quarter 2009.) Third quarter 2009 NAVTEQ net sales increased 6% to EUR 166 million, compared with EUR 156 million in the third quarter 2008. NAVTEQ reported gross profit was EUR 146 million (EUR 138 million), with a reported gross margin of 88.0% (88.5%). Non-IFRS gross profit was EUR 146 million (EUR 139 million), with a non-IFRS gross margin of 88.0% (88.5%). NAVTEQ had a reported operating loss of EUR 68 million (EUR 80 million loss). The reported operating margin was -41.0% (-51.3%). NAVTEQ non-IFRS operating profit was EUR 43 million (EUR 29 million), with a non-IFRS operating margin of 25.9% (18.5%). When Nokia assessed goodwill for impairment on its annual impairment testing date in the fourth quarter 2008, Nokia concluded that a reasonably possible change of 1% in the valuation assumptions for long-term growth rate and pre-tax discount rate would give rise to an impairment loss for NAVTEQ. Nokia conducted a review and update of the assumptions used in the 2008 annual impairment testing analysis and performed a sensitivity analysis on these assumptions to assess the recoverability of NAVTEQ. This assessment resulted in no indication of impairment for NAVTEQ. However, Nokia has once again concluded that a reasonably possible change of 1% in the valuation assumptions for long-term growth rate and pre-tax discount rate would give rise to an impairment loss for NAVTEQ. Nokia continues to evaluate the financial performance and future strategies of NAVTEQ as well as market and economic conditions to assess the recoverability of NAVTEQ’s carrying amount. Nokia will conduct its annual goodwill impairment testing in the fourth quarter 2009. Nokia Siemens Networks Third quarter 2009 net sales decreased 21% to EUR 2.8 billion, compared with EUR 3.5 billion in the third quarter 2008, reflecting challenging competitive factors and market conditions. At constant currency, Nokia Siemens Networks net sales would have decreased 20%. Of total Nokia Siemens Networks net sales, services contributed EUR 1.3 billion. The following chart sets out Nokia Siemens Networks net sales for the periods indicated, as well as the year on year and sequential growth rates, by geographic area. NOKIA SIEMENS NETWORKS NET SALES BY GEOGRAPHIC AREA EUR million Q3/2009 Q3/2008 YoY Change Q2/2009 QoQ Change Europe 1 062 1 358 -21.8% 1 209 -12.2% Middle East & Africa 387 424 -8.7% 459 -15.7% Greater China 335 288 16.3% 353 -5.1% Asia-Pacific 567 894 -36.6% 648 -12.5% North America 127 150 -15.3% 208 -38.9% Latin America 282 389 -27.5% 322 -12.4% Total 2 760 3 503 -21.2% 3 199 -13.7% Nokia Siemens Networks reported gross profit decreased 28% to EUR 778 million, compared with EUR 1.1 billion in the third quarter 2008, with a reported gross margin of 28.2% (30.8%). Nokia Siemens Networks non-IFRS gross
  • 7. INTERIM REPORT 7(25) Nokia Corporation October 15, 2009 at 13:00 (CET +1) profit decreased 27% to EUR 794 million, compared with EUR 1.1 billion in the third quarter 2008, with a non-IFRS gross margin of 28.8% (31.2%). The lower year on year non-IFRS gross profit in the third quarter 2009 was due primarily to lower year on year net sales. Nokia Siemens Networks had a third quarter 2009 reported operating loss of EUR 1 107 million, compared with an operating loss of EUR 1 million in the third quarter 2008, with an operating margin of -40.1% (0.0%). The operating loss in the third quarter 2009 was primarily driven by the EUR 908 million impairment of goodwill. Nokia Siemens Networks non-IFRS operating loss was EUR 53 million in the third quarter 2009, compared with a non- IFRS operating profit of EUR 177 million in the third quarter 2008, with a non-IFRS operating margin of -1.9% (5.1%). The year on year decline in Nokia Siemens Networks non-IFRS operating profit primarily reflected lower net sales. Nokia recorded a charge to operating profit in the third quarter 2009 of EUR 908 million for the impairment of goodwill in Nokia Siemens Networks. After the impairment charge Nokia no longer carries any goodwill with regard to Nokia Siemens Networks. An additional charge of EUR 432 million was recorded to tax expense to provide a valuation allowance on Nokia Siemens Networks’ deferred tax assets. The net impact of the asset impairment charges after minority interest totaled EUR 1 072 million, negatively impacting reported EPS by EUR 0.29. The recoverability of the investment in Nokia Siemens Networks has declined as a result of the decline in forecasted profits and cash flows. The asset impairment charges are the result of an evaluation of the historical and projected financial performance of Nokia Siemens Networks, taking into consideration the challenging competitive factors and market conditions in the infrastructure and related services business, which have resulted in lower net sales projections and which, in turn, have reduced the projected scale and thus negatively impacted projected margins and profitability. The recognition of a valuation allowance does not impact the validity of the deferred tax assets and Nokia Siemens Networks retains the possibility of recovering these assets if sufficient future taxable profits become available. Q3 2009 OPERATING HIGHLIGHTS – Nokia announced the formation of Solutions, a new unit responsible for driving Nokia’s offering of solutions, with the aim of integrating the mobile device, services and content into a unique and compelling offering for the consumer. The unit formally started operating on October 1, 2009. – Nokia announced changes to its Group Executive Board, with Robert Andersson leaving Nokia’s Group Executive Board as of September 30, 2009 in connection with his transfer to new duties in Nokia’s Corporate Development unit from October 1, 2009; Alberto Torres joining Nokia’s Group Executive Board as of October 1, 2009 in connection with his appointment as head of Solutions, and; Simon Beresford-Wylie leaving the Group Executive Board on September 30, 2009 after stepping down as Chief Executive Officer of Nokia Siemens Networks. – Nokia announced that Rajeev Suri had been appointed as Chief Executive Officer of Nokia Siemens Networks as of October 1, 2009. – Nokia was named as the world's most sustainable technology company according to the 2009-10 edition of the prestigious Dow Jones Sustainability Indexes that went live during September. Already rated for several years as the leader within the Europe and Communications categories, this year Nokia was also chosen as “World Technology Supersector Leader” making it number one across the entire global technology sector. – Nokia announced that a United States International Trade Commission (ITC) judge issued an Initial Determination in favor of Nokia in the action brought by InterDigital against Nokia. The judge's Initial Determination is consistent with a previous judgment in the United Kingdom that found several InterDigital patents not to be essential to the UMTS mobile standard.
  • 8. INTERIM REPORT 8(25) Nokia Corporation October 15, 2009 at 13:00 (CET +1) Devices & Services - Nokia acquired certain assets of cellity, a mobile software company that has developed a solution for aggregating address book data, as well as certain assets of Plum Ventures, Inc, a privately held company that develops and operates a cloud-based social media sharing and messaging service for private groups. Nokia also acquired Dopplr Oy, a privately-held mobile service provider for international travelers. All three acquisitions enable Nokia to accelerate the delivery of Ovi services and bring additional internet services talent to its Services unit. - Nokia announced Nokia Money, a new mobile financial service giving mobile device users access to basic financial services. The service is to be rolled out gradually to selected markets in early 2010 and will be operated in cooperation with Obopay, a leading developer of mobile payment solutions in which Nokia invested earlier this year. - Nokia announced a global alliance with Microsoft to design and market a suite of productivity applications for Nokia's range of Symbian smartphones, starting with Nokia’s business-optimized Eseries range of devices. - Nokia announced the Nokia N900, a handset that delivers computer-grade performance in a compact QWERTY and touch form factor. The Nokia N900 runs on Maemo, a desktop PC-like software architecture based on the open source Linux software. - Nokia announced the Nokia Booklet 3G, a new Windows 7-based mini-laptop. The Nokia Booklet 3G is encased in an ultra-portable aluminum chassis, runs for up to 12 hours on a single charge and has a broad range of connectivity options. - Nokia announced the Nokia N97 mini, a companion to the Nokia N97. The Nokia N97 mini will be the first device to feature Ovi lifecasting, an application developed together with Facebook that enables people for the first time to publish their location and status updates directly to their Facebook account from the home screen of a mobile device. - Nokia announced the Nokia X6, a powerful entertainment device with 32GB of on-board memory that, in select markets, will be available in combination with Comes With Music, Nokia’s ‘all-you-can-eat-music’ offering. Nokia also announced the Nokia X3, an affordable music device and the first Series 40-powered device enabled for Ovi Store, Nokia’s store for applications and content. - Nokia announced the Nokia 5230, an affordable touch smartphone that, in select markets, will also be available in combination with Comes With Music. - Nokia launched Comes With Music in Austria, the Netherlands and South Africa during the quarter, with the offering now available on 17 Nokia devices across 12 countries altogether. Additionally, Nokia launched Nokia Music Store in India during the quarter, with the chain of digital music stores now localized for 22 countries. - Nokia announced the Nokia 5800 Navigation Edition, a touch handset preloaded with a lifetime of voice- guided Drive and Walk navigation licenses for the user’s region. - Nokia announced and commenced shipments of the Nokia 3720 classic, a rugged handset designed to resist water, dust and shock. - Nokia Messaging, Nokia’s consumer email service, continued to gain traction among operators with six new agreements announced during the quarter. Nokia Messaging is now available to Nokia users in more than 50 countries and approximately 1 million users are now registered. Additionally, more than 2 million people have now activated an Ovi Mail account. Ovi Mail is an email solution developed especially for consumers in emerging markets. - Nokia announced the Ovi SDK Beta, the Ovi Maps Player API for mobile and Ovi Navigation Player API, enabling the creation of rich applications for the web as well as the Symbian and Maemo platforms, and which will be distributed through the Ovi Store. Ovi developer tools are a key focus area as we continue to expand our services offering for consumers and create opportunities for developers and content providers. NAVTEQ – NAVTEQ announced the European availability of Motorway Junction Objects, which enables navigation systems to display full 3D animation of complex junctions, with coverage of over 6 000 locations. – NAVTEQ significantly increased major city coverage for its India map, now encompassing 84 cities.
  • 9. INTERIM REPORT 9(25) Nokia Corporation October 15, 2009 at 13:00 (CET +1) – NAVTEQ announced that NAVTEQ Discover Cities™ reached a global pedestrian navigation milestone of 100 cities with the addition of Johannesburg. – NAVTEQ acquired Acuity, a US-based company with a leading mobile location-based advertising delivery platform. The acquisition underscores NAVTEQ’s commitment to and investment in location-based advertising technology and solutions. – NAVTEQ launched real time traffic in 11 European countries and expanded NAVTEQ Traffic Patterns™ to 9 European countries. – NAVTEQ announced the integration of Nokia GPS data for availability in NAVTEQ traffic products in North America and Europe. – NAVTEQ along with Nokia and Magnetti Marelli announced innovative technology to integrate smartphones into car infotainment systems. – NAVTEQ announced that Nextar selected NAVTEQ Location Point™ to offer their consumers a lifetime of free traffic supported by targeted location-based advertising. Nokia Siemens Networks – Globe Telecommunications, one of the leading communication service providers in the Philippines can now offer Web 2.0 services and roll out new promotional service packages up to 10 times faster than before after Nokia Siemens Networks, in collaboration with IBM, implemented a Service Delivery Framework for the operator, which offers an agile and efficient service creation environment, and reduces the time to market for new services. – Nokia Siemens Networks in September made the world’s first LTE call using commercial base station and fully standard compliant, commercial software. The successful demonstration, as well as the fact that Nokia Siemens Networks had delivered LTE-compatible Flexi Base Station hardware to over 100 customers by end September, illustrates the readiness of Nokia Siemens Networks’ products for early commercial deployments worldwide. – Nokia Siemens Networks continued to make inroads in North America with a 3G network roll out deal in Canada for Globalive Wireless that includes a services-led turnkey deal for the implementation, maintenance, design and service assurance as well as a system-led deal for the WCDMA network. – Nokia Siemens Networks won a number of other key 3G deals in the quarter including a contract with Megafon in Russia as the main supplier for the extension of its 3G radio network, and deals with Viettel in Vietnam, Hutchison 3G Austria, Nuevatel in Bolivia, T-Mobile in the Czech Republic and Hutchison Telecom in Hong Kong. – In fixed line, Nokia Siemens Networks was appointed by Belgacom International Carrier Services to upgrade its optical network transmission capacity from 10 Gigabit per second (Gbps) per wavelength to 40 Gbps. Other deals included an upgrade for České Radiokomunikace for data rates of up to 10 Gbps and a 4 000 km extension of a nationwide fiber backbone network for Zain Nigeria. – Nokia Siemens Networks demonstrated DSL with download speeds of 25 Mbps at a distance of up to 1 500 meters from the local exchange at Broadband World Forum in Paris with its VDSL2 bonding solution. For more information on the operating highlights mentioned above, please refer to related press announcements at the following links: http://www.nokia.com/press, http://www.navteq.com/about/press.html, http://www.nokiasiemensnetworks.com/press NOKIA IN THE THIRD QUARTER 2009 (The following discussion is of Nokia's reported results. Comparisons are given to the third quarter 2008 results, unless otherwise indicated.) Nokia’s net sales decreased 20% to EUR 9 810 million (EUR 12 237 million). Net sales of Devices & Services decreased 20% to EUR 6 915 million (EUR 8 605 million). Net sales of NAVTEQ increased 6% to EUR 166 million (EUR 156 million). Net sales of Nokia Siemens Networks decreased 21% to EUR 2 760 million (EUR 3 503 million).
  • 10. INTERIM REPORT 10(25) Nokia Corporation October 15, 2009 at 13:00 (CET +1) Operating loss was EUR 426 million (compared with an operating profit of EUR 1 469 million), representing an operating margin of -4.3% (12.0%). Operating profit in Devices & Services decreased 51% to EUR 785 million (EUR 1 602 million), representing an operating margin of 11.4% (18.6%). Operating loss in NAVTEQ was EUR 68 million (loss of EUR 80 million), representing an operating margin of -41.0% (-51.3%). Operating loss in Nokia Siemens Networks was EUR 1 107 million (loss of EUR 1 million), representing an operating margin of -40.1% (0.0%). The operating loss in Nokia Siemens Networks included a non-deductible impairment of goodwill charge of EUR 908 million. Corporate Common Functions reported expense totaled EUR 36 million (EUR 52 million). In the third quarter 2009, net financial expense was EUR 48 million (net financial expense EUR 57 million). Loss before tax was EUR 469 million (profit of EUR 1 410 million). The results after taxes included a charge of EUR 432 million recorded to provide a valuation allowance on Nokia Siemens Networks’ deferred tax assets. Loss was EUR 913 million (profit of EUR 1 055 million), based on a loss of EUR 559 million (profit of EUR 1 087 million) attributable to equity holders of the parent and a negative EUR 354 million (negative EUR 32 million) attributable to minority interests. Earnings per share decreased to EUR -0.15 (basic) and EUR -0.15 (diluted), compared with EUR 0.29 (basic) and EUR 0.29 (diluted) in the third quarter of 2008. NOKIA IN JANUARY - SEPTEMBER 2009 (The following discussion is of Nokia's reported results. Comparisons are given to the January-September 2008 results, unless otherwise indicated.) Nokia’s net sales decreased 24% to EUR 28 996 million (EUR 38 048 million). Net sales of Devices & Services decreased 27% to EUR 19 674 million (EUR 26 958 million). Net sales of NAVTEQ were EUR 445 million. Net sales of Nokia Siemens Networks decreased 18% to EUR 8 949 million (EUR 10 971 million). Operating profit decreased 99% to EUR 56 million (EUR 4 474 million), representing an operating margin of 0.2% (11.8%). Operating profit in Devices & Services decreased 59% to EUR 2 095 million (EUR 5 050 million), representing an operating margin of 10.6% (18.7%). Operating loss in NAVTEQ was EUR 288 million, representing an operating margin of -64.7%. Operating loss in Nokia Siemens Networks was EUR 1 656 million (loss of EUR 122 million), representing an operating margin of -18.5% (-1.1%). The operating loss in Nokia Siemens Networks included a non-deductible impairment of goodwill charge of EUR 908 million. Corporate Common Functions reported expense totaled EUR 95 million (EUR 374 million). In the period from January to September 2009, net financial expense was EUR 186 million (net financial income EUR 14 million). Loss before tax was EUR 101 million (profit of EUR 4 494 million). The results after taxes included a charge of EUR 432 million recorded to provide a valuation allowance on Nokia Siemens Networks’ deferred tax assets. Loss was EUR 622 million (profit of EUR 3 338 million), based on a loss of EUR 57 million (profit of EUR 3 412 million) attributable to equity holders of the parent and a negative EUR 565 million (negative EUR 74 million) attributable to minority interests. Earnings per share decreased to EUR -0.02 (basic) and EUR -0.02 (diluted), compared with EUR 0.91 (basic) and EUR 0.90 (diluted) in January-September 2008. PERSONNEL The average number of employees during January-September 2009 was 123 139, of which the average number of employees at Nokia Siemens Networks was 61 575. At September 30, 2009, Nokia employed a total of 123 347 people (123 006 September 30, 2008), of which 63 943 were employed by Nokia Siemens Networks (60 183 people at September 30, 2008). SHARES The total number of Nokia shares at September 30, 2009 was 3 744 956 052. At September 30, 2009, Nokia and its subsidiary companies owned 37 380 257 Nokia shares, representing approximately 1.0% of the total number of Nokia shares and the total voting rights.
  • 11. INTERIM REPORT 11(25) Nokia Corporation October 15, 2009 at 13:00 (CET +1) CONSOLIDATED INCOME STATEMENT, EUR million (unaudited) Reported Reported Non-IFRS Non-IFRS 7-9/2009 7-9/2008 7-9/2009 7-9/2008 Net sales 9 810 12 237 9 810 12 239 Cost of sales -6 749 -7 878 -6 733 -7 867 Gross profit 3 061 4 359 3 077 4 372 Research and development expenses -1 386 -1 466 -1 257 -1 337 Selling and marketing expenses -920 -1 068 -822 -967 Administrative and general expenses -267 -293 -251 -266 Impairment of goodwill -908 - - - Other income 40 102 40 102 Other expenses -46 -165 -46 -148 Operating profit -426 1 469 741 1 756 Share of results of associated companies 5 -2 5 -2 Financial income and expenses -48 -57 -48 -57 Profit before tax -469 1 410 698 1 697 Tax -444 -355 -96 -444 Profit -913 1 055 602 1 253 Profit attributable to equity holders of the parent -559 1 087 634 1 219 Profit attributable to minority interests -354 -32 -32 34 -913 1 055 602 1 253 Earnings per share, EUR (for profit attributable to the equity holders of the parent) Basic -0.15 0.29 0.17 0.33 Diluted -0.15 0.29 0.17 0.33 Average number of shares (1 000 shares) Basic 3 707 535 3 700 704 3 707 535 3 700 704 Diluted 3 714 202 3 736 440 3 714 202 3 736 440 Depreciation and amortization, total 428 490 198 262 Share-based compensation expense, total 15 31 15 31
  • 12. INTERIM REPORT 12(25) Nokia Corporation October 15, 2009 at 13:00 (CET +1) CONSOLIDATED INCOME STATEMENT, EUR million (unaudited) Reported Reported Non-IFRS Non-IFRS 1-9/2009 1-9/2008 1-9/2009 1-9/2008 Net sales 28 996 38 048 28 999 38 057 Cost of sales -19 805 -24 738 -19 691 -24 520 Gross profit 9 191 13 310 9 308 13 537 Research and development expenses -4 344 -4 237 -3 941 -4 017 Selling and marketing expenses -2 885 -3 093 -2 575 -2 855 Administrative and general expenses -851 -939 -764 -837 Impairment of goodwill -908 - - - Other income 239 266 171 201 Other expenses -386 -833 -169 -237 Operating profit 56 4 474 2 030 5 792 Share of results of associated companies 29 6 29 6 Financial income and expenses -186 14 -186 14 Profit before tax -101 4 494 1 873 5 812 Tax -521 -1 156 -417 -1 532 Profit -622 3 338 1 456 4 280 Profit attributable to equity holders of the parent -57 3 412 1 543 4 115 Profit attributable to minority interests -565 -74 -87 165 -622 3 338 1 456 4 280 Earnings per share, EUR (for profit attributable to the equity holders of the parent) Basic -0.02 0.91 0.42 1.09 Diluted -0.02 0.90 0.41 1.08 Average number of shares (1 000 shares) Basic 3 704 106 3 759 091 3 704 106 3 759 091 Diluted 3 721 107 3 802 880 3 721 107 3 802 880 Depreciation and amortization, total 1 333 1 171 618 705 Share-based compensation expense, total -1 127 -1 127
  • 13. INTERIM REPORT 13(25) Nokia Corporation October 15, 2009 at 13:00 (CET +1) NOKIA NET SALES BY GEOGRAPHIC AREA, EUR million (unaudited) Y-o-Y change, Reported 7-9/2009 % 7-9/2008 1-12/2008 Europe 3 558 -19 4 386 18 842 Middle-East & Africa 1 357 -25 1 804 7 265 Greater China 1 736 1 1 722 6 420 Asia-Pacific 2 040 -25 2 711 11 344 North America 392 -29 554 2 068 Latin America 727 -31 1 060 4 771 Total 9 810 -20 12 237 50 710 NOKIA PERSONNEL BY GEOGRAPHIC AREA Y-o-Y change, 30.09.09 % 30.09.08 31.12.08 Europe 58 814 -4 61 268 61 971 Middle-East & Africa 4 140 -20 5 161 5 160 Greater China 15 059 5 14 319 14 879 Asia-Pacific 23 370 13 20 646 21 832 North America 7 936 -7 8 547 8 862 Latin America 14 028 7 13 065 13 125 Total 123 347 0 123 006 125 829
  • 14. INTERIM REPORT 14(25) Nokia Corporation October 15, 2009 at 13:00 (CET +1) DEVICES & SERVICES, EUR million (unaudited) Special Special items & items & Reported PPA Non-IFRS Reported PPA Non-IFRS 7-9/2009 7-9/2009 7-9/2009 7-9/2008 7-9/2008 7-9/2008 Net sales 6 915 - 6 915 8 605 - 8 605 Cost of sales -4 778 - -4 778 -5 464 - -5 464 Gross profit 2 137 - 2 137 3 141 - 3 141 % of net sales 30.9 30.9 36.5 36.5 Research and development expenses 1) -703 2 -701 -719 - -719 % of net sales 10.2 10.1 8.4 8.4 Selling and marketing expenses -552 - -552 -684 - -684 % of net sales 8.0 8.0 7.9 7.9 Administrative and general expenses -105 - -105 -110 - -110 % of net sales 1.5 1.5 1.3 1.3 Other income and expenses 8 - 8 -26 - -26 Operating profit 785 2 787 1 602 - 1 602 % of net sales 11.4 11.4 18.6 18.6 1) Amortization of acquired intangible assets of EUR 2 million in Q3/09
  • 15. INTERIM REPORT 15(25) Nokia Corporation October 15, 2009 at 13:00 (CET +1) NAVTEQ, EUR million (unaudited) Special Special items & items & Reported PPA Non-IFRS Reported PPA Non-IFRS 7-9/2009 7-9/2009 7-9/2009 7-9/2008 7-9/2008 7-9/2008 Net sales 1) 166 - 166 156 1 157 Cost of sales -20 - -20 -18 - -18 Gross profit 146 - 146 138 1 139 % of net sales 88.0 88.0 88.5 88.5 Research and development expenses 2) -152 83 -69 -158 81 -77 % of net sales 91.6 41.6 101.3 49.0 Selling and marketing expenses 3) -49 28 -21 -50 27 -23 % of net sales 29.5 12.7 32.1 14.6 Administrative and general expenses -13 - -13 -13 - -13 % of net sales 7.8 7.8 8.3 8.3 Other income and expenses - - - 3 - 3 Operating profit -68 111 43 -80 109 29 % of net sales -41.0 25.9 -51.3 18.5 1) Deferred revenue related to acquisitions of EUR 1 million in Q3/08. 2) Amortization of acquired intangibles of EUR 83 million in Q3/09 and EUR 81 million in Q3/08. 3) Amortization of acquired intangibles of EUR 28 million in Q3/09 and EUR 27 million in Q3/08.
  • 16. INTERIM REPORT 16(25) Nokia Corporation October 15, 2009 at 13:00 (CET +1) NOKIA SIEMENS NETWORKS, EUR million (unaudited) Special Special items & items & Reported PPA Non-IFRS Reported PPA Non-IFRS 7-9/2009 7-9/2009 7-9/2009 7-9/2008 7-9/2008 7-9/2008 Net sales 1) 2 760 - 2 760 3 503 1 3 504 Cost of sales 2) -1 982 16 -1 966 -2 423 11 -2 412 Gross profit 778 16 794 1 080 12 1 092 % of net sales 28.2 28.8 30.8 31.2 Research and development expenses 3) -531 44 -487 -586 48 -538 % of net sales 19.2 17.6 16.7 15.4 Selling and marketing expenses 4) -318 70 -248 -334 74 -260 % of net sales 11.5 9.0 9.5 7.4 Administrative and general expenses 5) -128 16 -112 -141 27 -114 % of net sales 4.6 4.1 4.0 3.3 Other income and expenses 6) -908 908 - -20 17 -3 Operating profit -1 107 1 054 -53 -1 178 177 % of net sales -40.1 -1.9 0.0 5.1 1) Deferred revenue related to acquisitions of EUR 1 million in Q3/08. 2) Restructuring charges of EUR 16 million in Q3/09 and of EUR 11 million in Q3/08. 3) Reversal of restructuring charges of EUR 1 million and amortization of acquired intangibles of EUR 45 million in Q3/09. Restructuring charges of EUR 3 million and amortization of acquired intangibles of EUR 45 million in Q3/08. 4) Reversal of restructuring charges of EUR 2 million and amortization of acquired intangibles of EUR 72 million in Q3/09. Restructuring charges of EUR 2 million and amortization of acquired intangibles of EUR 72 million in Q3/08. 5) Restructuring charges of EUR 16 million in Q3/09 and EUR 27 million in Q3/08. 6) Impairment of goodwill of EUR 908 million in Q3/09. Restructuring charges of EUR 16 million and amortization of acquired intangibles of EUR 1 million in Q3/08.
  • 17. INTERIM REPORT 17(25) Nokia Corporation October 15, 2009 at 13:00 (CET +1) GROUP COMMON FUNCTIONS, EUR million (unaudited) Special Special items & items & Reported PPA Non-IFRS Reported PPA Non-IFRS 7-9/2009 7-9/2009 7-9/2009 7-9/2008 7-9/2008 7-9/2008 Net sales - - - - - - Cost of sales - - - - - - Gross profit - - - - - - Research and development expenses - - - -3 - -3 Selling and marketing expenses -1 - -1 - - - Administrative and general expenses -21 - -21 -29 - -29 Other income and expenses -14 - -14 -20 - -20 Operating profit -36 - -36 -52 - -52
  • 18. INTERIM REPORT 18(25) Nokia Corporation October 15, 2009 at 13:00 (CET +1) CONSOLIDATED INCOME STATEMENT, EUR million (unaudited) NOKIA GROUP Special Special items items Reported & PPA Non-IFRS Reported & PPA Non-IFRS 7-9/2009 7-9/2009 7-9/2009 7-9/2008 7-9/2008 7-9/2008 Net sales 1) 9 810 - 9 810 12 237 2 12 239 Cost of sales 2) -6 749 16 -6 733 -7 878 11 -7 867 Gross profit 3 061 16 3 077 4 359 13 4 372 % of net sales 31.2 31.4 35.6 35.7 Research and development expenses 3) -1 386 129 -1 257 -1 466 129 -1 337 % of net sales 14.1 12.8 12.0 10.9 Selling and marketing expenses 4) -920 98 -822 -1 068 101 -967 % of net sales 9.4 8.4 8.7 7.9 Administrative and general expenses 5) -267 16 -251 -293 27 -266 % of net sales 2.7 2.6 2.4 2.2 Other income and expenses 6) -914 908 -6 -63 17 -46 Operating profit -426 1 167 741 1 469 287 1 756 % of net sales -4.3 7.6 12.0 14.3 Share of results of associated companies 5 5 -2 -2 Financial income and expenses -48 -48 -57 -57 Profit before tax -469 1 167 698 1 410 287 1 697 Tax -444 348 -96 -355 -89 -444 Profit -913 1 515 602 1 055 198 1 253 Profit attributable to equity holders of the parent -559 1 193 634 1 087 132 1 219 Profit attributable to minority interests -354 322 -32 -32 66 34 -913 1 515 602 1 055 198 1 253 Earnings per share, EUR (for profit attributable to the equity holders of the parent) Basic -0.15 0.32 0.17 0.29 0.04 0.33 Diluted -0.15 0.32 0.17 0.29 0.04 0.33 Average number of shares (1 000 shares) Basic 3 707 535 3 707 535 3 700 704 3 700 704 Diluted 3 714 202 3 714 202 3 736 440 3 736 440 Depreciation and amortization, total 428 -230 198 490 -228 262 Share-based compensation expense, total 15 - 15 31 - 31 1) Deferred revenue related to acquisitions of EUR 2 million in Q3/08. 2) Restructuring charges of EUR 16 million in Q3/09 and EUR 11 million in Q3/08. 3) Reversal of restructuring charges of EUR 1 million and amortization of acquired intangible assets of EUR 130 million in Q3/09. Restructuring charges of EUR 3 million and amortization of acquired intangible assets of EUR 126 million in Q3/08. 4) Reversal of restructuring charges of EUR 2 million and amortization of acquired intangible assets of EUR 100 million in Q3/09. Restructuring charges of 2 million and amortization of acquired intangible assets of EUR 99 million in Q3/08. 5) Restructuring charges of EUR 16 million in Q3/09 and EUR 27 million in Q3/08. 6) Impairment of goodwill of EUR 908 million in Q3/09. Restructuring charges of EUR 16 million and amortization of acquired intangibles of EUR 1 million in Q3/08.
  • 19. INTERIM REPORT 19(25) Nokia Corporation October 15, 2009 at 13:00 (CET +1) CONSOLIDATED INCOME STATEMENT, IFRS, EUR million (unaudited) 7-9/2009 7-9/2008 1-9/2009 1-9/2008 1-12/2008 Net sales 9 810 12 237 28 996 38 048 50 710 Cost of sales -6 749 -7 878 -19 805 -24 738 -33 337 Gross profit 3 061 4 359 9 191 13 310 17 373 Research and development expenses -1 386 -1 466 -4 344 -4 237 -5 968 Selling and marketing expenses -920 -1 068 -2 885 -3 093 -4 380 Administrative and general expenses -267 -293 -851 -939 -1 284 Impairment of goodwill -908 - -908 - - Other income 40 102 239 266 420 Other expenses -46 -165 -386 -833 -1 195 Operating profit -426 1 469 56 4 474 4 966 Share of results of associated companies 5 -2 29 6 6 Financial income and expenses -48 -57 -186 14 -2 Profit before tax -469 1 410 -101 4 494 4 970 Tax -444 -355 -521 -1 156 -1 081 Profit -913 1 055 -622 3 338 3 889 Profit attributable to equity holders of the parent -559 1 087 -57 3 412 3 988 Profit attributable to minority interests -354 -32 -565 -74 -99 -913 1 055 -622 3 338 3 889 Earnings per share, EUR (for profit attributable to the equity holders of the parent) Basic -0.15 0.29 -0.02 0.91 1.07 Diluted -0.15 0.29 -0.02 0.90 1.05 Average number of shares (1 000 shares) Basic 3 707 535 3 700 704 3 704 106 3 759 091 3 743 622 Diluted 3 714 202 3 736 440 3 721 107 3 802 880 3 780 363 Depreciation and amortization, total 428 490 1 333 1 171 1 617 Share-based compensation expense, total 15 31 -1 127 67
  • 20. INTERIM REPORT 20(25) Nokia Corporation October 15, 2009 at 13:00 (CET +1) CONSOLIDATED STATEMENT OF COMPREHENSIVE INCOME, IFRS, EUR million 7-9/2009 7-9/2008 1-9/2009 1-9/2008 1-12/2008 Profit -913 1 055 -622 3 338 3 889 Other comprehensive income Tax benefit on stock options exercised - 4 - 4 4 Excess tax benefit on share-based compensation -1 -22 -14 -122 -128 Translation differences -405 471 -566 422 595 Net investment hedge gains/losses 74 -67 108 -41 -123 Cash flow hedges 398 189 110 -116 -40 Available-for-sale investments 9 11 -3 29 -15 Other increase/decrease, net - 98 -12 65 28 Income tax related to components of other comprehensive income -128 -26 -68 45 58 Other comprehensive income, net of tax -53 658 -445 286 379 Total comprehensive income -966 1 713 -1 067 3 624 4 268 Total comprehensive income attributable to equity holders of the parent -644 1 835 -545 3 790 4 459 minority interests -322 -122 -522 -166 -191 -966 1 713 -1 067 3 624 4 268
  • 21. INTERIM REPORT 21(25) Nokia Corporation October 15, 2009 at 13:00 (CET +1) CONSOLIDATED STATEMENT OF FINANCIAL POSITION, IFRS, EUR million (unaudited) ASSETS 30.09.2009 30.09.2008 31.12.2008 Non-current assets Capitalized development costs 174 328 244 Goodwill 5 189 5 577 6 257 Other intangible assets 3 013 4 117 3 913 Property, plant and equipment 1 930 2 047 2 090 Investments in associated companies 71 335 96 Available-for-sale investments 495 492 512 Deferred tax assets 1 581 1 904 1 963 Long-term loans receivable 34 40 27 Other non-current assets 8 20 10 12 495 14 860 15 112 Current assets Inventories 2 034 3 246 2 533 Accounts receivable 8 263 10 772 9 444 Prepaid expenses and accrued income 4 676 3 741 4 538 Current portion of long-term loans receivable 13 100 101 Other financial assets 461 325 1 034 Investments at fair value through profit and loss, liquid assets 688 - - Available-for-sale investments, liquid assets 1 770 1 466 1 272 Available-for-sale investments, cash equivalents 3 520 4 040 3 842 Bank and cash 1 454 1 726 1 706 22 879 25 416 24 470 Total assets 35 374 40 276 39 582 SHAREHOLDERS' EQUITY AND LIABILITIES Capital and reserves attributable to equity holders of the parent Share capital 246 246 246 Share issue premium 274 533 442 Treasury shares -694 -1 919 -1 881 Translation differences -134 213 341 Fair value and other reserves 72 51 62 Reserve for invested non-restricted equity 3 176 3 321 3 306 Retained earnings 9 175 11 145 11 692 12 115 13 590 14 208 Minority interests 1 762 2 355 2 302 Total equity 13 877 15 945 16 510 Non-current liabilities Long-term interest-bearing liabilities 4 447 174 861 Deferred tax liabilities 1 365 1 797 1 787 Other long-term liabilities 64 159 69 5 876 2 130 2 717 Current liabilities Current portion of long-term loans 14 62 13 Short-term borrowing 838 4 050 3 578 Other financial liabilities 139 526 924 Accounts payable 5 066 6 369 5 225 Accrued expenses 6 567 7 686 7 023 Provisions 2 997 3 508 3 592 15 621 22 201 20 355 Total shareholders' equity and liabilities 35 374 40 276 39 582 Interest-bearing liabilities 5 299 4 286 4 452 Shareholders' equity per share, EUR 3.27 3.68 3.84 Number of shares (1 000 shares) 1) 3 707 576 3 696 490 3 697 872 1) Shares owned by Group companies are excluded.
  • 22. INTERIM REPORT 22(25) Nokia Corporation October 15, 2009 at 13:00 (CET +1) CONSOLIDATED STATEMENT OF CASH FLOWS, IFRS, EUR million (unaudited) 1-9/2009 1-9/2008 1-12/2008 Cash flow from operating activities Profit attributable to equity holders of the parent -57 3 412 3 988 Adjustments, total 2 603 2 947 3 469 Change in net working capital 587 -1 548 -2 546 Cash generated from operations 3 133 4 811 4 911 Interest received 93 341 416 Interest paid -177 -86 -155 Other financial income and expenses, net -513 216 -195 Income taxes paid -824 -1 786 -1 780 Net cash from operating activities 1 712 3 496 3 197 Cash flow from investing activities Acquisition of Group companies, net of acquired cash -25 -5 463 -5 962 Purchase of current available-for-sale investments, liquid assets -1 198 -595 -669 Purchase of investments at fair value through profit and loss, liquid assets -695 - - Purchase of non-current available-for-sale investments -61 -49 -121 Purchase of shares in associated companies -27 -15 -24 Additions to capitalized development costs -26 -77 -131 Long-term loans made to customers - -54 - Proceeds from repayment and sale of long-term loans receivable - 108 129 Proceeds from (+) / payment of (-) other long-term loans receivable - -48 -1 Proceeds from (+) / payment of (-) short-term loans receivable 1 49 -15 Capital expenditures -384 -665 -889 Proceeds from disposal of shares in associated companies 39 2 3 Proceeds from disposal of businesses 62 61 41 Proceeds from maturities and sale of current available-for-sale investments, liquid assets 690 4 184 4 664 Proceeds from sale of non-current available-for-sale investments 10 9 10 Proceeds from sale of fixed assets 18 55 54 Dividends received 2 3 6 Net cash used in investing activities -1 594 -2 495 -2 905 Cash flow from financing activities Proceeds from stock option exercises - 51 53 Purchase of treasury shares - -3 121 -3 121 Proceeds from long-term borrowings 3 899 14 714 Repayment of long-term borrowings -210 -33 -34 Proceeds from (+) / payment of (-) short-term borrowings -2 829 3 016 2 891 Dividends paid -1 520 -2 010 -2 048 Net cash used in financing activities -660 -2 083 -1 545 Foreign exchange adjustment -32 -2 -49 Net increase (+) / decrease (-) in cash and cash equivalents -574 -1 084 -1 302 Cash and cash equivalents at beginning of period 5 548 6 850 6 850 Cash and cash equivalents at end of period 4 974 5 766 5 548 NB: The figures in the consolidated cash flow statement cannot be directly traced from the balance sheet without additional information as a result of acquisitions and disposals of subsidiaries and net foreign exchange differences arising on consolidation.
  • 23. INTERIM REPORT 23(25) Nokia Corporation October 15, 2009 at 13:00 (CET +1) CONSOLIDATED STATEMENT OF CHANGES IN SHAREHOLDERS' EQUITY, IFRS, EUR million (unaudited) Reserve Fair for value invested Share and non- Share issue Treasury Translation other restricted Retained Before Minority Total capital premium shares difference reserves equity earnings minority interest equity Balance at December 31, 2007 246 644 -3 146 -163 23 3 299 13 870 14 773 2 565 17 338 Total comprehensive income - -113 - 376 28 - 3 499 3 790 -166 3 624 Stock options exercised 51 51 51 Stock options exercised related to acquisitions 1 1 1 Share-based compensation 132 132 132 Settlement of performance shares -150 116 -29 -63 -63 Acquisition of treasury shares -3 123 -3 123 -3 123 Reissuance of treasury shares 2 2 2 Cancellation of treasury shares 4 232 -4 232 - - Dividend -1 992 -1 992 -11 -2 003 Acquisitions and other changes in minority interests - -33 -33 Vested portion of share-based payment awards related to acquisitions 19 19 19 Balance at September 30, 2008 246 533 -1 919 213 51 3 321 11 145 13 590 2 355 15 945 Balance at December 31, 2008 246 442 -1 881 341 62 3 306 11 692 14 208 2 302 16 510 Total comprehensive income - -13 - -475 10 - -67 -545 -522 -1 067 Stock options exercised related to acquisitions -1 -1 -1 Share-based compensation 1 1 1 Settlement of performance shares -155 217 -130 -68 -68 Reissuance of treasury shares 1 1 1 Cancellation of treasury shares 969 -969 - - Dividend -1 481 -1 481 -18 -1 499 Balance at September 30, 2009 246 274 -694 -134 72 3 176 9 175 12 115 1 762 13 877
  • 24. INTERIM REPORT 24(25) Nokia Corporation October 15, 2009 at 13:00 (CET +1) COMMITMENTS AND CONTINGENCIES, EUR million (unaudited) GROUP 30.09.2009 30.09.2008 31.12.2008 Collateral for own commitments Property under mortgages 18 18 18 Assets pledged 10 11 11 Contingent liabilities on behalf of Group companies Guarantees for loans - - - Other guarantees 2 581 2 900 2 896 Contingent liabilities on behalf of other companies Financial guarantees on behalf of third parties 1 155 2 Other guarantees 3 6 1 Leasing obligations 1 263 1 254 1 156 Financing commitments Customer finance commitments 35 289 197 Venture fund commitments 324 489 467 1 EUR = 1.459 USD The unaudited, consolidated interim financial statements of Nokia have been prepared in accordance with the International Financial Reporting Standards (“IFRS”). The same accounting policies and methods of computation are followed in the interim financial statements as were followed in the consolidated financial statements of Nokia for 2008.
  • 25. INTERIM REPORT 25(25) Nokia Corporation October 15, 2009 at 13:00 (CET +1) FORWARD-LOOKING STATEMENTS It should be noted that certain statements herein which are not historical facts, including, without limitation, those regarding: A) the timing of product, services and solution deliveries; B) our ability to develop, implement and commercialize new products, services, solutions and technologies; C) our ability to develop and grow our consumer Internet services business; D) expectations regarding market developments and structural changes; E) expectations regarding our mobile device volumes, market share, prices and margins; F) expectations and targets for our results of operations; G) the outcome of pending and threatened litigation; H) expectations regarding the successful completion of contemplated acquisitions on a timely basis and our ability to achieve the set targets upon the completion of such acquisitions; and I) statements preceded by "believe," "expect," "anticipate," "foresee," "target," "estimate," "designed," "plans," "will" or similar expressions are forward-looking statements. These statements are based on management's best assumptions and beliefs in light of the information currently available to it. Because they involve risks and uncertainties, actual results may differ materially from the results that we currently expect. Factors that could cause these differences include, but are not limited to: 1) the deteriorating global economic conditions and related financial crisis and their impact on us, our customers and end-users of our products, services and solutions, our suppliers and collaborative partners; 2) the development of the mobile and fixed communications industry, as well as the growth and profitability of the new market segments that we target and our ability to successfully develop or acquire and market products, services and solutions in those segments; 3) the intensity of competition in the mobile and fixed communications industry and our ability to maintain or improve our market position or respond successfully to changes in the competitive landscape; 4) competitiveness of our product, services and solutions portfolio; 5) our ability to successfully manage costs; 6) exchange rate fluctuations, including, in particular, fluctuations between the euro, which is our reporting currency, and the US dollar, the Japanese yen, the Chinese yuan and the UK pound sterling, as well as certain other currencies; 7) the success, financial condition and performance of our suppliers, collaboration partners and customers; 8) our ability to source sufficient amounts of fully functional components, sub-assemblies, software and content without interruption and at acceptable prices; 9) the impact of changes in technology and our ability to develop or otherwise acquire and timely and successfully commercialize complex technologies as required by the market; 10) the occurrence of any actual or even alleged defects or other quality, safety or security issues in our products, services and solutions; 11) the impact of changes in government policies, trade policies, laws or regulations or political turmoil in countries where we do business; 12) our success in collaboration arrangements with others relating to development of technologies or new products, services and solutions; 13) our ability to manage efficiently our manufacturing and logistics, as well as to ensure the quality, safety, security and timely delivery of our products, services and solutions; 14) inventory management risks resulting from shifts in market demand; 15) our ability to protect the complex technologies, which we or others develop or that we license, from claims that we have infringed third parties' intellectual property rights, as well as our unrestricted use on commercially acceptable terms of certain technologies in our products, services and solutions; 16) our ability to protect numerous Nokia, NAVTEQ and Nokia Siemens Networks patented, standardized or proprietary technologies from third-party infringement or actions to invalidate the intellectual property rights of these technologies; 17) any disruption to information technology systems and networks that our operations rely on; 18) developments under large, multi-year contracts or in relation to major customers; 19) the management of our customer financing exposure; 20) our ability to retain, motivate, develop and recruit appropriately skilled employees; 21) whether, as a result of investigations into alleged violations of law by some former employees of Siemens AG ("Siemens"), government authorities or others take further actions against Siemens and/or its employees that may involve and affect the carrier-related assets and employees transferred by Siemens to Nokia Siemens Networks, or there may be undetected additional violations that may have occurred prior to the transfer, or violations that may have occurred after the transfer, of such assets and employees that could result in additional actions by government authorities; 22) any impairment of Nokia Siemens Networks customer relationships resulting from the ongoing government investigations involving the Siemens carrier-related operations transferred to Nokia Siemens Networks; 23) unfavorable outcome of litigations; 24) allegations of possible health risks from electromagnetic fields generated by base stations and mobile devices and lawsuits related to them, regardless of merit; as well as the risk factors specified on pages 11-28 of Nokia's annual report on Form 20-F for the year ended December 31, 2008 under Item 3D. "Risk Factors." Other unknown or unpredictable factors or underlying assumptions subsequently proving to be incorrect could cause actual results to differ materially from those in the forward-looking statements. Nokia does not undertake any obligation to publicly update or revise forward-looking statements, whether as a result of new information, future events or otherwise, except to the extent legally required. Nokia, Helsinki – October 15, 2009 Media and Investor Contacts: Corporate Communications, tel. +358 7180 34900 Investor Relations Europe, tel. +358 7180 34289 Investor Relations US, tel. +1 914 368 0555 - Nokia plans to publish its fourth quarter 2009 results on January 28, 2010. - Nokia plans to report its other quarterly results in 2010 on the following dates: Q1 on April 22, Q2 on July 22 and Q3 on October 21, 2010. - Nokia plans to publish its annual report, Nokia in 2009, in week 12 of 2010 - Nokia’s Annual General Meeting is scheduled to be held on May 6, 2010. www.nokia.com