Contenu connexe
Similaire à Social Media Deals Report
Similaire à Social Media Deals Report (20)
Social Media Deals Report
- 1. Social Media Deals Report
A Special Report from ContentNext Media from Q1 ‘07 through Q1 ‘08
Executive Summary
The economics of social media are continuing to heat up as more and more value and buzz are created in new and growing
market categories. In just the past months, Federated Media raised an additional $50 million while AOL acquired Bebo for
$850 million. Money continues to flow in and out of the category, which seems to continue to grow in depth and context.
This report examines the categories, number and size of investment into social media and the resulting value created in
acquisitions during the 15-month period from January 2007 through March 2008.
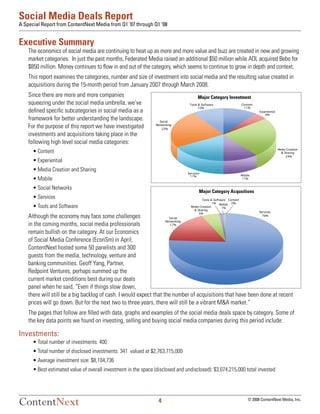
Since there are more and more companies Major Category Investment
squeezing under the social media umbrella, we’ve Tools & Software Content
10% 11%
defined specific subcategories in social media as a Experiential
4%
framework for better understanding the landscape. Social
For the purpose of this report we have investigated Networking
23%
investments and acquisitions taking place in the
following high level social media categories:
• Content Media Creation
& Sharing
24%
• Experiential
• Media Creation and Sharing
Services
17% Mobile
• Mobile 11%
• Social Networks
Major Category Acqusitions
• Services Tools & Software Content
1% Mobile 0%
• Tools and Software Media Creation 1%
& Sharing
Services
5%
Although the economy may face some challenges Social
76%
Networking
in the coming months, social media professionals 17%
remain bullish on the category. At our Economics
of Social Media Conference (EconSm) in April,
ContentNext hosted some 50 panelists and 300
guests from the media, technology, venture and
banking communities. Geoff Yang, Partner,
Redpoint Ventures, perhaps summed up the
current market conditions best during our deals
panel when he said, “Even if things slow down,
there will still be a big backlog of cash. I would expect that the number of acquisitions that have been done at recent
prices will go down. But for the next two to three years, there will still be a vibrant M&A market.”
The pages that follow are filled with data, graphs and examples of the social media deals space by category. Some of
the key data points we found on investing, selling and buying social media companies during this period include:
Investments:
• Total number of investments: 400
• Total number of disclosed investments: 341 valued at $2,763,715,000
• Average investment size: $8,104,736
• Best estimated value of overall investment in the space (disclosed and undisclosed): $3,074,215,000 total invested
ContentNext 4 © 2008 ContentNext Media, Inc.
- 2. Social Media Deals Report
A Special Report from ContentNext Media from Q1 ‘07 through Q1 ‘08
Acquisitions:
• Total number of acquisitions: 131
• Total number of disclosed acquisitions: 41 disclosed valued at $13,422,310,000
• Average acquisition size: $327,313,415
Acquisition Range: $350,000 - $6,000,000,000
• Best estimated value of overall transaction in the space (disclosed and undisclosed ): $16,324,810,000 acquisition value
• Number of different acquirers: 96
Most Active Investors
• Common Angels (12 rounds)
• Accel Partners (9 rounds)
• Edgestone Capital (9 rounds)
• General Catalyst Partners (9 rounds)
• JK&B Capital (9 rounds)
Top 5 Most Active Acquirers
• Internet Brands (7 transactions)
• Yahoo! (5 transactions)
• Disney (4 transactions)
• Handheld Entertainment (4 transactions)
• Google (4 transactions)
Top 5 Most Active Social Media Categories
• Media Creation and Sharing (101 investments and 19 acquisitions)
• Social Networking (113 investments and 52 acquisitions)
• Services (53 investments and 18 acquisitions)
• Content (58 investments and 26 acquisitions)
• Mobile (3 investments and 2 acquisitions)
ContentNext 5 © 2008 ContentNext Media, Inc.