Contenu connexe
Similaire à Mapping Information Educator\'s Resource (20)
Plus de A. Lynn Grossman (7)
Mapping Information Educator\'s Resource
- 1. Mapping
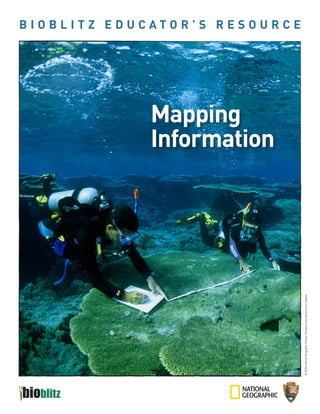
Information
BIOBLITZ EducaTOr’s rEsOurcE
© 2009 National Geographic Society; Educators may reproduce for students.
- 2. Mapping Information > 2
Introduction
In the wild, organisms depend on their habitat
to provide food, water, shelter, and other
requirements for survival. Scientists studying
wildlife use geographic data to record the
location of critical resources, search for species,
record places species are found, and analyze
correlations to identify underlying patterns.
Information about where species live, and
their habitat use, is critical to preserving and
protecting Earth’s biodiversity.
KEy QuEsTIOns:
› What is a map?
› What elements make it useful?
› How are maps used in wildlife research?
› How do you make a map?
WhaT’s InsIdE
Guided Discussion . . . . . . . . . . . . 3
Supplemental Media . . . . . . . . . . 4 © 2009 National Geographic Society; Educators may reproduce for students.
Lab Activity. . . . . . . . . . . . . . . . . . 5
Student Worksheets . . . . . . . . . . 7 Dr. Lisa Dabek, a National Geographic grantee, is tracking Matschie’s
tree kangaroos in Papua New Guinea. Maps such as this one, showing
Outline for Guided Discussion . . 9 home range areas, are helping protect the habitat of this endangered
species.
bioblitz > mapping information nationalgeographic.com/bioblitz
- 3. Guided discussion/PowerPoint > 3
Guided discussion/PowerPoint
Instructional strategy:
Introduce a definition of a map, then Large-group Instruction; Multimedia Instruction;
Discussions
30-45 min
consider some examples. Next, review
Materials/Preparation:
common map elements and learn about
• Go to nationalgeographic.com/bioblitz to download
biologists who use mapping as part of Mapping Information in PowerPoint format.
their research. Conclude with a review • See Outline for Guided Discussion, p. 9, for a
preview of slides and teaching notes. Use this
of the steps students can take to make
as a reference during the Guided Discussion.
their own maps.
Optional:
• Incorporate video segments on wildlife
research into the discussion. See
Supplemental Media, p. 4, for details.
© 2009 National Geographic Society; Educators may reproduce for students.
Turn to p. 9 for complete outline.
bioblitz > mapping information nationalgeographic.com/bioblitz
- 4. supplemental Media > 4
supplemental Media: Wild chronicles
Available online at nationalgeographic.com/bioblitz-video.
Video segments from National Geographic’s Wild Chronicles are
an engaging way to show students pioneering wildlife research
from around the planet. Segments can be viewed as an
independent activity or incorporated into the Guided Discussion.
› cheetahs are Back in Town › Where do Whale sharks Go?
Researchers at South Africa’s Mountain Zebra Whale sharks, among the
National Park are using GPS collars to monitor largest creatures on the
Batman and Robin, a pair of cheetahs that planet, are often spotted at
have been enlisted to help restore the natural Ningaloo Reef in Western
predator-prey balance. Time: 4:36 Australia. National Geographic Emerging
Explorer Brad Norman is analyzing imagery and
› Into the Trees with Kangas GPS data to learn where whale sharks go once
Radio collars are helping National Geographic they leave the safety of the reef. Time: 6:31
grantee Dr. Lisa Dabek and team track the
elusive Matschie’s tree kangaroo. These obser-
dIscussIOn
vations offer new insights into tree kangaroo
location, range and habitat use—and may help
• What question
save this endangered species. Time: 5:48 or issue is the re
searcher
investigating?
› Whale Tracking
• What challenges
Researchers are tagging humpback whales to does the research
er face?
gain a clearer picture of their underwater habits
• What tools are
researchers usin
and foraging strategies. The data collected is g to gather
geospatial data?
used to redirect water traffic and implement
safer fishing practices to keep these whales out • What impact m
ight the research
have?
of harms’ way. Time: 4:30
credits
contributors/consultants design
The resource was produced by National Geographic
Education Programs. © 2009 National Geographic Appalachian Highlands Science Learning Center, Project Design Company: Dan Banks, Art Director,
Society. All Rights Reserved. Educators may GSMNP—Susan Sachs; Census of Marine Life— Kerri Sarembock, Designer © 2009 National Geographic Society; Educators may reproduce for students.
reproduce for students. Darlene Trew Crist; Discover Life in America—
Image credits
Todd P. Witcher; Duke University Marine Lab—
p.2, Russel A. Mittermeier, photo; Gabriel Porolak,
content development Ari Friedlander, Caroline Good; Duke University
map; p. 4, Brad Norman; p.5, Mason Weinrich/
NATIONAL GEOGRAPHIC EDUCATION PROGRAMS Nicholas School of the Environment—Ben
Whale Center of New England, photo; Colin Ware/
Donnelly, Ei Fujicka, Dr. Patrick Halpin; ECOCEAN—
Kim Hulse, Director, Geography Education
University of New Hampshire, animation still; p. 7
Dr. Brad Norman; Indiana Dunes Environmental
Amy Grossman, Manager, Educational Media © Brian J. Skerry/National Geographic Images
Learning Center—Brian Forist; Indiana Dunes
Leslie Ann Pierce, Ed.D., National Lakeshore—Kimberly Swift; Michigan
Science Education Consultant State University, Department of Entomology—
Andy Conlin, Kristin Dell, Ivey Wohlfeld, Researchers David Cappaert; Snow Leopard Trust—Dr. Tom
McCarthy, Jennifer Snell Rullman; Woodland Park
Chelsea Zillmer, Copyeditor
Zoo/Tree Kangaroo Conservation Program—Dr.
Lisa Dabek, Gabriel Porolak, Susan O’Neil
bioblitz > mapping information nationalgeographic.com/bioblitz
- 5. Lab activity > 5
Lab activity: north atlantic right Whales—
conflict and conservation
Instructional strategy: • “Whale Tracking” from Wild
Chronicles, available at
Small-group or Large-group Instruction
20-30 min
nationalgeographic.com/bioblitz-
introduction
20 min activity
video (see Supplemental Media, p. 4)
Materials/Preparation:
20 min
discussion
• Copies of data and map worksheets,
• “Right Whales—On the Brink, On
p. 7-8, one set per student or
the Rebound,” available at National
workgroup
Geographic Magazine Online, ngm.
• Rulers; colored pens, pencils,
nationalgeographic.com/1008/10/
or markers
right-whales/Chadwick-test
dIrEcTIOns
1. Introduce key issues. Have students read the National
Geographic article and/or watch the Wild Chronicles
video segment (see Materials, above) to become familiar
with critical issues facing whales today. While the
article focuses on right whales and the video focuses
on humpback whales, either resource is relevant to
the activity as there are many common issues.
2. reflect and discuss. Ask students to reflect on what
they learned. Answers will vary, depending on the
resource. Possible discussion prompts:
What are some threats facing whales today?
Threats include ship strikes, entanglement in fishing
lines, chemical and noise pollution.
What are scientists and volunteers doing to help
conserve and protect right whales? A range of high- and
low-tech efforts includes photography, geo-tagging, DNA
analysis, land and air surveillance, acoustic buoys, and an
Early Warning System to alert ship captains.
3. distribute worksheets, review activity. Explain that
students will be mapping data collected by right whale
researchers and analyzing the results. Familiarize
students with the data and base map, introducing © 2009 National Geographic Society; Educators may reproduce for students.
components such as:
North Atlantic Right Whale Adult and Calf Deaths—this
data set indicates the location of adult and calf deaths
A researcher positions a DTAG (Digital Acoustic Recording Tag) on a
reported in this area between 2004-2007.
humpback whale to record sounds and measure underwater behaviors
and movements (top). A computer animation based on data recorded by
Right Whale Auto-Detection Buoys—this data set indicates the tag reveals patterns never before seen or analyzed (bottom).
the location of acoustic buoys used to detect the
presence and location of whales. A relay system alerts
ship captains to slow down or divert in order to avoid
a ship strike.
continued >
bioblitz > mapping information nationalgeographic.com/bioblitz
- 6. Lab activity > 6
3. One way to reduce ship strikes and whale deaths
Shipping Lanes, Major Ports, Right Whale Seasonal
Management Area—Shipping lanes to and from major is to relocate shipping lanes that are used for
ports help regulate ship traffic within a seasonal transportation, fishing, and the import and export of
management area. commercial goods. What factors or impacts would need
to be considered as part of such a proposal? Factors to
Grid System—a coordinate system that uses latitude
consider might include economic impacts such as higher
and longitude measurements to locate points on
transportation or energy costs; transportation delays;
the Earth’s surface. In the data sets, latitude and
environmental impacts if other ports would need to be
longitude are indicated in decimal degrees. On the
expanded or if new ports are needed.
map, each hash mark equals one-tenth of a degree.
5. Wrap-up. Ask students to think about research they
4. complete activity, share, and discuss. Give students
would conduct to help save right whales. Explain
time to complete the activity. Then, ask students to
that scientific data has helped lead to shipping lane
share their maps and discuss the questions on the data
changes, reduced ship speed requirements, and
worksheet (included below):
modifications to fixed fishing gear.
1. A calving ground is an area where whales give birth
ouRces
AdditionAl Res
and care for their young. Based on the ratio of adult
to calf mortalities, could there be a calving ground in
right Whale research
this area? The ratio of calf to adult deaths is two to one,
new England aquarium cts/
ion_and_research/proje
indicating a concentration of calves in this area.
www.neaq.org/conservat earch/
abitats/right_whale_res
endangered_species_h
2. Look at the location of these factors: (a) Right
ex.php
right_whale_projects/ind
Whale Auto-Detection Buoys; (b) shipping lanes; and
Protected resources:
nOaa Fisheries Office of
(c) right whale adult and calf deaths. Where would you
ales
north atlantic right Wh
place more buoys to prevent whale deaths and why?
ans/
pecies/mammals/cetace
www.nmfs.noaa.gov/pr/s
Additional buoys could be placed near active shipping
htm
rightwhale_northatlantic.
ports such as Fernandina Beach and Brunswick.
Protected resources:
nOaa Fisheries Office of
answer Key ship strike reduction
trike
www.nero.noaa.gov/ships
m
ale consortiu
north atlantic right Wh
www.rightwhaleweb.org
twork
right Whale Listening ne
es.org
www.listenforwhal
Whalenet
/Welcome.html
http://whale.wheelock.edu
© 2009 National Geographic Society; Educators may reproduce for students.
l Adult Death
s Calf Death
H Buoy
This activity was developed in collaboration with Christopher
Tremblay, Cornell Laboratory of Ornithology Bioacoustics Research
Program; and Jennifer Cutraro, Amy Knowlton, and Kerry Lagueux,
New England Aquarium Departments of Research and Education.
Cartography: Kerry Laguex.
bioblitz > mapping information nationalgeographic.com/bioblitz
- 7. data Worksheet
north atlantic right Whales—conflict and conservation
North Atlantic right whales are on the edge of
extinction and scientists believe research can help
save this species. They are collecting geographic
data to identify ways to reduce ship strikes, the
leading cause of injury and death to right whales.
What can be learned when this data is mapped?
dIrEcTIOns
sTEP 1.
Map Information. Experts have recorded the location
of calf deaths, adult deaths, and buoys near the
coast of Florida and Georgia. Use the latitude and
longitude points in each chart (right) to map these
locations. Map all the points on the same map. Before
you make your map, think about the following:
• Will you use symbols or color to represent different
data sets? What symbols? What colors? © Brian J. Sk
erry/Nationa
l Geographic
Images
• Most maps include elements such as date, orientation,
scale, title, author, source, and legend. Look to see A North Atlantic right whale and calf. Researchers estimate
there are only 300-400 right whales alive today.
if these are included and add them, if missing.
right Whale deaths near Florida, 2004-2007
sTEP 2.
Interpreting Information. After you have mapped the Calves Adults
data, analyze your map to answer these questions.
Latitude Longitude Latitude Longitude
1. A calving ground is an area where whales give birth
30.6˚ N 81.5˚ W 30.9˚ N 81.1 W
and care for their young. Based on the ratio of adult to
30.3˚ N 81.1˚ W 31.0˚ N 81.1˚ W
calf mortalities, could there be a calving ground in this
30.4˚ N 81.4˚ W
area? Form a hypothesis based on patterns you see.
30.3˚ N 81.4˚ W
2. Look at the location of these factors: (a) Right Whale
Auto-Detection Buoys; (b) shipping lanes; and (c) right
whale adult and calf deaths. Where would you place
© 2009 National Geographic Society; Educators may reproduce for students.
right Whale auto-detection Buoys
more buoys to prevent whale deaths and why?
Buoys
3. One way to reduce ship strikes and whale deaths
is to relocate shipping lanes that are used for
Latitude Longitude Sources—Whale Death Data: Amy
transportation, fishing, and the import and export of Knowlton, New England Aquarium;
30.4˚ N 81.2˚ W
commercial goods. What factors or impacts would Buoy Locations: Christopher
Tremblay, Cornell Bioacoustics
need to be considered as part of such a proposal? 30.3˚ N 81.3˚ W Research Program
bioblitz > mapping information nationalgeographic.com/bioblitz
- 8. Map Worksheet
Title author
/ /
source Today’s date
© 2009 National Geographic Society; Educators may reproduce for students.
LEGEnd
__________________________
Major Ports
__________________________
Shipping Lanes
__________________________
bioblitz > mapping information nationalgeographic.com/bioblitz
- 9. Outline for Guided discussion > 9
Go to nationalgeographic.com/bioblitz to download
Outline for Guided discussion Mapping Information, in PowerPoint format.
Slide # Slide Notes
Start Presentation.
1
Have students identify the resources they use at school, such
as food, water, books, computers, lockers, classrooms, and
washrooms-- and where they are located. Use a whiteboard
to sketch a map.
2
If you have time, use a different color marker to map re-
sources utilized by teachers.
3
© 2009 National Geographic Society; Educators may reproduce for students.
4
bioblitz > mapping information nationalgeographic.com/bioblitz
- 10. Outline for Guided discussion > 10
Outline for Guided discussion
Slide # Slide Notes
5
Ask students to consider the question for each image and
explain why they think each image is a map or not. Though
these images depict areas of vastly varying sizes, all are
graphic and all represent an area, physical or conceptual.
6
For more information about elephant seal research,
see “Shore Leave,” in National Geographic (November
2008)), available online at http://ngm.nationalgeographic.
com/2008/11/elephant-seals/casey-text
7
Ask one or more students to come up to the map and identify
elements that make a map useful such as the names of
landmasses or bodies of water. © 2009 National Geographic Society; Educators may reproduce for students.
8 Other elements on this map include a title; the author/
source; latitude and longitude; place names; physical geog-
raphy (land cover).
bioblitz > mapping information nationalgeographic.com/bioblitz
- 11. Outline for Guided discussion > 11
Outline for Guided discussion
Slide # Slide Notes
Date= When the map was made
Orientation= Direction (north arrow)
Scale= Map distance
Title= What, where, and when
9 Author/Source = who made the map
Legend = what the symbols mean
Ask students to identify different elements (see below). Note
some while maps include all elements, others do not. Maps
missing key elements are still useful, but people using these
maps should be aware of what is or is not included. Ele-
10 ments: Date= When the map was made; Orientation= Direc-
tion (north arrow); Scale= Map distance; Title= What, where,
and when; Author/Source = Who made the map; Legend =
What the symbols mean.
Several research projects are profiled in this next section.
For each project there is an introductory slide and then a
slide with a map.
11
© 2009 National Geographic Society; Educators may reproduce for students.
12
bioblitz > mapping information nationalgeographic.com/bioblitz
- 12. Outline for Guided discussion > 12
Outline for Guided discussion
Slide # Slide Notes
For more information, see The Snow Leopard Trust,
www.snowleopard.org
13
The red dots mark the path of a satellite-tracked snow leop-
ard. This research indicates that the range of snow leopards
is two to four times greater than previously estimated.
14 For more information see “Out of the Shadows,” in National
Geographic (June 2008) or visit the Snow Leopard Trust,
www. snowleopard.org
Whale sharks can grow up to 40 feet, apprximately the length
of a bus. Norman’s team identifies individual whale sharks
using a computer program developed by NASA to help iden-
tify star patterns.
15
Option: Watch “Where Do Whale Sharks Go?”. See Mapping
16 Information Educator’s Resource, p. 4 or go to nationalgeo-
graphic.com/bioblitz-video. © 2009 National Geographic Society; Educators may reproduce for students.
For more information about this research visit Ecocean,
whaleshark.org.
bioblitz > mapping information nationalgeographic.com/bioblitz
- 13. Outline for Guided discussion > 13
Outline for Guided discussion
Slide # Slide Notes
To study the insect’s biology, scientists look beneath the bark
of infested ash trees to study the borer galleries that block
nutrient movement and kill trees.
17
18
Option: Watch “Into the Trees with Kangas.” See Mapping
Information Educator’s Resource, p. 4 or go to nationalgeo-
graphic.com/bioblitz-video.
19 For more information about this research visit the Tree
Kangaroo Conservation Project, www.zoo.org/conservation/
treeroo.html
This map shows shows how much space each female tree
kangaroo uses in the cloud forest research area, and how
little or how much these animals overlap. This research is © 2009 National Geographic Society; Educators may reproduce for students.
increasing scientific knowledge of tree kangaroo biology and
20 ecology and helps manage a new conservation area in Papua
New Guinea.
bioblitz > mapping information nationalgeographic.com/bioblitz
- 14. Outline for Guided discussion > 14
Outline for Guided discussion
Slide # Slide Notes
21
22
Review with students, citing examples from the presentation
and discussion, if helpful.
23
Brainstorm resources such as the library and Internet.
© 2009 National Geographic Society; Educators may reproduce for students.
24
bioblitz > mapping information nationalgeographic.com/bioblitz
- 15. Outline for Guided discussion > 15
Outline for Guided discussion
Slide # Slide Notes
25
26
27
© 2009 National Geographic Society; Educators may reproduce for students.
28
bioblitz > mapping information nationalgeographic.com/bioblitz