
Recommandé
Contenu connexe
Tendances
Tendances (20)
En vedette
Similaire à Alg1 ch1101example45
Similaire à Alg1 ch1101example45 (20)
Plus de amymallory
Dernier
Dernier (20)
Alg1 ch1101example45
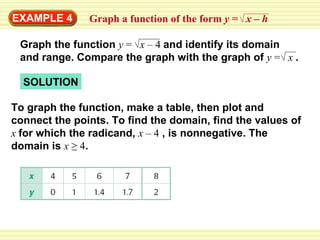
- 1. EXAMPLE 4 SOLUTION Graph the function y = x – 4 and identify its domain and range. Compare the graph with the graph of y = x . To graph the function, make a table, then plot and connect the points. To find the domain, find the values of x for which the radicand, x – 4 , is nonnegative. The domain is x ≥ 4 . Graph a function of the form y = x – h
- 2. EXAMPLE 4 Graph a function of the form y = x – h The range is y ≥ 0 .The graph of y = x – 4 is a horizontal translation (of 4 units to the right) of the graph of y = . x
- 3. EXAMPLE 5 Graph a function of the form y = a x – h + k Graph the function y = 2 – 1 . SOLUTION STEP 1 STEP 2 So, h = –4 and k = –1 . Shift the graph left 4 units and down 1 unit. x + 4 Sketch the graph of y = 2 . x y = 2 – 1 = 2 x – (–4) + (–1) . x + 4 Shift the graph h units horizontally and k units vertically. Notice that
- 4. GUIDED PRACTICE for Examples 4 and 5 5. Graph the function y = x + 3 and identify its domain and range. Compare the graph with the graph of y = x . Domain: x ≥ – 3 ; Range: y ≥ 0 ; Horizontal translation 3 units to the left ANSWER
- 5. GUIDED PRACTICE for Examples 4 and 5 6. Identify the domain and range of the function in Example 5 . The domain is x ≥ – 4 . The range is y ≥ –1 . ANSWER