Contenu connexe Similaire à Aberdeen executive sales and operations planning maturity levels and key solution criterion (may 2011) (1) Similaire à Aberdeen executive sales and operations planning maturity levels and key solution criterion (may 2011) (1) (20) 1. May, 2011
Executive Sales and Operations Planning
Maturity Levels and Key Solution Criterion
Sales and Operations Planning (S&OP) is the key integrated process that the Research Brief
supply chain organization (specifically the Chief Supply Chain Officer) can Aberdeen’s Research Briefs
leverage to achieve visibility and transformation across the entire provide a detailed exploration
organization and throughout the value chain. There are several stages in the of a key finding from a primary
maturity of S&OP processes, and associated technology enablers that can research study, including key
help companies reach them. In addition industry specific differences abound performance indicators, Best-
that complicate the process of gaining success with respect to S&OP. In this in-Class insight, and vendor
Research Brief, we will explore the current business challenges faced by insight.
companies, the priority allocated to S&OP, the maturity levels associated
with S&OP and the role of technology enablers.
Business Context
Thus far, 2011 has been an extremely challenging year with unstable
economic conditions, awful and unexpected catastrophic events, and
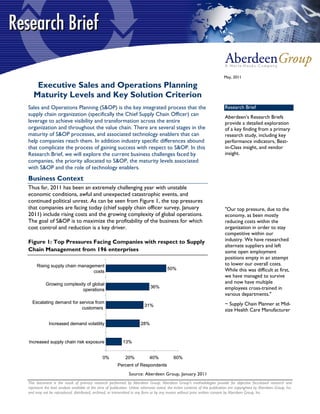
continued political unrest. As can be seen from Figure 1, the top pressures
that companies are facing today (chief supply chain officer survey, January "Our top pressure, due to the
2011) include rising costs and the growing complexity of global operations. economy, as been mostly
The goal of S&OP is to maximize the profitability of the business for which reducing costs within the
cost control and reduction is a key driver. organization in order to stay
competitive within our
Figure 1: Top Pressures Facing Companies with respect to Supply industry. We have researched
alternate suppliers and left
Chain Management from 196 enterprises some open employment
positions empty in an attempt
Rising supply chain management to lower our overall costs.
costs
50% While this was difficult at first,
we have managed to survive
Growing complexity of global and now have multiple
operations
36% employees cross-trained in
various departments."
Escalating demand for service from ~ Supply Chain Planner at Mid-
31%
customers size Health Care Manufacturer
Increased demand volatility 28%
Increased supply chain risk exposure 13%
0% 20% 40% 60%
Percent of Respondents
Source: Aberdeen Group, January 2011
This document is the result of primary research performed by Aberdeen Group. Aberdeen Group's methodologies provide for objective fact-based research and
represent the best analysis available at the time of publication. Unless otherwise noted, the entire contents of this publication are copyrighted by Aberdeen Group, Inc.
and may not be reproduced, distributed, archived, or transmitted in any form or by any means without prior written consent by Aberdeen Group, Inc.
2. Executive S&OP Maturity Levels and Key Solution Criterion
Page 2
According the research, the top areas of focus for companies in 2011were "We are reporting on historical
as follows: performance on sales, profit,
mix and inventory. We are
• Supply chain visibility (58%). Given the significant levels of tying all P&L projections
outsourcing, many companies have lost control and visibility to their directly to the top line
processes (Integrated Demand-Supply Networks: Five Steps to Gaining generated by S&OP and
preparing executive level P&L
Visibility and Control, March 2009). The growth of the supply chain
reporting with an outline of
for companies on both the buy-side as well as sell-side has resulted qualitative and quantitative
in visibility emerging as their top process area of focus. risks/opportunities. In addition
• Inventory management (56%). The expansion of the supply chain we are ensuring pricing, trade
into demand-supply networks necessitates the need for precision in spend, SG&A are in alignment
with latest movements from
sizing inventory buffers. The recent capital crunch has shifted the
S&OP."
focus towards working capital optimization - the key driver of which
is an organization's inventory levels, (Working Capital Optimization: ~ Director of Supply Chain at
Increase Cash Flow in the New Economy, May 2010). Large Consumer Electronics
Company
• Supply chain collaboration (50%). Collaboration has gained in
importance due to the rise in number of trading partners including
those in emerging countries. Also, the pareto rule no longer applies
when it comes to trading partners. In the past, companies could
only integrate and collaborate with the top 20% of their supplier
base which often formed as much as 80% of the revenue. This is no Definitions:
longer the case in many situations. The expanding number of trading √ Executive S&OP: The
partners has resulted in the need to expand collaboration process by which the
throughout the entire supply chain including the non-critical (long management review is
tail) suppliers (B2B Integration and Collaboration: Trading Community performed after the
Enablement for the Multi-Enterprise Supply Chain, March 2010). operational aspects of supply
review, demand review and
• Sales and operations planning (48%). S&OP has always been product review is performed
important to companies but now it is given even more attention in
today's dynamic business conditions. As past Aberdeen research has √ Operational S&OP: This is
identified, it is critical to look at S&OP as not a purely SCM function the process prior to the
executive S&OP where the
but as a business planning function that is tightly integrated with
demand patterns are
finance (Sales and Operations Planning: Strategies for Managing assessed to create
Complexity within Global Supply Chains, July 2010). unconstrained demand, the
The key pressures that companies are facing with respect to S&OP (in this supply constraints utilized to
report when we talk about S&OP, we are referring to the executive S&OP identify the constrained
demand
process defined in the callout box to the right) processes include the need
to reduce supply chain operating costs (53%) and the management of √ Integrated Business Planning:
increasing demand volatility (49%), which creates the need for balancing Level 3 of the S&OP
these mutually exclusive business pressures (Figure 2). All of these maturity which involves tight
pressures are competing against each other amidst an increased complexity integration with the Financial
of supply chain processes and the global nature of these supply chains. The Planning and Budgeting
view point of the supply chain organization follows the priority shown process
above.
© 2011 Aberdeen Group. Telephone: 617 854 5200
www.aberdeen.com Fax: 617 723 7897
3. Executive S&OP Maturity Levels and Key Solution Criterion
Page 3
Figure 2: Leading Pressures to Improve S&OP
59%
Improve top line revenue
45%
Reduce supply chain 53%
operating costs 56%
Management of increasing 49%
demand volatility 45%
Customer mandates for 40%
faster, more accurate and
more unique fulfillment 31%
Need to utilize 26%
manufacturing assets with 2009 2010
maximum efficiency 35%
0% 10% 20% 30% 40% 50% 60%
Percent of Respondents, n=196
Source: Aberdeen Group, July 2010
Other key stakeholders - Finance, Sales and Marketing
However, the finance organization has a slightly different viewpoint in terms Best-in-Class Companies:
of top pressures: 59% indicate that the top pressure is the need to improve
top line revenue and 53% indicate that the need to utilize manufacturing √ Experienced 81.9% forecast
assets with maximum efficiency is a key pressure. This illustrates that the accuracy level for three
months out into the future
perspective of the finance organization does not necessarily reflect the view
point of supply chain organizations. In order to truly obtain engagement of √ 97.2% of orders delivered to
the finance organization in S&OP, it is necessary to understand their customers complete and on
financial perspective on the business. Then it is easier to explain how the time
incorporation of their perspective in S&OP will help alleviate their top
√ Decreased cash-to-cash
pressures and align the organization to the business’s financial objectives. cycle time by 0.3% year over
In addition, today’s senior management looks to all functions for ways to year
weather the recession, while at the same time taking advantage of any
business opportunities that may arise from the current economic
conditions. The supply chain organization is being asked to deliver more
than just efficiency; it is also being asked to deliver innovative cost reduction
strategies. Capitalizing on such opportunities first requires visibility into the
extended supply chain – something many companies find difficult to achieve.
The sales and marketing organization(s), with their responsibility for
revenue generation and business expansion opportunities, also plays a key
role. Where revenue growth and expansion opportunities are scarce,
today's senior management looks to sales and marketing to enhance margins
and prevent share erosion, at the very least. These objectives are tied both
to extended supply chain costs/efficiencies and new product infusion.
© 2011 Aberdeen Group. Telephone: 617 854 5200
www.aberdeen.com Fax: 617 723 7897
4. Executive S&OP Maturity Levels and Key Solution Criterion
Page 4
To assist, product development is being asked to accelerate speed to
market and improve reliability through the product development cycle to
increase the percentage of sales from new products.
Conventional S&OP processes have failed to integrate these broader
lifeblood issues of the sales, R&D/Product Management, marketing and
financial business leaders into the process. Two examples of the broader
scope of the process are as follows:
• Product management: an important requirement of the process is
the integrating the results from portfolio and product life cycle
management into a Product Review process.
• Sales and marketing: the analysis and refinement of marketing plans,
sales account management tactics like pricing can be used as gap-
closing actions during the Demand review process.
Maturity Levels of Executive S&OP
Table 1 identifies the three levels of maturity that companies have with
respect to the executive S&OP process. Level 1 is the lowest level
(Laggards) and Level 3 is the IBP level (Best-in-Class).
Table 1: Sales and Operations Planning Competitive Framework
Level 1 Level 2 Level 3 (IBP)
Process S&OP process is S&OP process is Is a true integrated
ad-hoc, with more refined with business planning
disparate data some level of data process where all
sources and there synchronization and the organizations
is not a single organizational involved work
demand number mandates to arrive collaboratively to
based on which the at a single demand arrive at a single
company performs. number off of demand number off
Top-down forecast which the company of which the
is not tied to plan executes. company executes.
and there is no Margin and revenue
formal process. focus exists.
Organization S&OP process is S&OP process is Collaborative
non-standardized standardized across balanced cross-
across different different functional team
departments – no departments with takes ownership of
clear ownership of one of the the integrated
S&OP process. departments taking business planning
ownership of S&OP process. Finance
process. organization is
playing a more
leadership role in
the process.
© 2011 Aberdeen Group. Telephone: 617 854 5200
www.aberdeen.com Fax: 617 723 7897
5. Executive S&OP Maturity Levels and Key Solution Criterion
Page 5
Level 1 Level 2 Level 3 (IBP) Industry Focus
Knowledge Pockets of Some level of Information Industry: The research sample
information known sharing of available included respondents from the
at different information across instantaneously to four major industry segments -
departments. No departments; all parties with process, consumer, discrete
sharing of however there are cross-functional and high-tech/electronics.
information across still internal interdepartmental Please note: Respondents may
departments. barriers to focus. identify themselves in more the
overcome like one category, thus the
corporate politics percentages will not equal
and lack of cross- 100%. Key demographics are:
functional focus.
√ Discrete (26%): Aerospace
Technology Usage of Individual demand Executive-level and Defense (4%),
spreadsheets for and supply planning what-if analysis Automotive (4%), Industrial
enabling S&OP modules not capability along Equipment Manufacturing
process or non- integrated to each with integrated (9%), Industrial Product
integrated other. supply and demand Manufacturing (9%)
technology tools. planning modules
with ability to √ Consumer (40%): Apparel
optimize on (3%), Consumer Durable
financial metrics. Goods (4%), Consumer
Measurement Basic More advanced Cross functional Packaged Goods (8%),
measurements like measurements like metrics like order Consumer Electronics (4%),
forecast accuracy, forecast accuracy at fill rate, Wholesale/Distribution (7%),
capacity utilization individual SKU supply/demand Food/Beverage (9%), Retail
owned by individual level, family level, match, gross margin (5%),
departments. lead-times measured and √ Process (21%): Chemicals
measured and monitored as part (4%), Metals and metal
owned by individual of S&OP process. products/
departments but Mining/oil/gas/utilities (10%),
shared with Paper/lumber/timber (3%),
organization. Pharmaceutical
Source: Aberdeen Group, May 2011
manufacturing (4%)
√ High-tech/electronics (20%):
Three Best-in-Class Requirements for the S&OP Computer equipment and
peripherals (2%),
process enabler Health/medical/dental
• Ability to support scenario management and analytics. devices or services (9%);
Aberdeen research finds that Best-in-Class Companies are twice as High-technology (2%);
likely as all other companies to evaluate constrained planning Telecommunication
scenarios during supply demand balancing. Simultaneous equipment/services (7%)
consideration of supply, demand and finance is a key requirement.
Demand, including product / customer profitability and product mix
optimization should be supported. Financials should be both a
constraint and an output. All of these elements must be considered
simultaneously and not in silos
• Support for collaboration with internal and external
stakeholders. Consideration of sales pricing, service policy and
promotions as a key driver of demand and being able to integrate
© 2011 Aberdeen Group. Telephone: 617 854 5200
www.aberdeen.com Fax: 617 723 7897
6. Executive S&OP Maturity Levels and Key Solution Criterion
Page 6
the product management organization within the S&OP process.
Integrating the sales data into the S&OP process is critical but
companies are challenged with this due to the lack of a
collaboration platform that captures sales input in an effective
manner.
• Financial planning integration. Best-in-Class companies are
twice as likely as all others ability to evaluate and optimize inventory
and service policy to maximize cash flow and profitability as part of
the S&OP process. In addition Best-in-Class companies are three-
times as likely as all others to have the ability to express the S&OP
plan in terms of revenue and margins
Typical S&OP solutions support the right hand side of the picture (Figure 3)
and move to the left but an ideal S&OP solution should start from the
financial picture in the left and move toward the right towards supply chain
capabilities.
Figure 3: Financial Profitability Drives S&OP Tactics
Ideal Approach for S&OP
Business Goals IBP Levers
Financial Planning
Levers
Product Differentiation Pricing
Boost Customer Service Demand Forecasting
Shareholder
Demand Shaping
Value Cost Reduction Results
Rough Cut Capacity Planning
Working Capital Inventory Optimization
Revenue Expansion New Product Introduction
Profit Optimized Supply -
Demand Planning
Metrics: Return on Net Assets, Profit Margins, Cash-Cash-Cycle
Customer Service Levels, Forecast Accuracy
How it is currently done
Source: Aberdeen Group, May 2011
Financial modeling needs to be very deep in order to properly consider and
evaluate impact on working capital, profits, cash flow and other financial
metrics. In addition, the financial modeling needs to replicate the company’s
reporting structure in order to feed directly into the budgeting and planning
process including modeling multi-currency, differential tax rates and partial
ownership situations.
© 2011 Aberdeen Group. Telephone: 617 854 5200
www.aberdeen.com Fax: 617 723 7897
7. Executive S&OP Maturity Levels and Key Solution Criterion
Page 7
Industry Specific Capability Requirements of S&OP
Table 2 shows the industry specific requirements of the Executive S&OP
process for the 4 key industry segments (the breakdown is shown in the
callout box).
Table 2: Industry Specific Requirements of S&OP Across Demand,
Supply and Product Characteristics
Industry Demand Supply Product
Process Focus on long term Long lead-time Mostly Build to
statistical manufacturing Stock
forecasting process which is Reverse Bill of
campaign focused Materials
(larger volumes of
production with a
single set up and
long set up times)
Discrete Statistical Long lead-time Build to Order mix
forecasting at SKU operations with with Build to Stock
level has limited assembly line Highly configured
application. manufacturing product with large
Requires attach rate multi-level BOM to
forecasting at SKU level simple
component level products
High-Tech Highly dynamic Long lead-time Configure to Order
nature of business operations Very rapid product
operations requires upstream but rapid lifecycles makes
that demand ability to configure product phase in
patterns are products phase out critical
updated at high downstream
frequency
Consumer Understanding Has characteristics Build to Stock
demand patterns of of process Product lifecycles
consumers critical manufacturing but are short and large
to business success. smaller lead-times number of SKU
Statistical variants to address
forecasting consumer demand
augmented with
causal forecasting
(promotion planning
and event
management)
Source: Aberdeen Group, May 2011
Role of Technology
Best-in-Class companies are now leveraging technology as a differentiator as
shown in Figure 4. In addition to the traditional areas associated with
© 2011 Aberdeen Group. Telephone: 617 854 5200
www.aberdeen.com Fax: 617 723 7897
8. Executive S&OP Maturity Levels and Key Solution Criterion
Page 8
inventory planning, demand and supply planning, Best-in-Class companies
are also getting differentiation with the areas around executive reporting.
We still see rampant usage of spreadsheets across all the categories - 84%
of overall respondents indicate that they are using spreadsheets to support
the enablement of the S&OP process. Fifty-two percent (52%) of
respondents indicate the usage of integrated ERP modules. Twenty-one
percent (21%) of these respondents indicate the use of best of breed
solutions whereas 31% still utilize custom legacy systems. Thirty-eight
percent (38%) of respondents utilize business intelligence solutions. The
variety of technology adoption approaches is due to the fundamentally inter-
disciplinary and customized nature of the S&OP process for each
organization.
So given the large number of touch points in terms of roles associated with
the S&OP process, the solution adopted by enterprises should enable
integration across planning, business intelligence and optimization. An ideal
approach is to utilize a solution that can perform financial planning and
supply chain planning in the same platform.
Figure 4: Technology Adoption with Respect to S&OP Related
Areas
58%
Supply Planning 28%
26%
53%
Demand Planning 33%
30%
51%
Inventory planning 32%
26%
Executive 33% Best-in-Class
reporting/dashboards 24% Average
19% Laggard
0% 10% 20% 30% 40% 50% 60%
Percent of Respondents, n=196
Source: Aberdeen Group, April 2011
Case Study: Building Material Industry Illustrates the
Importance of S&OP
Owens Corning Utilizes S&OP to Manage Rising Energy Costs and
Housing Market Downturn
Owens Corning offers insulation, roofing, basement finishing, acoustic
systems for building and remodeling, composites solutions and asphalt.
© 2011 Aberdeen Group. Telephone: 617 854 5200
www.aberdeen.com Fax: 617 723 7897
9. Executive S&OP Maturity Levels and Key Solution Criterion
Page 9
Owens Corning is organized into two business divisions – building materials
and composite solutions. Their revenue was around $5 Billion USD in 2010.
The focus of this case study is on the building materials division. The
customers of the building materials division are retailers, distributors and
contractors. The primary products manufactured by this division are asphalt
roofing shingles and glass insulation products. There are 31 plants along with
three distribution centers located in Canada and the US for this business.
The raw materials are purchased from a variety of global suppliers.
The biggest challenge facing Owens Corning is the economic conditions
resulting in a tremendous drop in new house construction. There has been
no precedence to such a drop off in market demand. Previous recession
cycles have been predictable. Exacerbating the challenge is the increasing
energy costs and the tight transportation market. The commercial market
has been affected as well but not as significantly as the residential building
materials market
In order to manage the situation, Owens Corning has initiated a major
S&OP initiative. They have started the focus of their S&OP from the
customer inwards. The big focus has been on getting closer to their
customers and understanding their needs. They are looking to improve
cycles and to provide reliability to their customers. There is a lot of work
happening on inventory management to identify the right mix of products to
be sold. The critical S&OP metrics that are looked at are order fill rate, on
time delivery, working capital, days inventory outstanding, and forecast
accuracy. The organization is focusing significant efforts on S&OP processes
looking at KPIs with the intent to improve service and manage costs
Owens corning has also started a technology initiative to upgrade existing
systems including the ERP and Advanced Planning and Scheduling systems.
Their corporate finance is also using a solution called Business Planning and
Consolidation to rollup the financial data from global organizations. There is
an opportunity to implement an S&OP solution using the same platform.
Case Study: Chemical Manufacturing Industry
Illustrates the Role of Knowledge Management, Data
and Organization
S&OP Anchors Supply Chain Transformation Project at Dupont
DuPont offers a wide range of products and services for markets including
agriculture, nutrition, electronics, communications, safety and protection,
home and construction, transportation and apparel. DuPont operates in
over 90 countries with 2010 revenues of over $31.5 billion with 60,000
employees worldwide. DuPont has over 14 different business divisions
ranging from crop protection, food and nutrition, seeds, commodity
chemicals, refrigerants, polymers, paints, pigments, electronics and
communication technologies.
© 2011 Aberdeen Group. Telephone: 617 854 5200
www.aberdeen.com Fax: 617 723 7897
10. Executive S&OP Maturity Levels and Key Solution Criterion
Page 10
DuPont has over 95 + supply chains with around 300 different product
families. It has a very complex supply chain structure with a large number of
SKUs. There is a need to rationalize the number of SKUs to avoid storing
excess inventory of low volume, slow moving SKUs. DuPont has had a
significant focus on S&OP over the course of several years with some
business units making significant progress. However they have realized that
the S&OP process was unsustainable due to a lack of organization, data,
knowledge management and technology capabilities. DuPont had worked
with a leading S&OP process consulting provider to institute a strong
process but faced many challenges institutionalizing it.
The fact that DuPont is in the process manufacturing industry brings about
unique challenges as well. They have to deal with multiple stages in global
supply chain, with a lack of coordination and synchronization across their
end to end supply chain. They have to deal with higher working capital and
poor customer service.
So what are the corrective actions that DuPont is taking?
From a knowledge management standpoint, DuPont is focusing on creating a
Business Process Management (BPM) repository. In other words, DuPont is
documenting their S&OP processes in a single central repository and they
are instituting a core set of people who can keep this going, manage, and
train the people in the execution of the S&OP process. There will be a
central core group of people who will manage this repository. BPM is being
used to highlight the connectivity and integrated nature of the supply chain.
From a data standpoint, it was realized that there needs to be a
reconciliation of data. For example, multiple regions are using different
terminology when it comes to products, customers or services. This causes
challenges in creating a corporate dashboard where aggregation of data is
critical. There is also no standardized relationship defined between various
hierarchies across divisions, which make it difficult to perform ad-hoc
business intelligence reporting.
From an organizational perspective, the General Managers of the business
units are the owners of the S&OP process but they also have a centralized
supply chain competency center.
Finally from a technology standpoint, DuPont realizes that their existing
S&OP technology is inadequate to scale and will evaluate S&OP application
integrated with financial scenario planning for their corporate roll out.
Case Study: Apparel Industry illustrates S&OP Phase I
& II - Consensus Demand Forecasting and Collaboration
Under Armour Gets to a Single Number Forecast to Drive S&OP
Demand Review
Under Armour Inc. is a developer of branded performance apparel,
footwear, and accessories. Founded in 1996, they have been enjoying a
© 2011 Aberdeen Group. Telephone: 617 854 5200
www.aberdeen.com Fax: 617 723 7897
11. Executive S&OP Maturity Levels and Key Solution Criterion
Page 11
meteoric growth to around $850 Million in 2010. They have achieved
tremendous brand loyalty among consumers who range from young people
to professional athletes.
Rapid growth brings with it huge challenges in terms of supply chain. Under
Armour had to deal with rapidly increasing number of SKUs with very short
product lifecycles in a highly fashion centric environment. They did not
really have a consensus forecasting process even though there was feedback
from sales, finance, merchandizing, etc.
They decided to implement a demand management solution from SAP to
create a collaborative, one number consensus forecast. But the process was
instituted first before launching the implementation. Sales planners, demand
planners and merchandize planners all were included in the process
definition stage and had accountability in process design. Once the process
was designed, the implementation was done of the SAP Demand and Supply
planning solutions.
An important part of this implementation was that not only was a consensus
demand planning solution implemented, there was also a business
intelligence solution instituted. This allowed Under Armour to perform
exception management with alerts and provide the ability to visualize the
data and prepare reports. Under Armour also sends the results of the
consensus demand plan to the financial plan which is managed by the BPC
solution also provided by SAP.
These have resulted in both qualitative as well as quantitative benefits.
Under Armour has reduced inventory by around 20% and improved
forecast accuracy by 10%. They have reduced data collection activities by
2/3 of what they used to do previously. This has resulted in better visibility
of customer demand and an improved ability to execute. Now Under
Armour is looking to improve other aspects of their S&OP process and
acknowledge that process improvement is a continuous initiative and they
have only scratched the surface.
Case Study: Apparel Industry Illustrates S&OP Maturity
Phase 3 - Integrated Business Planning
ASICS Creates Cash Flow Statement from Sales Plan and Cost Data
ASICS is a leading designer and manufacturer of running shoes as well as
other athletic footwear, apparel and accessories. ASICS is headquartered in
Japan and ASICS America is headquartered in Irvine CA. ASICS America has
around 300 employees with 2009 net sales of around $567 Million. ASICS
identified that their existing financial planning process had several gaps – it
was driven by static cost drivers, it had an inflexible planning period and had
no real-time adhoc reporting. Overall the planning cycle times were long
and had no collaborative component.
ASCIS decided to do a process reengineering effort wherein they would
integrate the sales and financial planning to streamline the process. This way
© 2011 Aberdeen Group. Telephone: 617 854 5200
www.aberdeen.com Fax: 617 723 7897
12. Executive S&OP Maturity Levels and Key Solution Criterion
Page 12
both the top down management budgeting element as well as the bottom up
sales element were incorporated. In order to implement this process with
respect to technology, the SAP Business Planning and Consolidation module
was utilized. The inputs from the sales planning in terms of projected
forecasts as well as the cost budgeting is converted to a cash flow
statement. This is an example of a company that is trying to bridge the
S&OP to the financial planning process. By doing this, ASICS was able to
reduce the planning cycle time by more than 50%.
Recommended Actions
• Create the ability to perform detailed scenario
management, simulation and optimization. Only 23% of Best-
in-Class companies indicate that they have a strong ability to create
upside opportunity assessment scenarios to analyze an S&OP plan.
Ideally, the optimization and what-ifs should include the ability to set
financials as the objective function and to toggle back and forth
across different metrics as the objective function for proper
analysis.
The ability to support decisions on product line, price policy, capital
expenditures, financial policy, network design, open/close, supply
chain policy, etc. are also part of the S&OP scenario management
framework.
Without optimization, scenarios cannot be compared on an apples
to apples basis. Optimization does this by making sure each scenario
represents “the best the company can do” under the specific sets of
assumptions. For example, different scenarios might require
different production allocation, different use of raw materials, etc.
• Create the ability to do root cause analysis. Only 25% of
Best-in-Class companies indicate that they have a strong ability to
identify the cause of an S&OP metric being off-target. Significant
time is wasted in organizations in diagnosing the “why” even though
the “what” is known. This is an area where even Best-in-Class
companies struggle. Persona based supply chain analytics solutions
should be leveraged to create detailed business process playbooks
that are industry specific to support this requirement.
• Become adept at providing high-level reporting designed
for executive management. Only 22% of Industry Average
companies are able to generate high-level reporting as compared to
54% of Best-in-Class companies. Given the large number of
stakeholders involved in the S&OP process, companies must have a
systematic way of identifying accountability and resolution/escalation
mechanisms.
For more information on this or other research topics, please visit
www.aberdeen.com.
© 2011 Aberdeen Group. Telephone: 617 854 5200
www.aberdeen.com Fax: 617 723 7897
13. Executive S&OP Maturity Levels and Key Solution Criterion
Page 13
Related Research
Supply Chain Intelligence: Adopt Role- Integrated Demand-Supply Networks: Five
Based Operational Business Intelligence Steps to Gaining Visibility and Control;
and Improve Visibility; Feb 2010 March 2009
Sales and Operations Planning: Strategies Multi-enterprise Manufacturing: The Role
for Managing Complexity within Global of Visibility and Collaboration in Driving
Supply Chains; July 2010 Responsiveness; July 2009
Author: Nari Viswanathan, Vice President / Principal Analyst, Supply Chain
Management (nari.viswanathan@aberdeen.com)
For more than two decades, Aberdeen's research has been helping corporations worldwide become Best-in-Class.
Having benchmarked the performance of more than 644,000 companies, Aberdeen is uniquely positioned to provide
organizations with the facts that matter — the facts that enable companies to get ahead and drive results. That's why
our research is relied on by more than 2.5 million readers in over 40 countries, 90% of the Fortune 1,000, and 93% of
the Technology 500.
As a Harte-Hanks Company, Aberdeen’s research provides insight and analysis to the Harte-Hanks community of
local, regional, national and international marketing executives. Combined, we help our customers leverage the power
of insight to deliver innovative multichannel marketing programs that drive business-changing results. For additional
information, visit Aberdeen http://www.aberdeen.com or call (617) 854-5200, or to learn more about Harte-Hanks, call
(800) 456-9748 or go to http://www.harte-hanks.com.
This document is the result of primary research performed by Aberdeen Group. Aberdeen Group's methodologies
provide for objective fact-based research and represent the best analysis available at the time of publication. Unless
otherwise noted, the entire contents of this publication are copyrighted by Aberdeen Group, Inc. and may not be
reproduced, distributed, archived, or transmitted in any form or by any means without prior written consent by
Aberdeen Group, Inc. (2011a)
© 2011 Aberdeen Group. Telephone: 617 854 5200
www.aberdeen.com Fax: 617 723 7897