Green Building And Low Carbon Building in Malaysia

This document discusses low carbon green buildings and provides examples from Malaysia. It begins by explaining the relationship between climate change, greenhouse gases, and green technology/living as a solution. Green technology is defined as minimizing environmental degradation while having low or zero greenhouse gas emissions. Key aspects of green buildings discussed include energy efficiency, water management, materials used, and more. The Low Energy Office (LEO) building in Malaysia is provided as an example, highlighting its solar panels, rainwater harvesting, and energy-efficient lighting and equipment that have reduced its energy consumption to below the national guideline. Continuous improvement of government buildings in Malaysia to reduce their carbon footprint and energy usage is also noted.

Recommandé
Contenu connexe
Tendances
Tendances (20)
Similaire à Green Building And Low Carbon Building in Malaysia
Similaire à Green Building And Low Carbon Building in Malaysia (20)
Plus de Steve Lojuntin
Plus de Steve Lojuntin (6)
Green Building And Low Carbon Building in Malaysia
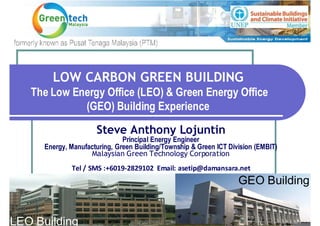
- 1. LOW CARBON GREEN BUILDING The Low Energy Office (LEO) & Green Energy Office (GEO) Building Experience Steve Anthony Lojuntin Principal Energy Engineer Energy, Manufacturing, Green Building/Township & Green ICT Division (EMBIT) Malaysian Green Technology Corporation Tel / SMS :+6019-2829102 Email: asetip@damansara.net GEO Building LEO Building
- 3. RELATION BETWEEN CLIMATE CHANGE, GHG AND GREEN TECHNOLOGY PROBLEM! SOLUTION! CLIMATE CHANGE GREEN IS THE PROBLEM TECHNOLOGY AND [MAINLY CAUSED GREEN LIVING IS BY GREEN HOUSE THE SOLUTION GASES (GHG)] GHG : Carbon dioxide, Methane, NOx, SOx, CFC, etc
- 4. Green Technology? Green technology is the development and application of products, equipment, and systems used to conserve the natural environment and resources, which minimises and reduces the negative impact of human activities Minimises the degradation of the environment. It has zero or low green house (GHG) emission. It safe for use and promotes healthy and improved environment for all forms of life It conserves the uses of energy and natural resources; and It promotes the use of renewable resources.
- 5. Brief about Green Building What are Green or Sustainable buildings ? • Save energy and resources, recycle materials and minimise the emission of toxic substances throughout its life cycle, • Harmonise with the local climate, traditions, culture and the surrounding environment, and • Able to sustain and improve the quality of human life whilst maintaining the capacity of the ecosystem at local and global levels. • Savings and increase workplace productivity.
- 6. Brief about Green Building Green Technology Green Habits / Involved Thinking - Energy - Awareness / Responsibility - Indoor Environment - Procurement - Water Management - Operation & Maintenance - Material used - Recycling - Site construction - Green / Sustainable / Low Carbon Buildings
- 7. Common Green Building Criteria
- 8. General Green Building System Alternative under Conventional Green Building System development LOW CARBON BUILDING PRIVATE INITIATIVE (Malaysia) 1. Energy 2. Water 3. Indoor environme nt 4. Waste Gov. Initiatives -CASBuild for BCIS (GreenTech Malaysia – consultancy projects) - GreenPASS (CIDB)
- 9. Good New to the Industry Low Carbon Building System
- 10. Carbon emission in a life cycle of a building Pre - Normally addressed by , D li ne n / Design De esig vel n & most Green Building ec litio ion D o at op Tools me em ner D ge nt [Embodied CO2 footprint] re Building Lifecycle Use, Management & Maintenance [Higher CO2 footprint] FACT! Most of the CO2e emission is during the operation phase !! Only Low Carbon Building Assessment System address this issue !!!
- 11. Brief about Low Carbon Building What are the Low Carbon buildings ? • Low Carbon Building is similar to the conventional green building system which promotes uses of green technology and green habits to reduce the degradation of the environment. • Use Carbon as metric for references to achieve the actual environment impact and not based on points collected. • Use UNEP SBCI Common Carbon Metric.
- 12. Brief about Low Carbon Building What are the Low Carbon buildings ? • Straight forward, transparent, easy to implement, consistance, easy to monitor since based on actual performance. Measurable, recordable, comparable, justifiable, can be monitor and easy to proof. • Cheaper and affordable since it is straight forward and focus only the relevant criteria that have high impact (lower $$$/CO2 reduction cost). • Global trend - Relevant and gain popularity at international level.
- 13. Why Low Carbon Building System is Affordable ? Cheaper way The longer the way = $$$$$
- 14. Carbon Exist in Most of the Green Building Criteria
- 15. WHERE DOES THE CARBON COME FROM?
- 16. Chances to reduce carbon emission Building sector has the higher chances to reduce carbon emission in a township Sumber: Laporan IPCC
- 17. WHY LOW CARBON GREEN BUILDING IS SUPERIOR? Easy to evaluate the actual performance through its life cycle. Straight forward and transparent of accounting emissions through carbon footprint. Has potential for carbon trading purposes (if applicable). Complement to the existing conventional GB system by helping to narrow the gap and maturing the green building industry. Supporting government efforts for reaching national climate reduction target for 2020 Provide flexibility for designers to achieve the design target. Economical and affordable by all stakeholders
- 18. Green Technology / application in Buildings to reduce carbon foot print -The green technology in building is mostly refer to the technology and applications that has impact to the Energy and Environment related to building services a) Design : Energy Efficiency, Renewable Energy & Water Management. b) Office appliances c) Operation: Energy management in the O&M. d) Renovation / retrofits e) Other - Paper and water recycling - Indoor air quality. - Solid waste management / separation f) End users awareness
- 19. Relation between use of energy and the environment 0.684 kg of CO2 emitted to the atmosphere for each 1 kWh electricity generated by power plant (Peninsula Malaysia) Kawasan 2007 Semenanjung Malaysia 0.684 kg CO2 / kwj Sarawak 0.873 kg CO2 / kwj Kawasan Barat Sabah 0.807 kg CO2 / kwj Kawasan Timur Sabah 0.709 kg CO2 / kwj Sumber: Laporan Penanda Aras Clean Development Mechanism (CDM) Malaysia 2007 oleh Pusat Tenaga Malaysia.
- 20. Examples of EE, RE & Green Building in Government Building
- 21. Continuous Improvement project of Energy Efficient / Low Carbon buildings in Malaysia Energy Indices ( kWh/m2year) 300 Typical Consumption 250 200 – 300 kWh/m2year 200 EE in Building Guideline (1989), reference for MS1525 150 136 100 50 Energy Consumption 0 Green Energy (PV) Normal LEO EC GEO Buildings Building Building Building Solar Electric Benchmark year: 2001 generation 2006 ( 2015) MS 1525:2007 – Code of Practise Use of EE & RE for Non-residential buildings
- 22. Understand the factors affecting the energy consumption in buildings that contribute main carbon emission
- 23. KeTTHA’s Low Energy Office (LEO) Building : ENERGY DESIGN ELEMENTS
- 24. LEO : SUSTAINABLE ELEMENTS • Solar PhotoVoltaic – Building grid connected • Rain water harvest system
- 25. Energy Saving Features in LEO Building ENERGY-10 Optimisation EE in Building Guideline Target Reference Case 275 Daylight use 247 Insulation in walls and roof 239 EE Lighting 22 - 16 223 Equipment 27 - 20 195 EE Light 16 - 8 173 EE Equipment 20 - 7.5 123 "Energy Manage ment” 112 Room Temp 23 - 24 degrees 102 Especially Tight Building 100 0 100 1000 200 300 Energy Index kWh/m2 ye ar
- 26. Monitoring & Performance Mo nth ly En erg y Ind ex fo r Energy Index kW h /m2/year] Building L EO Bu ild in g [ 160 (Based on Energy Bills) 160 149 149 Average 140 Current 140 Target 128 128 128 114 124 124 123 124 122 122 122 122 122 121 124 120 120 124 120 119 122 118 123 118 118 120 122 121 122 117 116 116 116 116 115 120 115 114 Energy Index [kWh/m2/year] 118 113 113 115 117 112 113 116 116 111 120 120 110 111 110 113 114 109 109 108 108 108 112 1 12 107 1 11 111 106 106 106 105 109 109 108 110 103 107 108 108 102 106 106 106 100 105 100 100 103 102 99 100 100 97 97 99 [kWh/m2/yr] 100 95 97 97 94 100 95 94 94 94 93 93 92 94 92 92 91 90 91 92 92 90 90 90 90 90 89 90 89 89 89 90 88 90 87 88 88 88 89 90 87 87 87 8 9 88 87 87 87 8 8 8 7 86 85 83 82 81 83 83 80 80 81 80 80 82 79 79 79 8 0 8 1 7 9 80 78 78 78 79 80 77 7 8 8 0 8 1 79 78 77 77 76 80 78 77 74 76 73 80 73 74 64 64 64 60 60 38 38 4036 35 35 36 36 33 33 34 32 38 38 31 32 32 31 31 32 31 30 30 30 30 30 29 30 29 29 30 30 40 35 29 29 35 33 28 27 28 28 33 27 27 3 1 30 32 26 26 26 26 32 25 26 25 25 30 3 1 3 2 29 25 24 31 30 24 24 24 29 28 27 29 30 23 29 29 27 27 29 20 26 2 5 2 6 25 26 26 18 24 24 16 23 20 20 16 20 18 - - 0 0 Design Oct 04 Nov 04 Dec 04 Jan 05 Feb 05 Mac 05 April 05 May 05 June 05 July 05 Aug 05 Sept 05 Oct 05 Nov 05 Dec 05 Jan 06 Feb 06 Mac 06 April 06 May 06 June 06 July 06 Aug 06 Sept 06 Oct 06 Nov 06 Dec 06 Jan 07 Feb 07 Mac 07 April 07 May 07 June 07 July 07 Aug 07 Sept 07 Oct 07 AVERAGE AVERAGE Chilled Water-Cooling Index [kWh/m2/yr] Electrical Energy Index [kWh/m2/yr] Bui lding Energy Index [kWh/m2/yr] Cooling Energy C ons um ption [kW h] Elec trical Energy C ons um ption [kW h] Building Energy Index [k W h/m 2/yr] Month
- 27. COMPARISON OF BUILDING ENERGY INDEX FOR PARCEL B WITH LEO BUILDING (E4/5) Average Building Energy Index (BEI) in Parcel B [kWh/m2/yr] 400 378 349 350 321 322 315 296 300 268 278 273 253 250 236 233 [kWh/m2/yr] 215 196 198 200 167 150 123114 100 50 - B1 B2 B3 B4 B5 B6 B7 B8 E4/5 AVERAGE (3276 hrs/yr) AVERAGE (Normalised to 2646hrs/yr) Blocks
- 28. GreenTech Malaysia’s Green Energy Office (GEO) Building : DESIGN ELEMENTS - Daylighting (almost 100%) - EE lighting + task lights - EE office equipment (laptops, LCD monitors, networked printers) - Green IT Network & server room (75% wireless network) - EE air conditioning & ventilation - Floor slab cooling (For radiant cooling and thermal storage) - PCM storage cooling system (minimised air-cond chillers capacity) - Controls & Sensors (VSDs, VAVs, CO2, BMS / Energy monitoring) - Double glazing (heat and sound insulation) - Roof and wall Insulation (reduce outside heat gain) - Grid connected BIPV system (Sell energy to TNB / no batteries) - Rain water harvest system (landscape, aircond and cleaning)