Generalized Needs Assessment Scenarios for Transportation Infrastructure
•
1 j'aime•345 vues

How we should assess the need of any infrastructure depending on their availability or non-availabilty in short or long term. How we assess the cost associated with it and then prepare a optimal plan for short or long term investment in building infrastructures.

Recommandé
Contenu connexe
Dernier
Dernier (20)
En vedette
En vedette (20)
Generalized Needs Assessment Scenarios for Transportation Infrastructure
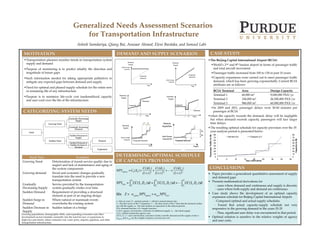
- 1. Generalized Needs Assessment Scenarios for Transportation Infrastructure ! Ashish Samdariya, Qiang Bai, Anwaar Ahmed, Eleni Bardaka, and Samuel Labi! MOTIVATION! DEMAND AND SUPPLY SCENARIOS! CASE STUDY! § Transportation planners monitor trends in transportation system § The Beijing Capital International Airport (BCIA) ! Demand, Demand, Demand, Demand, supply and demand ! Supply Supply Supply Supply § World’s 2nd and 8th busiest airport in terms of passenger traffic Initial System System Initial § Purpose of monitoring is to predict reliably the direction and Capacity Capacity Demand, and total aircraft movement.! Supply magnitude of future gaps ! § Passenger traffic increased from 100 to 130 in past 10 years. ! ProjectedProjected ProjectedProjected § Such information needed for taking appropriate palliatives to Demand Demand Capacity Demand Demand § Capacity expansions were carried out to meet passenger traffic Initial System System Initial mitigate any expected gaps between demand and supply. ! (Linear) (Linear) Capacity Capacity ! (Linear) (Linear) demand, which has been growing exponentially. Current BCIA Demand (i) Time (i) Time Time (ii) Time attributes are as follows:! § Need for optimal and phased supply schedule for the entire new (ii) t ! Time ! or remaining life of any infrastructure! (e) *# BCIA Terminal! Area! Design Capacity! Demand, Terminal 1! 60,000 m2! 9,000,000 PAX/yr! § Purpose is to minimize life-cycle cost (underutilized capacity Demand, Supply Demand, Supply and user cost) over the life of the infrastructure.! Demand Supply Terminal 2! 336,000 m2 ! 26,500,000 PAX/yr! Demand Terminal 3! 986,000 m2 ! 60,000,000 PAX/yr! Capacity Capacity Capacity § In 2009 and 2011, passenger delays were 30-60 minutes per ! ! ! CATEGORIZING SYSTEM NEEDS ! Demand passenger at BCIA! t Time t *# t**# Time t t**# Time § when the capacity exceeds the demand, delay will be negligible Gradually Decreasing (c) *# (d) (f) Supply! ! *# ! but when demand exceeds capacity, passengers will face larger Growing Need! ΔT! ΔT! time delays. ! Demand, Gradually Increasing Demand! Supply ΔS! ΔS! § The resulting optimal schedule for capacity provision over the 35 Need! ! ! year analysis period is presented below:! 80 80 Passenger Traffic (in M) Sudden Decrease in Supply! Initial System 70 Demand (D) "Capacity (C)" 70 Capacity (in M) Capacity 60 60 Sudden Need! Planned! Projected Demand Sudden Demand or 50 50 Sudden Increase in (Linear) Time 40 40 Demand! Unplanned! 30 30 20 20 10 10 Need Type! Examples! DETERMINING OPTIMAL SCHEDULE 0 0 0 5 10 15 20 25 30 35 40 Growing Need! Deterioration of transit service quality due to OF CAPACITY PROVISION! ! Year (1975-2010) neglect and lack of maintenance and aging of ! the system components ! C(ΔS1 ) C(ΔS2 ) C(ΔSm ) CONCLUSIONS! NPVAgency = C0 (S0 ) + + ++ Growing demand ! Social and economic changes gradually (1+ r)T1 (1+ r)T2 (1+ r)Tm § Paper provides a generalized quantitative assessment of supply translate into the need to provide a new and demand gaps! transportation system ! ! T1 T2 N Gradually Service provided by the transportation NPVUser = ∫ * UC(St , Dt ,t)dt + ∫ * UC(St , Dt ,t)dt + ∫ * UC(St , Dt ,t)dt § Presents mathematical derivations for! T1 T2 Tm !- cases where demand and continuous and supply is discrete; Decreasing Supply! system gradually erodes over time! - cases where both supply and demand are continuous. ! Sudden Demand! Requirement of providing a structural element as part of an ongoing design ! Min Z = wagency NPVAgency + wuser NPVUser § Case study shows the development of an optimal capacity expansion schedule for Beijing Capital International Airport.! Sudden Surge in Where natural or manmade events t-- time in years; N-- analysis period; r-- effective annual interest rate; ! ! !- Compared optimal and actual supply schedules ! Demand! overwhelm the existing system ! Ti-- the time (year) of the ith expansion; T*i -- the time (year) of the ith time that the demand catches up with the supply; m-- the total number of expansions in the analysis period; ! ! !- Found that actual capacity-supply schedule not very !!! Sudden Decrease in Sudden failure of a bridge! D(t)--demand function; S(t)--Supply function;! responsive to the growing demand in the years 25-35! Supply! C(ΔS)--agency cost function, a function of additional supply; S0 -- the initial supply; ! Growing populations, demographic shifts, and expanding economies and other C(S0) --Initial construction agency cost; ! ! ! - Thus, significant user delay was encountered in that period.! UC(St, Dt, t,) --user cost function, a function of time t and the demand and the supply at time t; development sectors translate constantly into the need for new or expansions in wagency and wuser are the weights of agency cost and user cost ! § Optimal solution is sensitive to the relative weights of agency highways and streets, urban commuter rail, water ports, airports, pipelines, and other and user costs.! transportation infrastructure.!