SlideShare une entreprise Scribd logo
1  sur  6
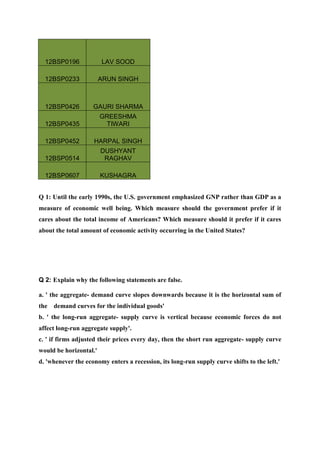
12BSP0196             LAV SOOD

  12BSP0233             ARUN SINGH


  12BSP0426         GAURI SHARMA
                        GREESHMA
  12BSP0435              TIWARI

  12BSP0452         HARPAL SINGH
                        DUSHYANT
  12BSP0514              RAGHAV

  12BSP0607             KUSHAGRA


Q 1: Until the early 1990s, the U.S. government emphasized GNP rather than GDP as a
measure of economic well being. Which measure should the government prefer if it
cares about the total income of Americans? Which measure should it prefer if it cares
about the total amount of economic activity occurring in the United States?


Q 2: Explain why the following statements are false.

a. ' the aggregate- demand curve slopes downwards because it is the horizontal sum of
the demand curves for the individual goods'
b. ' the long-run aggregate- supply curve is vertical because economic forces do not
affect long-run aggregate supply'.
c. ' if firms adjusted their prices every day, then the short run aggregate- supply curve
would be horizontal.'
d. 'whenever the economy enters a recession, its long-run supply curve shifts to the left.'
12BSP0682        MOHIT CHAUHAN
  12BSP0687          MOHIT LOHIA
  12BSP0818         PALLAVI BHASIN
  12BSP0825        PANKAJ SHARMA
                   PRASOON KUMAR
  12BSP0883             SINGH
  12BSP1079         SAKSHI KAPILA
                      SIDHARTH
  12BSP1218          MANCHANDA


Q 1: Below are some data from the land of milk and honey.

Years              Price of Milk      Quantity       of Price of Honey   Quantity     of
                                      Milk (quart)                       Honey (quarts)
2005               $1                 100                $2              50
2006               $2                 200                $2              100
2007               $3                 200                $4              100


   a. Compute nominal GDP, real GDP and GDP deflator for each year, using 2005 as
        a base year.
   b. Compute percentage change in nominal GDP, real GDP and the GDP deflator in
        2006 and 2007 from the preceding year. For each year, identify the variable that
        does not change. Explain in words, why your answer makes sense.
   c. Did economic well-being raise more in 2006 or 2007? Explain.


Q 2: what might shift the aggregate demand curve to the left? Use the model of
aggregate demand and aggregate supply to trace through the short run and long run
effects of such a shift on output and the price level.
12BSP1334           UDAY KUMAR
12BSP1336       UDIT PRATAP SINGH
12BSP1440          SURABHI DAS
12BSP1464        KSHIPRA GANGAY
12BSP1558         MANALI MATHUR
12BSP1599          SAHIL ARORA
                 AVINASH KUMAR
12BSP1658             SINGH


Q 1: one day Barry and Barber, Inc., collects $400 for haircuts. Over this day, his
equipment depreciates in the value by $50. Of the remaining $350, Barry sends $30 to
the government in sales taxes, takes home $220 in wages, and retains $100 in his
business to add new equipments in the future. From the $220 that Barry takes home, he
pays $70 in income taxes. Based on this information, compute Barry’s contribution to
the following measures of income.

   a. Gross Domestic Product
   b. Net National Product
   c. National Income
   d. Personal Income
   e. Disposable Personal Income


Q 2: suppose that economy is currently in a recession. If policymakers take no action,
how will the economy change over time? Explain in words and using aggregate demand
and aggregate supply diagram.
12BSP1660         BHARTI SHARMA
12BSP1728       KHUSHBOO SHARMA
12BSP1805          RICHA SEHGAL
12BSP1935        RAGINI AGARWAL
12BSP2023       DEEPIKA JHAMTANI
12BSP2024          DEEPIKA SINGH
12BSP2026        DEVESH CHOTALIA


Q 1: For each of the following events, explain the short-run and long-run effects on
output and the price level, assuming policy makers take no action.
a. The stock market decline sharply, reducing consumer’s wealth
b. The federal government increases spending on national defense
c. A technological improvement raises productivity.
d. A recession overseas causes foreigner to buy fewer U.S. goods


Q 2: what components of GDP (if any) would each of the following transaction affect?
Explain.
   a. A family buys a new refrigerator
   b. Aunt jean buys a new house
   c. Ford sells a Mustang from its inventory
   d. You buy a pizza
   e. California repaves Highway 101
   f. Your parents buy a bottle of French Wine
   g. Honda expands its factory in Marysville Ohio.
12BSP2030          GAURAV YADAV
12BSP2048          MUNITA SHARMA
12BSP2091          SORAV SHARMA
12BSP2140           SATHI BORAL
12BSP2163         DHEERAJ CHHABRA
12BSP2176          KASHIF HUSSAIN


Q 1: suppose that firms become very optimistic about future business conditions and
invest heavily in new capital equipment.

   a. Draw an aggregate demand/ aggregate supply diagram to show the short run
       effects of the optimism on the economy. Label the new level of prices and real
       output. Explain in words why the aggregate quantity of output supplied changes.
   b. Now use the diagram from part (a) to shoe the new long run equilibrium of the
       economy. (For now assume that there is no change in the long run aggregate
       supply curve.) Explain in words why the aggregate quantity of output demanded
       changes between the short run and long run.
   c. How might the investment boom affect the long run aggregate supply curve?
       Explain.


Q 2: if prices rise, people’s income from selling goods increases. The growth of real
GDP ignores this gain, however. Why, then, do economists prefer real GDP as a
measure of economic well being.
12BSP2202         RAHUL SANWARIA
12BSP2209          SAURAV KUMAR
12BSP2223           VIDHU KHATRI
12BSP2236          AKASH BANSAL
12BSP2340           ASMA CHISHTI
12BSP2341         ATUL KESHARWANI
12BSP2460           MANSI MUNJAL


Q 1: what might shift aggregate supply curve to the left? Use the model of aggregate
demand and aggregate supply to trace through the short run and long run effects of
such a shift on output and the price level.


Q 2: the participation of women in U.S. labor force has risen dramatically since 1970.
   a. How do you think this rise affected GDP?
   b. Now imagine a measure of well-being that includes time spent working in the
       home and leisure. How would the change in this measure of well-being compare
       to the change in GDP?
   c. Can you think of other aspects of well-being that you associated with the rise in
       women’s labor-force participation? Would it be practical to construct a measure
       of well-being that includes these aspects?

Contenu connexe

Similaire à Economics project

Devry econ 545 week 5 quiz new
Devry econ 545 week 5 quiz newDevry econ 545 week 5 quiz new
Devry econ 545 week 5 quiz newHaashimm
 
Session 9 thread 1, monday 5th 2015
Session 9 thread 1, monday 5th 2015Session 9 thread 1, monday 5th 2015
Session 9 thread 1, monday 5th 2015Jose Escobar
 
Chapter 1 57.What is the difference between recession and de.docx
Chapter 1 57.What is the difference between recession and de.docxChapter 1 57.What is the difference between recession and de.docx
Chapter 1 57.What is the difference between recession and de.docxsleeperharwell
 
Wells Fargo - SDBJ 2016 Economic Trends
Wells Fargo - SDBJ 2016 Economic TrendsWells Fargo - SDBJ 2016 Economic Trends
Wells Fargo - SDBJ 2016 Economic Trendssdbusinessjournal
 
Common Mistakes On The AP Macro Exam
Common Mistakes On The AP Macro ExamCommon Mistakes On The AP Macro Exam
Common Mistakes On The AP Macro ExamMrRed
 
Agcapita February 2012 Briefing - Spare a Moment for the Real Economy
Agcapita February 2012 Briefing - Spare a Moment for the Real EconomyAgcapita February 2012 Briefing - Spare a Moment for the Real Economy
Agcapita February 2012 Briefing - Spare a Moment for the Real EconomyVeripath Partners
 
Demand and supply questions
Demand and supply questionsDemand and supply questions
Demand and supply questionsnurulzai
 
Calculation of GDP and GDP growth rate
Calculation of GDP and GDP growth rateCalculation of GDP and GDP growth rate
Calculation of GDP and GDP growth rateRyan Shams
 
BDO Global Energy Middle Market Monitor
BDO Global Energy Middle Market MonitorBDO Global Energy Middle Market Monitor
BDO Global Energy Middle Market MonitorBDO Spain
 
1-Holding everything else constant, an increase in the growth rate.docx
1-Holding everything else constant, an increase in the growth rate.docx1-Holding everything else constant, an increase in the growth rate.docx
1-Holding everything else constant, an increase in the growth rate.docxjeremylockett77
 
1-Holding everything else constant, an increase in the growth rate.docx
1-Holding everything else constant, an increase in the growth rate.docx1-Holding everything else constant, an increase in the growth rate.docx
1-Holding everything else constant, an increase in the growth rate.docxkarisariddell
 
2017 Zambia Budget analysis and highlights
2017 Zambia Budget analysis and highlights2017 Zambia Budget analysis and highlights
2017 Zambia Budget analysis and highlightsKampamba Shula
 

Similaire à Economics project (20)

Devry econ 545 week 5 quiz new
Devry econ 545 week 5 quiz newDevry econ 545 week 5 quiz new
Devry econ 545 week 5 quiz new
 
Session 9 thread 1, monday 5th 2015
Session 9 thread 1, monday 5th 2015Session 9 thread 1, monday 5th 2015
Session 9 thread 1, monday 5th 2015
 
The Laird Report - January 11 2014
The Laird Report - January 11 2014The Laird Report - January 11 2014
The Laird Report - January 11 2014
 
Chapter 1 57.What is the difference between recession and de.docx
Chapter 1 57.What is the difference between recession and de.docxChapter 1 57.What is the difference between recession and de.docx
Chapter 1 57.What is the difference between recession and de.docx
 
Wells Fargo - SDBJ 2016 Economic Trends
Wells Fargo - SDBJ 2016 Economic TrendsWells Fargo - SDBJ 2016 Economic Trends
Wells Fargo - SDBJ 2016 Economic Trends
 
Common Mistakes On The AP Macro Exam
Common Mistakes On The AP Macro ExamCommon Mistakes On The AP Macro Exam
Common Mistakes On The AP Macro Exam
 
May Business Lunch
May Business LunchMay Business Lunch
May Business Lunch
 
MICROECONOMICS ASSIGNMENT HELP
  MICROECONOMICS ASSIGNMENT HELP  MICROECONOMICS ASSIGNMENT HELP
MICROECONOMICS ASSIGNMENT HELP
 
Agcapita February 2012 Briefing - Spare a Moment for the Real Economy
Agcapita February 2012 Briefing - Spare a Moment for the Real EconomyAgcapita February 2012 Briefing - Spare a Moment for the Real Economy
Agcapita February 2012 Briefing - Spare a Moment for the Real Economy
 
Fiscal Policy
Fiscal PolicyFiscal Policy
Fiscal Policy
 
Post #Budget2019 Presentation
Post #Budget2019 PresentationPost #Budget2019 Presentation
Post #Budget2019 Presentation
 
Demand and supply questions
Demand and supply questionsDemand and supply questions
Demand and supply questions
 
Calculation of GDP and GDP growth rate
Calculation of GDP and GDP growth rateCalculation of GDP and GDP growth rate
Calculation of GDP and GDP growth rate
 
BDO Global Energy Middle Market Monitor
BDO Global Energy Middle Market MonitorBDO Global Energy Middle Market Monitor
BDO Global Energy Middle Market Monitor
 
1-Holding everything else constant, an increase in the growth rate.docx
1-Holding everything else constant, an increase in the growth rate.docx1-Holding everything else constant, an increase in the growth rate.docx
1-Holding everything else constant, an increase in the growth rate.docx
 
1-Holding everything else constant, an increase in the growth rate.docx
1-Holding everything else constant, an increase in the growth rate.docx1-Holding everything else constant, an increase in the growth rate.docx
1-Holding everything else constant, an increase in the growth rate.docx
 
2017 Zambia Budget analysis and highlights
2017 Zambia Budget analysis and highlights2017 Zambia Budget analysis and highlights
2017 Zambia Budget analysis and highlights
 
Sqm corp pres 4q17_final
Sqm corp pres 4q17_finalSqm corp pres 4q17_final
Sqm corp pres 4q17_final
 
MBA Macroeconomics
MBA MacroeconomicsMBA Macroeconomics
MBA Macroeconomics
 
Global Economy and Agriculture in Transition
Global Economy and Agriculture in TransitionGlobal Economy and Agriculture in Transition
Global Economy and Agriculture in Transition
 

Economics project

  • 1. 12BSP0196 LAV SOOD 12BSP0233 ARUN SINGH 12BSP0426 GAURI SHARMA GREESHMA 12BSP0435 TIWARI 12BSP0452 HARPAL SINGH DUSHYANT 12BSP0514 RAGHAV 12BSP0607 KUSHAGRA Q 1: Until the early 1990s, the U.S. government emphasized GNP rather than GDP as a measure of economic well being. Which measure should the government prefer if it cares about the total income of Americans? Which measure should it prefer if it cares about the total amount of economic activity occurring in the United States? Q 2: Explain why the following statements are false. a. ' the aggregate- demand curve slopes downwards because it is the horizontal sum of the demand curves for the individual goods' b. ' the long-run aggregate- supply curve is vertical because economic forces do not affect long-run aggregate supply'. c. ' if firms adjusted their prices every day, then the short run aggregate- supply curve would be horizontal.' d. 'whenever the economy enters a recession, its long-run supply curve shifts to the left.'
  • 2. 12BSP0682 MOHIT CHAUHAN 12BSP0687 MOHIT LOHIA 12BSP0818 PALLAVI BHASIN 12BSP0825 PANKAJ SHARMA PRASOON KUMAR 12BSP0883 SINGH 12BSP1079 SAKSHI KAPILA SIDHARTH 12BSP1218 MANCHANDA Q 1: Below are some data from the land of milk and honey. Years Price of Milk Quantity of Price of Honey Quantity of Milk (quart) Honey (quarts) 2005 $1 100 $2 50 2006 $2 200 $2 100 2007 $3 200 $4 100 a. Compute nominal GDP, real GDP and GDP deflator for each year, using 2005 as a base year. b. Compute percentage change in nominal GDP, real GDP and the GDP deflator in 2006 and 2007 from the preceding year. For each year, identify the variable that does not change. Explain in words, why your answer makes sense. c. Did economic well-being raise more in 2006 or 2007? Explain. Q 2: what might shift the aggregate demand curve to the left? Use the model of aggregate demand and aggregate supply to trace through the short run and long run effects of such a shift on output and the price level.
  • 3. 12BSP1334 UDAY KUMAR 12BSP1336 UDIT PRATAP SINGH 12BSP1440 SURABHI DAS 12BSP1464 KSHIPRA GANGAY 12BSP1558 MANALI MATHUR 12BSP1599 SAHIL ARORA AVINASH KUMAR 12BSP1658 SINGH Q 1: one day Barry and Barber, Inc., collects $400 for haircuts. Over this day, his equipment depreciates in the value by $50. Of the remaining $350, Barry sends $30 to the government in sales taxes, takes home $220 in wages, and retains $100 in his business to add new equipments in the future. From the $220 that Barry takes home, he pays $70 in income taxes. Based on this information, compute Barry’s contribution to the following measures of income. a. Gross Domestic Product b. Net National Product c. National Income d. Personal Income e. Disposable Personal Income Q 2: suppose that economy is currently in a recession. If policymakers take no action, how will the economy change over time? Explain in words and using aggregate demand and aggregate supply diagram.
  • 4. 12BSP1660 BHARTI SHARMA 12BSP1728 KHUSHBOO SHARMA 12BSP1805 RICHA SEHGAL 12BSP1935 RAGINI AGARWAL 12BSP2023 DEEPIKA JHAMTANI 12BSP2024 DEEPIKA SINGH 12BSP2026 DEVESH CHOTALIA Q 1: For each of the following events, explain the short-run and long-run effects on output and the price level, assuming policy makers take no action. a. The stock market decline sharply, reducing consumer’s wealth b. The federal government increases spending on national defense c. A technological improvement raises productivity. d. A recession overseas causes foreigner to buy fewer U.S. goods Q 2: what components of GDP (if any) would each of the following transaction affect? Explain. a. A family buys a new refrigerator b. Aunt jean buys a new house c. Ford sells a Mustang from its inventory d. You buy a pizza e. California repaves Highway 101 f. Your parents buy a bottle of French Wine g. Honda expands its factory in Marysville Ohio.
  • 5. 12BSP2030 GAURAV YADAV 12BSP2048 MUNITA SHARMA 12BSP2091 SORAV SHARMA 12BSP2140 SATHI BORAL 12BSP2163 DHEERAJ CHHABRA 12BSP2176 KASHIF HUSSAIN Q 1: suppose that firms become very optimistic about future business conditions and invest heavily in new capital equipment. a. Draw an aggregate demand/ aggregate supply diagram to show the short run effects of the optimism on the economy. Label the new level of prices and real output. Explain in words why the aggregate quantity of output supplied changes. b. Now use the diagram from part (a) to shoe the new long run equilibrium of the economy. (For now assume that there is no change in the long run aggregate supply curve.) Explain in words why the aggregate quantity of output demanded changes between the short run and long run. c. How might the investment boom affect the long run aggregate supply curve? Explain. Q 2: if prices rise, people’s income from selling goods increases. The growth of real GDP ignores this gain, however. Why, then, do economists prefer real GDP as a measure of economic well being.
  • 6. 12BSP2202 RAHUL SANWARIA 12BSP2209 SAURAV KUMAR 12BSP2223 VIDHU KHATRI 12BSP2236 AKASH BANSAL 12BSP2340 ASMA CHISHTI 12BSP2341 ATUL KESHARWANI 12BSP2460 MANSI MUNJAL Q 1: what might shift aggregate supply curve to the left? Use the model of aggregate demand and aggregate supply to trace through the short run and long run effects of such a shift on output and the price level. Q 2: the participation of women in U.S. labor force has risen dramatically since 1970. a. How do you think this rise affected GDP? b. Now imagine a measure of well-being that includes time spent working in the home and leisure. How would the change in this measure of well-being compare to the change in GDP? c. Can you think of other aspects of well-being that you associated with the rise in women’s labor-force participation? Would it be practical to construct a measure of well-being that includes these aspects?