SlideShare a Scribd company logo
1 of 7
Download to read offline
/

Press Information
Contact details:
Bill Daddi
Daddi Brand Communications Inc.
Phone: 646-370-1341
Cell: 917-620-3717
Email: Bill@DaddiBrand.com

KANTAR MEDIA REPORTS U.S. ADVERTISING EXPENDITURES
INCREASED 0.8 PERCENT IN 2011
New York, NY, March 12, 2012 – Total advertising expenditures increased 0.8 percent in 2011 and
finished the year at $144.0 billion, according to data released today by Kantar Media, the leading provider
of strategic advertising and marketing information. Ad spending during the fourth quarter of 2011 dropped
1.0 percent versus the year ago period, the first quarterly decline since the end of 2009. Since reaching a
post-recession peak in Q3 2010, advertising growth rates have slowed sequentially for five consecutive
quarters.

Ad Spending Growth Rate
10.0%

8.7%

8.0%
6.0%

7.0%
5.1%

5.4%
4.1%

4.0%

2.8%

2.0%

0.4%

0.0%
-2.0%
Q1 '10

Q2 '10

Q3 '10

Q4 '10

Q1 '11

Q2 '11

Q3 '11

-1.0%
Q4 '11

Source: Kantar Media

“The  contrast  of  resilient  TV  spending  and  waning  budget allocations to other traditional media was
plainly  evident  at  the  end  of  2011,”  said  Jon  Swallen,  SVP  Research  at  Kantar  Media Intelligence North
America.  “Some  mature  digital  media  formats  were  also  touched  by  the  year-end tide of reduced
spending. Whether this is an isolated occurrence or an early sign of digital dollars moving more quickly
towards  emerging  and  unmeasured  digital  platforms  bears  watching  as  2012  unfolds.”
Measured Ad Spending By Media
Television continued to lead the ad market in the fourth quarter. Network TV expenditures jumped 7.7
percent year-over-year and were helped by strong pricing for football, a baseball World Series that went
the maximum seven games and the launch of The X Factor singing competition program. The rate of
Cable growth eased during Q4, finishing at +2.4 percent as higher demand from restaurants and retailers
was offset by reductions from consumer packaged goods. For the full year, Network TV decreased by 2.0
percent while Cable rose 7.7 percent.
Spanish language TV ad spending surged 19.1 percent in fourth quarter, paced by higher sell-out levels
at over-the-air networks. For all of 2011, the segment increased 8.3 percent.
Syndication TV benefitted from higher spending by department stores and health & beauty brands and
saw expenditures soar 11.0 percent in Q4. Full year spending advanced by 15.4 percent.
Spot TV expenditures fell 8.7 percent in the fourth quarter but the more significant indicator was that
November and December spending were each down, despite easy comparisons against diminished,
post-election spending volume of a year ago. Full year Spot TV spending dropped 4.5 percent.
Free Standing Inserts achieved healthy gains in the fourth quarter with spend rising 3.0 percent. Although
manufacturers have been distributing fewer FSI coupons, retailer promotion pages have increased
significantly and this contributed to the improvement.
Ad expenditures for measured digital media declined in the fourth quarter. Paid Search budgets were 6.4
percent lower versus a year ago with continuing reductions from financial, insurance and local service
advertisers. Display investments decreased 5.9 percent in Q4, dragged down by smaller budgets from
auto manufacturers, telecom providers and travel companies. For the entire year, Paid Search declined
2.8 percent and Display increased 5.5 percent.
Magazine ad spending eroded at year end. Consumer Magazines declined 5.2 percent in the fourth
quarter due to deep cutbacks in auto, food and pharmaceutical advertising. Total year expenditures were
level compared to prior year. Outlays in Sunday Magazines fell 9.8 percent in Q4, the sixth consecutive
quarter of year-over-year declines, and were down 7.2 percent for all of 2011.
Local Newspaper ad expenditures fell 3.9 percent during the fourth quarter, hurt by the reallocation of
retailer advertising budgets to other media channels during the key holiday shopping season. Full year
spending was 3.8 percent lower. The losses in Newspaper spending are consistent with reductions in the
amount of space sold.
The pace of spending in Radio media also sagged. Local Radio expenditures were down 3.8 percent and
National Spot Radio plummeted 13.9 percent in the fourth quarter. The telecom, financial service and
automotive categories were prime contributors to these quarterly decreases.
Percent Change in Measured Ad Spending
MEDIA SECTOR
Media Type

1

th

4 Quarter
Year
2011 vs. 2010 2011 vs. 2010

(Listed in rank order of full year 2011 spending)

TELEVISION MEDIA
2
Cable TV
Network TV
3
Spot TV
4
Spanish Language TV
Syndication – National
INTERNET MEDIA
5
Paid Search
Display
6
MAGAZINE MEDIA
Consumer Magazines
B-to-B Magazines
Sunday Magazines
Local Magazines
Spanish Language Magazines
7
NEWSPAPER MEDIA
Local Newspapers
National Newspapers
Spanish Language Newspapers
RADIO MEDIA
8
Local Radio
National Spot Radio
Network Radio
OUTDOOR
9
FSIs
TOTAL

3.1%
2.4%
7.7%
-8.7%
19.1%
11.0%
-6.2%
-6.4%
-5.9%
-4.9%
-5.2%
-0.8%
-9.8%
-3.8%
25.1%
-3.7%
-3.9%
-3.9%
10.4%
-5.6%
-3.8%
-13.9%
4.3%
1.1%
3.0%
-1.0%

2.4%
7.7%
-2.0%
-4.5%
8.3%
15.4%
0.4%
-2.8%
5.5%
-0.4%
0.0%
0.8%
-7.2%
-2.9%
24.9%
-3.7%
-3.8%
-3.6%
1.9%
-0.6%
0.6%
-5.4%
2.7%
6.5%
-4.3%
0.8%

Source: Kantar Media
1. Figures  are  based  on  the  Kantar  Media  Stradegy™  multimedia  ad  expenditure  database  across  all  measured  media,  including:  
Network TV (5 networks); Spot TV (125 DMAs); Cable TV (71 networks); Syndication TV; Hispanic Network TV (4 networks);
Consumer Magazines (204 publications); Sunday Magazines (8 publications); Local Magazines (29 publications); Hispanic
Magazines (18 publications); Business-to-Business Magazines (304 publications); Local Newspapers (108 publications); National
Newspapers (3 publications); Hispanic Newspapers (46 publications); Network Radio (5 networks); National Spot Radio (205
markets); Local Radio (32 markets); Internet search (Google search engine, excluding mobile); Internet display (1,911 sites
monitored at least one year); and Outdoor. Figures do not include public service announcements (PSA) or house advertising
2. Cable TV figures based on 67 English language networks and do not include any Hispanic cable networks
3. Spot TV figures based on 658 English language stations in 125 DMAs and do not include any Hispanic stations
4. Spanish Language TV includes 4 Hispanic broadcast networks, 4 Hispanic cable network and 71 local Hispanic TV stations
5. Internet search figures reflect paid activity on Google and are compiled from monthly data on Top 20,000 subdomains. Mobile
search spending is not included.
6. Magazine media includes Publishers Information Bureau (PIB) data and reflect print editions of publications
7. Newspaper media figures reflect print editions of publications
8. Local Radio includes expenditures for 32 markets in the U.S.
9. FSI data represents distribution costs only
Measured Ad Spending By Advertiser
Spending among the ten largest advertisers in 2011 reached $16,061.6 million, a 2.8 percent decline
compared to a year ago. Among the Top 100 marketers, a diversified group that represents over twofifths of all measured ad expenditures, full year budgets were down 0.2 percent.
For the ninth consecutive year, Procter & Gamble was the top advertiser with spending of $2,949.1 million
down 5.4 percent compared to last year. While TV is still the foundation of its advertising media buys,
P&G’s  2011  budget  allocation saw share gains for magazines at the expense of TV.
AT&T was the second largest advertiser in 2011 with expenditures of $1,924.6 million, a decline of 11.7
percent. Media budgets were severely curtailed during the fourth quarter when the company abandoned
its attempted acquisition of T-Mobile, triggering large breakup fees and a huge earnings loss. At Verizon
Communications, full year ad spending was $1,636.9 million, a decrease of 11.8 percent. After a string of
quarterly budget cuts dating to early 2010, Verizon sharply boosted its spending during the last quarter.
The largest growth rate among the Top Ten marketers was posted by Chrysler, up 36.2 percent to
$1,193.0 for the full year. The increase was driven by marketing introductions for several new or
redesigned models, coupled with the improved sales climate for new vehicles. In contrast, General
Motors lowered its 2011 outlays by 16.1 percent to $1,784.1 million. Q4 media budgets dropped 24.7
percent. As factory support has been trimmed, GM dealers have been bearing a larger share of the
overall marketing effort.
L’Oreal  investments in 2011 rose 18.1 percent to $1,343.5 million as the company expanded marketing
support  for  the  L’Oreal  Paris,  Maybelline  and  Garnier  brand  lines. Comcast (+11.3 percent, to $1,577.2
million) and Time Warner (+5.8 percent, to $1,279.4 million) also posted full year spending gains,
1

Top Ten Advertisers Of 2011
Rank
1
2
3
4
5
6
7
8
9
10

Company

Year 2011
($ Millions)

Procter & Gamble Co
AT&T Inc
General Motors Corp
Verizon Communications
Comcast Corp
L'Oreal SA
Time Warner Inc
Pfizer Inc
Chrysler Group LLC
News Corp
2
TOTAL

$2,949.1
$1,924.6
$1,784.1
$1,636.9
$1,577.2
$1,343.5
$1,279.4
$1,203.5
$1,193.0
$1,170.5
$16,061.6

Year 2010
($ Millions)
$3,116.9
$2,180.0
$2,127.0
$1,856.8
$1,416.6
$1,137.8
$1,209.8
$1,230.8
$875.7
$1,362.2
$16,513.5

Source: Kantar Media
1. Figures do not include FSI, House Ads or PSA activity
2. The sum of the individual companies can differ from the total shown due to rounding

% Change
-5.4%
-11.7%
-16.1%
-11.8%
11.3%
18.1%
5.8%
-2.2%
36.2%
-14.1%
-2.8%
Measured Ad Spending By Category
Expenditures for the ten largest categories grew 3.3 percent in 2011 and reached $81,629.2 million
Automotive was the leading category in dollar volume and finished 2011 at $13,890.4 million, up 6.3
percent. Category spending growth became increasingly bifurcated during the year with Tier 2 and Tier 3
dealer budgets continuing to expand and Tier 1 manufacturer expenditures flattening.
Miscellaneous Retail, which is comprised of all retail segments except Department Stores and Home
Improvement purveyors, was the second largest category with 2011 expenditures of $10,019.5 million, up
4.0 percent. Robust ad spending during the critical year-end holiday season bolstered results.
Insurance registered the largest growth rate among the Top Ten categories with a 13.5 percent gain to
$5,519.0 million. Aggressive competition among auto insurers to gain market share continues to drive
media budgets higher.
Financial Services totaled $9,059.9 million of spending, a 3.6 percent increase. Growth has been fueled
by the credit card segment, offsetting continued weakness in ad budgets for investment products and
retail banking.
The Telecom category lost ground as 2011 expenditures fell 5.8 percent to $8,649.0 million. Declines
were most pronounced among the leading wireless service advertisers. Aggregates expenditures from TV
service providers also slowed.
Top Ten Advertising Categories Of 2011
Rank
1

Category

Year 2011
($ Millions)

Year 2010
($ Millions)

% Change

Automotive

$13,890.4

$13,062.2

6.3%

$8,586.5
$5,303.9

$8,291.6
$4,770.6

3.6%
11.2%

$10,019.5
$9,573.3
$9,095.9
$8,649.0
$6,497.7
$6,354.1
$6,155.7
$5,874.7
$5,519.0
$81,629.2

$9,637.4
$8,922.1
$8,778.7
$9,180.4
$6,155.9
$6,644.3
$6,119.0
$5,627.9
$4,862.7
$78,990.7

(Manufacturers)
(Dealers)

2
3
4
5
6
7
8
9
10

1

2

Miscellaneous Retail
Local Services
Financial Services
Telecom
Personal Care Products
Food & Candy
Direct Response
Restaurants
Insurance
3
TOTAL

4.0%
7.3%
3.6%
-5.8%
5.6%
-4.4%
0.6%
4.4%
13.5%
3.3%
Source: Kantar Media
1. Figures do not include FSI or PSA activity
2. Miscellaneous Retail excludes these retail segments: Department Stores, Home Furnishing & Building Supply Stores
3. The sum of the individual categories can differ from the total shown due to rounding

Top Spending Advertisers Within Select Media
The top ten TV advertisers spent $10,115.4 million in the medium during 2011, down 0.8 percent from a
year ago. This group accounted for 14.9 percent of total TV expenditures by all advertisers.
1

Top Ten Television Advertisers Of 2011
Rank
1
2
3
4
5
6
7
8
9
10

Company
Procter & Gamble Co.
AT&T Inc.
General Motors Corp.
Verizon Communications
Chrysler Group Llc.
General Mills Inc.
Comcast Corp.
Ford Motor Co.
Toyota Motor Corp.
Time Warner Inc.
2
TOTAL

Year 2011
($ Millions)
$1,718.7
$1,332.6
$1,112.2
$1,064.1
$890.4
$842.4
$840.3
$781.0
$767.4
$766.2
$10,115.4

% Change
vs. Year Ago
-6.8%
-12.6%
-7.6%
-3.9%
38.8%
4.3%
10.6%
-3.9%
-4.0%
9.8%
-0.8%

Source: Kantar Media
1 Figures do not include PSA activity
2 The sum of the individual companies can differ from the total shown due to rounding

The ten largest Internet advertisers invested a total of $2,360.6 million in paid search and display
campaigns, up 10.0 percent versus a year ago. Despite fragmentation on the web, the group accounted
for 10.9 percent share of all Internet ad dollars.
Top Ten Internet Advertisers Of 2011
(Display + Paid Search)
Rank
1
2
3
4
5
6
7
8
9
10

Company
IAC/Interactivecorp
Experian Group LTD
General Motors Corp.
AT&T Inc.
Progressive Corp.
Verizon Communications Inc.
Comcast Corp.
Capital One Financial Corp.
Amazon.com Inc.
Ebay Inc.
1
TOTAL

Year 2011
($ Millions)
$316.2
$277.8
$270.8
$245.7
$239.7
$230.3
$203.7
$203.4
$199.8
$173.2
$2,360.6

% Change vs.
Year Ago
28.9%
-5.8%
15.7%
6.3%
22.9%
27.9%
31.8%
0.0%
-13.1%
-2.0%
+10.0%

Source: Kantar Media
1. The sum of the individual companies can differ from the total shown due to rounding
The top ten advertisers in Hispanic Media spent $1,403.6 million during 2011, an increase of 29.2
percent. This group accounted for 24.7 percent of all Hispanic Media expenditures, the largest Top Ten
share concentration of any medium.
1

Top Ten Hispanic Media Advertisers Of 2011
Rank
1
2
3
4
5
6
7
8
9
10

Company
Broadcasting Media Partners
Procter & Gamble Co.
Dish Network Corp.
McDonalds Corp.
Verizon Communications Inc.
AT&T Inc.
General Mills Inc.
Toyota Motor Corp.
Kraft Foods Inc.
General Motors Corp.
2
TOTAL

Year 2011
($ Millions)
$362.0
$209.6
$153.7
$114.4
$113.2
$111.0
$93.6
$84.6
$82.9
$78.6
$1,403.6

% Change vs.
Year Ago
212.9%
9.6%
71.2%
-2.6%
-16.6%
-16.2%
5.1%
8.3%
130.9%
-21.8%
+29.2%

Source: Kantar Media
1. Figures exclude Business-to-Business publications
2. The sum of the individual companies can differ from the total shown due to rounding

About Kantar Media
Kantar  Media  provides  strategic  advice  and  competitive  intelligence  to  the  world’s  leading  brands,  publishers,  
agencies and industry bodies, helping them navigate and succeed in a rapidly evolving media industry. This includes
analysis of paid media opportunities; counsel on brand reputation, corporate management and consumer
engagement  through  owned  media;;  and,  evaluating  consumers’  reactions  in  earned  media.    Kantar  Media  provides  
clients with a broad range of insights from audience research, competitive intelligence, vital consumer behavior and
digital insights, to marketing effectiveness and online influence. Our experts currently work with 22,000 companies
tracking 3 million brands in 50 countries. www.KantarMediaNA.com.

####

More Related Content

What's hot

P&G Reports $0.82 EPS, Up 11%, On 13% Operating Profit Growth
P&G Reports $0.82 EPS, Up 11%, On 13% Operating Profit GrowthP&G Reports $0.82 EPS, Up 11%, On 13% Operating Profit Growth
P&G Reports $0.82 EPS, Up 11%, On 13% Operating Profit Growthfinance3
 
Long form vs short form spot impact in sales
Long form vs short form spot impact in salesLong form vs short form spot impact in sales
Long form vs short form spot impact in salesAntonia Horodinca
 
TAM AdEx-Cross Media Report-F&B
TAM AdEx-Cross Media Report-F&BTAM AdEx-Cross Media Report-F&B
TAM AdEx-Cross Media Report-F&BSocial Samosa
 
2011 magnaglobal-advertising-forecast
2011 magnaglobal-advertising-forecast2011 magnaglobal-advertising-forecast
2011 magnaglobal-advertising-forecastPim Piepers
 
Group m tyny 2020 media handout in inr
Group m tyny 2020 media handout in inrGroup m tyny 2020 media handout in inr
Group m tyny 2020 media handout in inrSocial Samosa
 
Tam ad ex television advertising report H1- 2021
Tam ad ex television advertising report H1- 2021Tam ad ex television advertising report H1- 2021
Tam ad ex television advertising report H1- 2021Social Samosa
 
2009 advertising forecast by magnaglobal
2009 advertising forecast by magnaglobal2009 advertising forecast by magnaglobal
2009 advertising forecast by magnaglobalPim Piepers
 
Tam ad ex mirroring y 2020 for print advertising
Tam ad ex mirroring y 2020 for print advertisingTam ad ex mirroring y 2020 for print advertising
Tam ad ex mirroring y 2020 for print advertisingSocial Samosa
 
Adex Benchmark 2011 (IAB Europe)
Adex Benchmark 2011 (IAB Europe)Adex Benchmark 2011 (IAB Europe)
Adex Benchmark 2011 (IAB Europe)IAB Spain
 
2016 New Business League Report
2016 New Business League Report2016 New Business League Report
2016 New Business League ReportR3
 
Miki, jason &_daniel_media_planfinal-arg
Miki, jason &_daniel_media_planfinal-argMiki, jason &_daniel_media_planfinal-arg
Miki, jason &_daniel_media_planfinal-argJason Han
 
TMUS Q4 2017 Investor Factbook
TMUS Q4 2017 Investor Factbook TMUS Q4 2017 Investor Factbook
TMUS Q4 2017 Investor Factbook Cristal Dunkin
 
TMUS Q2 2017 investor Factbook
TMUS Q2 2017 investor FactbookTMUS Q2 2017 investor Factbook
TMUS Q2 2017 investor FactbookCristal Dunkin
 
Q2 2012 Global Digital Advertising Update
Q2 2012 Global Digital Advertising UpdateQ2 2012 Global Digital Advertising Update
Q2 2012 Global Digital Advertising Updateaction.vn
 

What's hot (17)

P&G Reports $0.82 EPS, Up 11%, On 13% Operating Profit Growth
P&G Reports $0.82 EPS, Up 11%, On 13% Operating Profit GrowthP&G Reports $0.82 EPS, Up 11%, On 13% Operating Profit Growth
P&G Reports $0.82 EPS, Up 11%, On 13% Operating Profit Growth
 
Long form vs short form spot impact in sales
Long form vs short form spot impact in salesLong form vs short form spot impact in sales
Long form vs short form spot impact in sales
 
TAM AdEx-Cross Media Report-F&B
TAM AdEx-Cross Media Report-F&BTAM AdEx-Cross Media Report-F&B
TAM AdEx-Cross Media Report-F&B
 
2011 magnaglobal-advertising-forecast
2011 magnaglobal-advertising-forecast2011 magnaglobal-advertising-forecast
2011 magnaglobal-advertising-forecast
 
Group m tyny 2020 media handout in inr
Group m tyny 2020 media handout in inrGroup m tyny 2020 media handout in inr
Group m tyny 2020 media handout in inr
 
Tam ad ex television advertising report H1- 2021
Tam ad ex television advertising report H1- 2021Tam ad ex television advertising report H1- 2021
Tam ad ex television advertising report H1- 2021
 
2009 advertising forecast by magnaglobal
2009 advertising forecast by magnaglobal2009 advertising forecast by magnaglobal
2009 advertising forecast by magnaglobal
 
Tam ad ex mirroring y 2020 for print advertising
Tam ad ex mirroring y 2020 for print advertisingTam ad ex mirroring y 2020 for print advertising
Tam ad ex mirroring y 2020 for print advertising
 
Carat ad spend sept 2015 final
Carat ad spend sept 2015 finalCarat ad spend sept 2015 final
Carat ad spend sept 2015 final
 
Industry Trends
Industry TrendsIndustry Trends
Industry Trends
 
1 new ir 05-24-17
1 new ir 05-24-171 new ir 05-24-17
1 new ir 05-24-17
 
Adex Benchmark 2011 (IAB Europe)
Adex Benchmark 2011 (IAB Europe)Adex Benchmark 2011 (IAB Europe)
Adex Benchmark 2011 (IAB Europe)
 
2016 New Business League Report
2016 New Business League Report2016 New Business League Report
2016 New Business League Report
 
Miki, jason &_daniel_media_planfinal-arg
Miki, jason &_daniel_media_planfinal-argMiki, jason &_daniel_media_planfinal-arg
Miki, jason &_daniel_media_planfinal-arg
 
TMUS Q4 2017 Investor Factbook
TMUS Q4 2017 Investor Factbook TMUS Q4 2017 Investor Factbook
TMUS Q4 2017 Investor Factbook
 
TMUS Q2 2017 investor Factbook
TMUS Q2 2017 investor FactbookTMUS Q2 2017 investor Factbook
TMUS Q2 2017 investor Factbook
 
Q2 2012 Global Digital Advertising Update
Q2 2012 Global Digital Advertising UpdateQ2 2012 Global Digital Advertising Update
Q2 2012 Global Digital Advertising Update
 

Similar to Kantar media 2011__q4_us_ad_spend

Digital ad spends trend 2015 2016
Digital ad spends trend 2015 2016Digital ad spends trend 2015 2016
Digital ad spends trend 2015 2016Manish Chugh
 
2012' nin İlk 6 Aylık Dijital Gelir Sunumu
2012' nin İlk 6 Aylık Dijital Gelir Sunumu2012' nin İlk 6 Aylık Dijital Gelir Sunumu
2012' nin İlk 6 Aylık Dijital Gelir SunumuFerhat Er
 
PWC IAB Internet Ad Revenue Rresentation Q2 and First Half 2012
PWC IAB Internet Ad Revenue Rresentation Q2 and First Half 2012PWC IAB Internet Ad Revenue Rresentation Q2 and First Half 2012
PWC IAB Internet Ad Revenue Rresentation Q2 and First Half 2012Dung Tri
 
Display business trends publisher edition
Display business trends publisher editionDisplay business trends publisher edition
Display business trends publisher editionThanachart Worrasing
 
AHAA Financial Insurance Services-Auto Ad-Spend Impact on Growth_vFinal
AHAA Financial Insurance Services-Auto Ad-Spend Impact on Growth_vFinalAHAA Financial Insurance Services-Auto Ad-Spend Impact on Growth_vFinal
AHAA Financial Insurance Services-Auto Ad-Spend Impact on Growth_vFinalSantiago Solutions Group
 
2011 q1-marketingcharts-powerpoint-the-marketing-data-box
2011 q1-marketingcharts-powerpoint-the-marketing-data-box2011 q1-marketingcharts-powerpoint-the-marketing-data-box
2011 q1-marketingcharts-powerpoint-the-marketing-data-boxWSI Web Marketing Edge
 
Marketingcharts Powerpoint The Marketing Data Box
Marketingcharts Powerpoint The Marketing Data BoxMarketingcharts Powerpoint The Marketing Data Box
Marketingcharts Powerpoint The Marketing Data BoxErgaro S.A. de C.V
 
Marketingcharts powerpoint-the-marketing-data-box
Marketingcharts powerpoint-the-marketing-data-boxMarketingcharts powerpoint-the-marketing-data-box
Marketingcharts powerpoint-the-marketing-data-boxMathilde Lenoir
 
IAB Netherlands report - Online ad spend report 2016
IAB Netherlands report - Online ad spend report 2016IAB Netherlands report - Online ad spend report 2016
IAB Netherlands report - Online ad spend report 2016IAB Europe
 
Copy of final ppt
Copy of final pptCopy of final ppt
Copy of final pptjaydip111
 
3m Transcript 2006 1st
3m Transcript 2006 1st3m Transcript 2006 1st
3m Transcript 2006 1stfinance10
 
Role of Digital in Media Mix: Understanding Digital Marketing and Getting it ...
Role of Digital in Media Mix: Understanding Digital Marketing and Getting it ...Role of Digital in Media Mix: Understanding Digital Marketing and Getting it ...
Role of Digital in Media Mix: Understanding Digital Marketing and Getting it ...Capgemini
 
Canadian internet Advertising Revenue Survey
Canadian internet Advertising Revenue SurveyCanadian internet Advertising Revenue Survey
Canadian internet Advertising Revenue SurveyIAB Canada
 
Quarterly Statistics on Media, Mobile, Social Media and Advertising
Quarterly Statistics on Media, Mobile, Social Media and AdvertisingQuarterly Statistics on Media, Mobile, Social Media and Advertising
Quarterly Statistics on Media, Mobile, Social Media and AdvertisingEM3
 

Similar to Kantar media 2011__q4_us_ad_spend (20)

Digital ad spends trend 2015 2016
Digital ad spends trend 2015 2016Digital ad spends trend 2015 2016
Digital ad spends trend 2015 2016
 
Group M TYNY Report
Group M TYNY ReportGroup M TYNY Report
Group M TYNY Report
 
2012' nin İlk 6 Aylık Dijital Gelir Sunumu
2012' nin İlk 6 Aylık Dijital Gelir Sunumu2012' nin İlk 6 Aylık Dijital Gelir Sunumu
2012' nin İlk 6 Aylık Dijital Gelir Sunumu
 
PWC IAB Internet Ad Revenue Rresentation Q2 and First Half 2012
PWC IAB Internet Ad Revenue Rresentation Q2 and First Half 2012PWC IAB Internet Ad Revenue Rresentation Q2 and First Half 2012
PWC IAB Internet Ad Revenue Rresentation Q2 and First Half 2012
 
Display business trends publisher edition
Display business trends publisher editionDisplay business trends publisher edition
Display business trends publisher edition
 
AHAA Financial Insurance Services-Auto Ad-Spend Impact on Growth_vFinal
AHAA Financial Insurance Services-Auto Ad-Spend Impact on Growth_vFinalAHAA Financial Insurance Services-Auto Ad-Spend Impact on Growth_vFinal
AHAA Financial Insurance Services-Auto Ad-Spend Impact on Growth_vFinal
 
2011 q1-marketingcharts-powerpoint-the-marketing-data-box
2011 q1-marketingcharts-powerpoint-the-marketing-data-box2011 q1-marketingcharts-powerpoint-the-marketing-data-box
2011 q1-marketingcharts-powerpoint-the-marketing-data-box
 
Marketingcharts Powerpoint The Marketing Data Box
Marketingcharts Powerpoint The Marketing Data BoxMarketingcharts Powerpoint The Marketing Data Box
Marketingcharts Powerpoint The Marketing Data Box
 
The Marketing Data Box 2011
The Marketing Data Box 2011The Marketing Data Box 2011
The Marketing Data Box 2011
 
The Marketing Data Box from Hubspot
The Marketing Data Box from HubspotThe Marketing Data Box from Hubspot
The Marketing Data Box from Hubspot
 
Marketingcharts powerpoint-the-marketing-data-box
Marketingcharts powerpoint-the-marketing-data-boxMarketingcharts powerpoint-the-marketing-data-box
Marketingcharts powerpoint-the-marketing-data-box
 
IAB Netherlands report - Online ad spend report 2016
IAB Netherlands report - Online ad spend report 2016IAB Netherlands report - Online ad spend report 2016
IAB Netherlands report - Online ad spend report 2016
 
Media Update - July 2011
Media Update - July 2011Media Update - July 2011
Media Update - July 2011
 
Copy of final ppt
Copy of final pptCopy of final ppt
Copy of final ppt
 
3m Transcript 2006 1st
3m Transcript 2006 1st3m Transcript 2006 1st
3m Transcript 2006 1st
 
Role of Digital in Media Mix: Understanding Digital Marketing and Getting it ...
Role of Digital in Media Mix: Understanding Digital Marketing and Getting it ...Role of Digital in Media Mix: Understanding Digital Marketing and Getting it ...
Role of Digital in Media Mix: Understanding Digital Marketing and Getting it ...
 
2 (1)
2 (1)2 (1)
2 (1)
 
Mobile advertising spending by industry
Mobile advertising spending by industryMobile advertising spending by industry
Mobile advertising spending by industry
 
Canadian internet Advertising Revenue Survey
Canadian internet Advertising Revenue SurveyCanadian internet Advertising Revenue Survey
Canadian internet Advertising Revenue Survey
 
Quarterly Statistics on Media, Mobile, Social Media and Advertising
Quarterly Statistics on Media, Mobile, Social Media and AdvertisingQuarterly Statistics on Media, Mobile, Social Media and Advertising
Quarterly Statistics on Media, Mobile, Social Media and Advertising
 

More from Dr. Augustine Fou - Independent Ad Fraud Researcher

More from Dr. Augustine Fou - Independent Ad Fraud Researcher (20)

Forensic Auditing of Digital Media.pdf
Forensic Auditing of Digital Media.pdfForensic Auditing of Digital Media.pdf
Forensic Auditing of Digital Media.pdf
 
Q1 2022 Update on ad fraud for AMM
Q1 2022 Update on ad fraud for AMMQ1 2022 Update on ad fraud for AMM
Q1 2022 Update on ad fraud for AMM
 
Ad blocking benchmarks q4 2021
Ad blocking benchmarks q4 2021Ad blocking benchmarks q4 2021
Ad blocking benchmarks q4 2021
 
Digital ad dollars trickle down chart
Digital ad dollars trickle down chartDigital ad dollars trickle down chart
Digital ad dollars trickle down chart
 
Still nothing but ad fraud 2021 dr augustine fou
Still nothing but ad fraud 2021 dr augustine fouStill nothing but ad fraud 2021 dr augustine fou
Still nothing but ad fraud 2021 dr augustine fou
 
Bad guys optimize ad fraud efficiency
Bad guys optimize ad fraud efficiencyBad guys optimize ad fraud efficiency
Bad guys optimize ad fraud efficiency
 
Alternative to ANA's end to end supply chain transparency study v final
Alternative to ANA's end to end supply chain transparency study v finalAlternative to ANA's end to end supply chain transparency study v final
Alternative to ANA's end to end supply chain transparency study v final
 
Impact of Loss of 3P Cookies on Publishers' Ad Revenue
Impact of Loss of 3P Cookies on Publishers' Ad RevenueImpact of Loss of 3P Cookies on Publishers' Ad Revenue
Impact of Loss of 3P Cookies on Publishers' Ad Revenue
 
Entire ecosystem supporting ad fraud 2018
Entire ecosystem supporting ad fraud 2018Entire ecosystem supporting ad fraud 2018
Entire ecosystem supporting ad fraud 2018
 
Digital Media Trust Collaborative
Digital Media Trust CollaborativeDigital Media Trust Collaborative
Digital Media Trust Collaborative
 
Programmatic reach analysis 2021
Programmatic reach analysis 2021Programmatic reach analysis 2021
Programmatic reach analysis 2021
 
2021 update on ad fraud brand safety privacy
2021 update on ad fraud brand safety privacy2021 update on ad fraud brand safety privacy
2021 update on ad fraud brand safety privacy
 
Browser and OS Share Jan 2021
Browser and OS Share Jan 2021Browser and OS Share Jan 2021
Browser and OS Share Jan 2021
 
Checking abnormal referrer traffic in google analytics
Checking abnormal referrer traffic in google analyticsChecking abnormal referrer traffic in google analytics
Checking abnormal referrer traffic in google analytics
 
History and Impact of Digital Ad Fraud
History and Impact of Digital Ad FraudHistory and Impact of Digital Ad Fraud
History and Impact of Digital Ad Fraud
 
Digital Fraud Viewability Benchmarks Q4 2020
Digital Fraud Viewability Benchmarks Q4 2020Digital Fraud Viewability Benchmarks Q4 2020
Digital Fraud Viewability Benchmarks Q4 2020
 
What CFEs can do about digital ad fraud
What CFEs can do about digital ad fraudWhat CFEs can do about digital ad fraud
What CFEs can do about digital ad fraud
 
Four types of digital ad spend updated august 2020
Four types of digital ad spend updated august 2020Four types of digital ad spend updated august 2020
Four types of digital ad spend updated august 2020
 
How to Use FouAnalytics For Marketers
How to Use FouAnalytics   For MarketersHow to Use FouAnalytics   For Marketers
How to Use FouAnalytics For Marketers
 
FouAnalytics DIY site media analytics fraud detection baked in
FouAnalytics DIY site media analytics fraud detection baked inFouAnalytics DIY site media analytics fraud detection baked in
FouAnalytics DIY site media analytics fraud detection baked in
 

Recently uploaded

Cyber Security Training in Office Environment
Cyber Security Training in Office EnvironmentCyber Security Training in Office Environment
Cyber Security Training in Office Environmentelijahj01012
 
APRIL2024_UKRAINE_xml_0000000000000 .pdf
APRIL2024_UKRAINE_xml_0000000000000 .pdfAPRIL2024_UKRAINE_xml_0000000000000 .pdf
APRIL2024_UKRAINE_xml_0000000000000 .pdfRbc Rbcua
 
Digital Transformation in the PLM domain - distrib.pdf
Digital Transformation in the PLM domain - distrib.pdfDigital Transformation in the PLM domain - distrib.pdf
Digital Transformation in the PLM domain - distrib.pdfJos Voskuil
 
Guide Complete Set of Residential Architectural Drawings PDF
Guide Complete Set of Residential Architectural Drawings PDFGuide Complete Set of Residential Architectural Drawings PDF
Guide Complete Set of Residential Architectural Drawings PDFChandresh Chudasama
 
Call Us 📲8800102216📞 Call Girls In DLF City Gurgaon
Call Us 📲8800102216📞 Call Girls In DLF City GurgaonCall Us 📲8800102216📞 Call Girls In DLF City Gurgaon
Call Us 📲8800102216📞 Call Girls In DLF City Gurgaoncallgirls2057
 
Fordham -How effective decision-making is within the IT department - Analysis...
Fordham -How effective decision-making is within the IT department - Analysis...Fordham -How effective decision-making is within the IT department - Analysis...
Fordham -How effective decision-making is within the IT department - Analysis...Peter Ward
 
Kenya’s Coconut Value Chain by Gatsby Africa
Kenya’s Coconut Value Chain by Gatsby AfricaKenya’s Coconut Value Chain by Gatsby Africa
Kenya’s Coconut Value Chain by Gatsby Africaictsugar
 
NewBase 19 April 2024 Energy News issue - 1717 by Khaled Al Awadi.pdf
NewBase  19 April  2024  Energy News issue - 1717 by Khaled Al Awadi.pdfNewBase  19 April  2024  Energy News issue - 1717 by Khaled Al Awadi.pdf
NewBase 19 April 2024 Energy News issue - 1717 by Khaled Al Awadi.pdfKhaled Al Awadi
 
8447779800, Low rate Call girls in Uttam Nagar Delhi NCR
8447779800, Low rate Call girls in Uttam Nagar Delhi NCR8447779800, Low rate Call girls in Uttam Nagar Delhi NCR
8447779800, Low rate Call girls in Uttam Nagar Delhi NCRashishs7044
 
Call US-88OO1O2216 Call Girls In Mahipalpur Female Escort Service
Call US-88OO1O2216 Call Girls In Mahipalpur Female Escort ServiceCall US-88OO1O2216 Call Girls In Mahipalpur Female Escort Service
Call US-88OO1O2216 Call Girls In Mahipalpur Female Escort Servicecallgirls2057
 
8447779800, Low rate Call girls in New Ashok Nagar Delhi NCR
8447779800, Low rate Call girls in New Ashok Nagar Delhi NCR8447779800, Low rate Call girls in New Ashok Nagar Delhi NCR
8447779800, Low rate Call girls in New Ashok Nagar Delhi NCRashishs7044
 
The-Ethical-issues-ghhhhhhhhjof-Byjus.pptx
The-Ethical-issues-ghhhhhhhhjof-Byjus.pptxThe-Ethical-issues-ghhhhhhhhjof-Byjus.pptx
The-Ethical-issues-ghhhhhhhhjof-Byjus.pptxmbikashkanyari
 
FULL ENJOY Call girls in Paharganj Delhi | 8377087607
FULL ENJOY Call girls in Paharganj Delhi | 8377087607FULL ENJOY Call girls in Paharganj Delhi | 8377087607
FULL ENJOY Call girls in Paharganj Delhi | 8377087607dollysharma2066
 
Church Building Grants To Assist With New Construction, Additions, And Restor...
Church Building Grants To Assist With New Construction, Additions, And Restor...Church Building Grants To Assist With New Construction, Additions, And Restor...
Church Building Grants To Assist With New Construction, Additions, And Restor...Americas Got Grants
 
Independent Call Girls Andheri Nightlaila 9967584737
Independent Call Girls Andheri Nightlaila 9967584737Independent Call Girls Andheri Nightlaila 9967584737
Independent Call Girls Andheri Nightlaila 9967584737Riya Pathan
 
Flow Your Strategy at Flight Levels Day 2024
Flow Your Strategy at Flight Levels Day 2024Flow Your Strategy at Flight Levels Day 2024
Flow Your Strategy at Flight Levels Day 2024Kirill Klimov
 
Traction part 2 - EOS Model JAX Bridges.
Traction part 2 - EOS Model JAX Bridges.Traction part 2 - EOS Model JAX Bridges.
Traction part 2 - EOS Model JAX Bridges.Anamaria Contreras
 
Innovation Conference 5th March 2024.pdf
Innovation Conference 5th March 2024.pdfInnovation Conference 5th March 2024.pdf
Innovation Conference 5th March 2024.pdfrichard876048
 

Recently uploaded (20)

Cyber Security Training in Office Environment
Cyber Security Training in Office EnvironmentCyber Security Training in Office Environment
Cyber Security Training in Office Environment
 
APRIL2024_UKRAINE_xml_0000000000000 .pdf
APRIL2024_UKRAINE_xml_0000000000000 .pdfAPRIL2024_UKRAINE_xml_0000000000000 .pdf
APRIL2024_UKRAINE_xml_0000000000000 .pdf
 
Digital Transformation in the PLM domain - distrib.pdf
Digital Transformation in the PLM domain - distrib.pdfDigital Transformation in the PLM domain - distrib.pdf
Digital Transformation in the PLM domain - distrib.pdf
 
Guide Complete Set of Residential Architectural Drawings PDF
Guide Complete Set of Residential Architectural Drawings PDFGuide Complete Set of Residential Architectural Drawings PDF
Guide Complete Set of Residential Architectural Drawings PDF
 
Call Us 📲8800102216📞 Call Girls In DLF City Gurgaon
Call Us 📲8800102216📞 Call Girls In DLF City GurgaonCall Us 📲8800102216📞 Call Girls In DLF City Gurgaon
Call Us 📲8800102216📞 Call Girls In DLF City Gurgaon
 
Fordham -How effective decision-making is within the IT department - Analysis...
Fordham -How effective decision-making is within the IT department - Analysis...Fordham -How effective decision-making is within the IT department - Analysis...
Fordham -How effective decision-making is within the IT department - Analysis...
 
Kenya’s Coconut Value Chain by Gatsby Africa
Kenya’s Coconut Value Chain by Gatsby AfricaKenya’s Coconut Value Chain by Gatsby Africa
Kenya’s Coconut Value Chain by Gatsby Africa
 
NewBase 19 April 2024 Energy News issue - 1717 by Khaled Al Awadi.pdf
NewBase  19 April  2024  Energy News issue - 1717 by Khaled Al Awadi.pdfNewBase  19 April  2024  Energy News issue - 1717 by Khaled Al Awadi.pdf
NewBase 19 April 2024 Energy News issue - 1717 by Khaled Al Awadi.pdf
 
8447779800, Low rate Call girls in Uttam Nagar Delhi NCR
8447779800, Low rate Call girls in Uttam Nagar Delhi NCR8447779800, Low rate Call girls in Uttam Nagar Delhi NCR
8447779800, Low rate Call girls in Uttam Nagar Delhi NCR
 
Call US-88OO1O2216 Call Girls In Mahipalpur Female Escort Service
Call US-88OO1O2216 Call Girls In Mahipalpur Female Escort ServiceCall US-88OO1O2216 Call Girls In Mahipalpur Female Escort Service
Call US-88OO1O2216 Call Girls In Mahipalpur Female Escort Service
 
No-1 Call Girls In Goa 93193 VIP 73153 Escort service In North Goa Panaji, Ca...
No-1 Call Girls In Goa 93193 VIP 73153 Escort service In North Goa Panaji, Ca...No-1 Call Girls In Goa 93193 VIP 73153 Escort service In North Goa Panaji, Ca...
No-1 Call Girls In Goa 93193 VIP 73153 Escort service In North Goa Panaji, Ca...
 
8447779800, Low rate Call girls in New Ashok Nagar Delhi NCR
8447779800, Low rate Call girls in New Ashok Nagar Delhi NCR8447779800, Low rate Call girls in New Ashok Nagar Delhi NCR
8447779800, Low rate Call girls in New Ashok Nagar Delhi NCR
 
The-Ethical-issues-ghhhhhhhhjof-Byjus.pptx
The-Ethical-issues-ghhhhhhhhjof-Byjus.pptxThe-Ethical-issues-ghhhhhhhhjof-Byjus.pptx
The-Ethical-issues-ghhhhhhhhjof-Byjus.pptx
 
FULL ENJOY Call girls in Paharganj Delhi | 8377087607
FULL ENJOY Call girls in Paharganj Delhi | 8377087607FULL ENJOY Call girls in Paharganj Delhi | 8377087607
FULL ENJOY Call girls in Paharganj Delhi | 8377087607
 
Church Building Grants To Assist With New Construction, Additions, And Restor...
Church Building Grants To Assist With New Construction, Additions, And Restor...Church Building Grants To Assist With New Construction, Additions, And Restor...
Church Building Grants To Assist With New Construction, Additions, And Restor...
 
Corporate Profile 47Billion Information Technology
Corporate Profile 47Billion Information TechnologyCorporate Profile 47Billion Information Technology
Corporate Profile 47Billion Information Technology
 
Independent Call Girls Andheri Nightlaila 9967584737
Independent Call Girls Andheri Nightlaila 9967584737Independent Call Girls Andheri Nightlaila 9967584737
Independent Call Girls Andheri Nightlaila 9967584737
 
Flow Your Strategy at Flight Levels Day 2024
Flow Your Strategy at Flight Levels Day 2024Flow Your Strategy at Flight Levels Day 2024
Flow Your Strategy at Flight Levels Day 2024
 
Traction part 2 - EOS Model JAX Bridges.
Traction part 2 - EOS Model JAX Bridges.Traction part 2 - EOS Model JAX Bridges.
Traction part 2 - EOS Model JAX Bridges.
 
Innovation Conference 5th March 2024.pdf
Innovation Conference 5th March 2024.pdfInnovation Conference 5th March 2024.pdf
Innovation Conference 5th March 2024.pdf
 

Kantar media 2011__q4_us_ad_spend

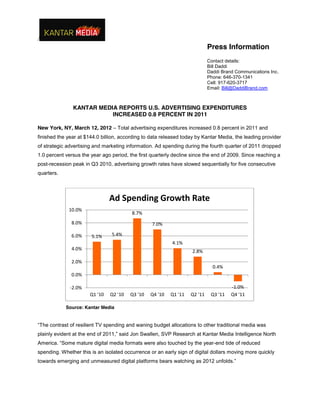
  • 1. / Press Information Contact details: Bill Daddi Daddi Brand Communications Inc. Phone: 646-370-1341 Cell: 917-620-3717 Email: Bill@DaddiBrand.com KANTAR MEDIA REPORTS U.S. ADVERTISING EXPENDITURES INCREASED 0.8 PERCENT IN 2011 New York, NY, March 12, 2012 – Total advertising expenditures increased 0.8 percent in 2011 and finished the year at $144.0 billion, according to data released today by Kantar Media, the leading provider of strategic advertising and marketing information. Ad spending during the fourth quarter of 2011 dropped 1.0 percent versus the year ago period, the first quarterly decline since the end of 2009. Since reaching a post-recession peak in Q3 2010, advertising growth rates have slowed sequentially for five consecutive quarters. Ad Spending Growth Rate 10.0% 8.7% 8.0% 6.0% 7.0% 5.1% 5.4% 4.1% 4.0% 2.8% 2.0% 0.4% 0.0% -2.0% Q1 '10 Q2 '10 Q3 '10 Q4 '10 Q1 '11 Q2 '11 Q3 '11 -1.0% Q4 '11 Source: Kantar Media “The  contrast  of  resilient  TV  spending  and  waning  budget allocations to other traditional media was plainly  evident  at  the  end  of  2011,”  said  Jon  Swallen,  SVP  Research  at  Kantar  Media Intelligence North America.  “Some  mature  digital  media  formats  were  also  touched  by  the  year-end tide of reduced spending. Whether this is an isolated occurrence or an early sign of digital dollars moving more quickly towards  emerging  and  unmeasured  digital  platforms  bears  watching  as  2012  unfolds.”
  • 2. Measured Ad Spending By Media Television continued to lead the ad market in the fourth quarter. Network TV expenditures jumped 7.7 percent year-over-year and were helped by strong pricing for football, a baseball World Series that went the maximum seven games and the launch of The X Factor singing competition program. The rate of Cable growth eased during Q4, finishing at +2.4 percent as higher demand from restaurants and retailers was offset by reductions from consumer packaged goods. For the full year, Network TV decreased by 2.0 percent while Cable rose 7.7 percent. Spanish language TV ad spending surged 19.1 percent in fourth quarter, paced by higher sell-out levels at over-the-air networks. For all of 2011, the segment increased 8.3 percent. Syndication TV benefitted from higher spending by department stores and health & beauty brands and saw expenditures soar 11.0 percent in Q4. Full year spending advanced by 15.4 percent. Spot TV expenditures fell 8.7 percent in the fourth quarter but the more significant indicator was that November and December spending were each down, despite easy comparisons against diminished, post-election spending volume of a year ago. Full year Spot TV spending dropped 4.5 percent. Free Standing Inserts achieved healthy gains in the fourth quarter with spend rising 3.0 percent. Although manufacturers have been distributing fewer FSI coupons, retailer promotion pages have increased significantly and this contributed to the improvement. Ad expenditures for measured digital media declined in the fourth quarter. Paid Search budgets were 6.4 percent lower versus a year ago with continuing reductions from financial, insurance and local service advertisers. Display investments decreased 5.9 percent in Q4, dragged down by smaller budgets from auto manufacturers, telecom providers and travel companies. For the entire year, Paid Search declined 2.8 percent and Display increased 5.5 percent. Magazine ad spending eroded at year end. Consumer Magazines declined 5.2 percent in the fourth quarter due to deep cutbacks in auto, food and pharmaceutical advertising. Total year expenditures were level compared to prior year. Outlays in Sunday Magazines fell 9.8 percent in Q4, the sixth consecutive quarter of year-over-year declines, and were down 7.2 percent for all of 2011. Local Newspaper ad expenditures fell 3.9 percent during the fourth quarter, hurt by the reallocation of retailer advertising budgets to other media channels during the key holiday shopping season. Full year spending was 3.8 percent lower. The losses in Newspaper spending are consistent with reductions in the amount of space sold.
  • 3. The pace of spending in Radio media also sagged. Local Radio expenditures were down 3.8 percent and National Spot Radio plummeted 13.9 percent in the fourth quarter. The telecom, financial service and automotive categories were prime contributors to these quarterly decreases. Percent Change in Measured Ad Spending MEDIA SECTOR Media Type 1 th 4 Quarter Year 2011 vs. 2010 2011 vs. 2010 (Listed in rank order of full year 2011 spending) TELEVISION MEDIA 2 Cable TV Network TV 3 Spot TV 4 Spanish Language TV Syndication – National INTERNET MEDIA 5 Paid Search Display 6 MAGAZINE MEDIA Consumer Magazines B-to-B Magazines Sunday Magazines Local Magazines Spanish Language Magazines 7 NEWSPAPER MEDIA Local Newspapers National Newspapers Spanish Language Newspapers RADIO MEDIA 8 Local Radio National Spot Radio Network Radio OUTDOOR 9 FSIs TOTAL 3.1% 2.4% 7.7% -8.7% 19.1% 11.0% -6.2% -6.4% -5.9% -4.9% -5.2% -0.8% -9.8% -3.8% 25.1% -3.7% -3.9% -3.9% 10.4% -5.6% -3.8% -13.9% 4.3% 1.1% 3.0% -1.0% 2.4% 7.7% -2.0% -4.5% 8.3% 15.4% 0.4% -2.8% 5.5% -0.4% 0.0% 0.8% -7.2% -2.9% 24.9% -3.7% -3.8% -3.6% 1.9% -0.6% 0.6% -5.4% 2.7% 6.5% -4.3% 0.8% Source: Kantar Media 1. Figures  are  based  on  the  Kantar  Media  Stradegy™  multimedia  ad  expenditure  database  across  all  measured  media,  including:   Network TV (5 networks); Spot TV (125 DMAs); Cable TV (71 networks); Syndication TV; Hispanic Network TV (4 networks); Consumer Magazines (204 publications); Sunday Magazines (8 publications); Local Magazines (29 publications); Hispanic Magazines (18 publications); Business-to-Business Magazines (304 publications); Local Newspapers (108 publications); National Newspapers (3 publications); Hispanic Newspapers (46 publications); Network Radio (5 networks); National Spot Radio (205 markets); Local Radio (32 markets); Internet search (Google search engine, excluding mobile); Internet display (1,911 sites monitored at least one year); and Outdoor. Figures do not include public service announcements (PSA) or house advertising 2. Cable TV figures based on 67 English language networks and do not include any Hispanic cable networks 3. Spot TV figures based on 658 English language stations in 125 DMAs and do not include any Hispanic stations 4. Spanish Language TV includes 4 Hispanic broadcast networks, 4 Hispanic cable network and 71 local Hispanic TV stations 5. Internet search figures reflect paid activity on Google and are compiled from monthly data on Top 20,000 subdomains. Mobile search spending is not included. 6. Magazine media includes Publishers Information Bureau (PIB) data and reflect print editions of publications 7. Newspaper media figures reflect print editions of publications 8. Local Radio includes expenditures for 32 markets in the U.S. 9. FSI data represents distribution costs only
  • 4. Measured Ad Spending By Advertiser Spending among the ten largest advertisers in 2011 reached $16,061.6 million, a 2.8 percent decline compared to a year ago. Among the Top 100 marketers, a diversified group that represents over twofifths of all measured ad expenditures, full year budgets were down 0.2 percent. For the ninth consecutive year, Procter & Gamble was the top advertiser with spending of $2,949.1 million down 5.4 percent compared to last year. While TV is still the foundation of its advertising media buys, P&G’s  2011  budget  allocation saw share gains for magazines at the expense of TV. AT&T was the second largest advertiser in 2011 with expenditures of $1,924.6 million, a decline of 11.7 percent. Media budgets were severely curtailed during the fourth quarter when the company abandoned its attempted acquisition of T-Mobile, triggering large breakup fees and a huge earnings loss. At Verizon Communications, full year ad spending was $1,636.9 million, a decrease of 11.8 percent. After a string of quarterly budget cuts dating to early 2010, Verizon sharply boosted its spending during the last quarter. The largest growth rate among the Top Ten marketers was posted by Chrysler, up 36.2 percent to $1,193.0 for the full year. The increase was driven by marketing introductions for several new or redesigned models, coupled with the improved sales climate for new vehicles. In contrast, General Motors lowered its 2011 outlays by 16.1 percent to $1,784.1 million. Q4 media budgets dropped 24.7 percent. As factory support has been trimmed, GM dealers have been bearing a larger share of the overall marketing effort. L’Oreal  investments in 2011 rose 18.1 percent to $1,343.5 million as the company expanded marketing support  for  the  L’Oreal  Paris,  Maybelline  and  Garnier  brand  lines. Comcast (+11.3 percent, to $1,577.2 million) and Time Warner (+5.8 percent, to $1,279.4 million) also posted full year spending gains, 1 Top Ten Advertisers Of 2011 Rank 1 2 3 4 5 6 7 8 9 10 Company Year 2011 ($ Millions) Procter & Gamble Co AT&T Inc General Motors Corp Verizon Communications Comcast Corp L'Oreal SA Time Warner Inc Pfizer Inc Chrysler Group LLC News Corp 2 TOTAL $2,949.1 $1,924.6 $1,784.1 $1,636.9 $1,577.2 $1,343.5 $1,279.4 $1,203.5 $1,193.0 $1,170.5 $16,061.6 Year 2010 ($ Millions) $3,116.9 $2,180.0 $2,127.0 $1,856.8 $1,416.6 $1,137.8 $1,209.8 $1,230.8 $875.7 $1,362.2 $16,513.5 Source: Kantar Media 1. Figures do not include FSI, House Ads or PSA activity 2. The sum of the individual companies can differ from the total shown due to rounding % Change -5.4% -11.7% -16.1% -11.8% 11.3% 18.1% 5.8% -2.2% 36.2% -14.1% -2.8%
  • 5. Measured Ad Spending By Category Expenditures for the ten largest categories grew 3.3 percent in 2011 and reached $81,629.2 million Automotive was the leading category in dollar volume and finished 2011 at $13,890.4 million, up 6.3 percent. Category spending growth became increasingly bifurcated during the year with Tier 2 and Tier 3 dealer budgets continuing to expand and Tier 1 manufacturer expenditures flattening. Miscellaneous Retail, which is comprised of all retail segments except Department Stores and Home Improvement purveyors, was the second largest category with 2011 expenditures of $10,019.5 million, up 4.0 percent. Robust ad spending during the critical year-end holiday season bolstered results. Insurance registered the largest growth rate among the Top Ten categories with a 13.5 percent gain to $5,519.0 million. Aggressive competition among auto insurers to gain market share continues to drive media budgets higher. Financial Services totaled $9,059.9 million of spending, a 3.6 percent increase. Growth has been fueled by the credit card segment, offsetting continued weakness in ad budgets for investment products and retail banking. The Telecom category lost ground as 2011 expenditures fell 5.8 percent to $8,649.0 million. Declines were most pronounced among the leading wireless service advertisers. Aggregates expenditures from TV service providers also slowed. Top Ten Advertising Categories Of 2011 Rank 1 Category Year 2011 ($ Millions) Year 2010 ($ Millions) % Change Automotive $13,890.4 $13,062.2 6.3% $8,586.5 $5,303.9 $8,291.6 $4,770.6 3.6% 11.2% $10,019.5 $9,573.3 $9,095.9 $8,649.0 $6,497.7 $6,354.1 $6,155.7 $5,874.7 $5,519.0 $81,629.2 $9,637.4 $8,922.1 $8,778.7 $9,180.4 $6,155.9 $6,644.3 $6,119.0 $5,627.9 $4,862.7 $78,990.7 (Manufacturers) (Dealers) 2 3 4 5 6 7 8 9 10 1 2 Miscellaneous Retail Local Services Financial Services Telecom Personal Care Products Food & Candy Direct Response Restaurants Insurance 3 TOTAL 4.0% 7.3% 3.6% -5.8% 5.6% -4.4% 0.6% 4.4% 13.5% 3.3%
  • 6. Source: Kantar Media 1. Figures do not include FSI or PSA activity 2. Miscellaneous Retail excludes these retail segments: Department Stores, Home Furnishing & Building Supply Stores 3. The sum of the individual categories can differ from the total shown due to rounding Top Spending Advertisers Within Select Media The top ten TV advertisers spent $10,115.4 million in the medium during 2011, down 0.8 percent from a year ago. This group accounted for 14.9 percent of total TV expenditures by all advertisers. 1 Top Ten Television Advertisers Of 2011 Rank 1 2 3 4 5 6 7 8 9 10 Company Procter & Gamble Co. AT&T Inc. General Motors Corp. Verizon Communications Chrysler Group Llc. General Mills Inc. Comcast Corp. Ford Motor Co. Toyota Motor Corp. Time Warner Inc. 2 TOTAL Year 2011 ($ Millions) $1,718.7 $1,332.6 $1,112.2 $1,064.1 $890.4 $842.4 $840.3 $781.0 $767.4 $766.2 $10,115.4 % Change vs. Year Ago -6.8% -12.6% -7.6% -3.9% 38.8% 4.3% 10.6% -3.9% -4.0% 9.8% -0.8% Source: Kantar Media 1 Figures do not include PSA activity 2 The sum of the individual companies can differ from the total shown due to rounding The ten largest Internet advertisers invested a total of $2,360.6 million in paid search and display campaigns, up 10.0 percent versus a year ago. Despite fragmentation on the web, the group accounted for 10.9 percent share of all Internet ad dollars. Top Ten Internet Advertisers Of 2011 (Display + Paid Search) Rank 1 2 3 4 5 6 7 8 9 10 Company IAC/Interactivecorp Experian Group LTD General Motors Corp. AT&T Inc. Progressive Corp. Verizon Communications Inc. Comcast Corp. Capital One Financial Corp. Amazon.com Inc. Ebay Inc. 1 TOTAL Year 2011 ($ Millions) $316.2 $277.8 $270.8 $245.7 $239.7 $230.3 $203.7 $203.4 $199.8 $173.2 $2,360.6 % Change vs. Year Ago 28.9% -5.8% 15.7% 6.3% 22.9% 27.9% 31.8% 0.0% -13.1% -2.0% +10.0% Source: Kantar Media 1. The sum of the individual companies can differ from the total shown due to rounding
  • 7. The top ten advertisers in Hispanic Media spent $1,403.6 million during 2011, an increase of 29.2 percent. This group accounted for 24.7 percent of all Hispanic Media expenditures, the largest Top Ten share concentration of any medium. 1 Top Ten Hispanic Media Advertisers Of 2011 Rank 1 2 3 4 5 6 7 8 9 10 Company Broadcasting Media Partners Procter & Gamble Co. Dish Network Corp. McDonalds Corp. Verizon Communications Inc. AT&T Inc. General Mills Inc. Toyota Motor Corp. Kraft Foods Inc. General Motors Corp. 2 TOTAL Year 2011 ($ Millions) $362.0 $209.6 $153.7 $114.4 $113.2 $111.0 $93.6 $84.6 $82.9 $78.6 $1,403.6 % Change vs. Year Ago 212.9% 9.6% 71.2% -2.6% -16.6% -16.2% 5.1% 8.3% 130.9% -21.8% +29.2% Source: Kantar Media 1. Figures exclude Business-to-Business publications 2. The sum of the individual companies can differ from the total shown due to rounding About Kantar Media Kantar  Media  provides  strategic  advice  and  competitive  intelligence  to  the  world’s  leading  brands,  publishers,   agencies and industry bodies, helping them navigate and succeed in a rapidly evolving media industry. This includes analysis of paid media opportunities; counsel on brand reputation, corporate management and consumer engagement  through  owned  media;;  and,  evaluating  consumers’  reactions  in  earned  media.    Kantar  Media  provides   clients with a broad range of insights from audience research, competitive intelligence, vital consumer behavior and digital insights, to marketing effectiveness and online influence. Our experts currently work with 22,000 companies tracking 3 million brands in 50 countries. www.KantarMediaNA.com. ####