SlideShare a Scribd company logo
1 of 41
Lw r
 oe
Nnh C ro Su y i l e ot 0 2
 it  ab n td F aR p r2 1
              n
Wad
  r
EEGLP
                                                           G P R O JEC T
E CO N O M I C E


                                                       N IN
      MP


                                                  AR


                   W                                   E
              O


                       ER                          L
                            MEN
                                  T A ND GLO   BAL
Table of Contents
Executive Summary.........................................................................................................................i
Introduction..................................................................................................................................... 1
Background...................................................................................................................................... 2
Carbon Modeling........................................................................................................................... 4
Current Carbon Footprint............................................................................................................ 6
Repopulation & Development Scenarios.............................................................................. 8
Repopulation Base Case.............................................................................................................. 8
Repopulation Alternative............................................................................................................ 9
Economic Development Base Case.......................................................................................10
Economic Development Alternative.....................................................................................11
Targets..............................................................................................................................................11
Potential Mitigation Measures.................................................................................................12
Mitigating Residential Emissions............................................................................................15
Behavioral Measures..................................................................................................................16
Development of New Buildings and Neighborhoods
According to Sustainability Guidelines ...............................................................................17
Solar Photovoltaic Panels..........................................................................................................19
Solar Hot Water Heaters.............................................................................................................20
Improved Mechanical and Electrical Systems....................................................................21
Improved HVAC Systems...........................................................................................................21
Improved Lighting Systems......................................................................................................21
Improved Insulation, Doors, and Windows.........................................................................22
Green Spaces.................................................................................................................................22
De-construction............................................................................................................................23
Mitigating Institutional Emissions.........................................................................................23
Mitigating Commercial Emissions..........................................................................................24
Conclusions....................................................................................................................................25
References.......................................................................................................................................31
Acknowledgments.......................................................................................................................35
Table of Tables
Table 1. Estimated Current Commercial and Institutional Sources of Emissions.... 7
Table 2. Repopulation Scenarios............................................................................................... 9
Table 3. Assumed Commercial and Institutional Activity..............................................10
Table 4. Estimated Future Carbon Footprints....................................................................11
Table 5. Estimated Mitigation Required to Achieve L9W Goal.....................................12
Table 6. Estimated Mitigation Required to
Achieve Obama Administration Goal...................................................................................12
Table 7. Residential Mitigation Measures
and Net Costs Per Ton of Carbon Saved...............................................................................13
Table 8. Residential, Commercial, and Institutional
Mitigation Costs to Achieve Administration Goal............................................................14


Table of Figures
Figure 1. Map................................................................................................................................... ii
Figure 2. Solar Hot Water Heaters...........................................................................................20
Figure 3. Carbon Mitigation Measures: Costs.....................................................................27
Figure 4. Carbon Mitigation Measures: Costs After Energy Savings..........................28
Figure 5. Carbon Mitigation Measures: Costs After Energy & Tax Savings...............29
Figure 6. Carbon Mitigation Measures: Household Costs..............................................30
Executive Summary
                               New Orleans’ Lower 9th Ward (L9W) was devastated in 2005 by Hurricane
                               Katrina and the subsequent flooding that resulted from the failure of the In-
                               dustrial Canal levee. The community has been slow to recover. As of 2010, the
                               L9W had about one-quarter of its pre-Katrina population levels, compared
                               with more than three-quarters for all of New Orleans. The L9W has commit-
                               ted to recovering from Hurricane Katrina in a sustainable manner. The Lower
                               9th Ward Center for Sustainable Engagement and Development (CSED) has
                               expressed a goal of creating a prosperous, sustainable community that is carbon
                               neutral by 2020 and climate neutral by 2030.

                               Lafayette College’s Economic Empowerment and Global Learning Project
                               (EEGLP) has been working with CSED since 2007 to investigate sustainable
                               development policies and practices. In July 2009, EEGLP faculty and students
                               began working with CSED on a study of the carbon impacts of L9W repopula-
                               tion and economic development alternatives and the most cost-effective means
                               of mitigating such impacts. This report presents the findings of that study.

                               The study estimated the current carbon footprint of the L9W and forecasted
                               future footprints under alternative repopulation and development scenarios.
                               All scenarios assumed a return to pre-Katrina population levels in the L9W,
                               but varied in terms of population distributions and economic development.

                               Mitigation necessary to meet targets defined by CSED and the Obama admin-
                               istration was investigated, and mitigation costs were estimated. Potential miti-
                               gation measures included behavioral changes as well as development of new
                               homes and neighborhoods according to sustainability guidelines; installation
                               of solar photovoltaic panels; installation of solar hot water heaters; installation
                               of insulation and new doors and windows in existing buildings; installation
                               of high-efficiency mechanical and electrical systems in existing buildings; and
                               development of open spaces, among others.

                               While it does not appear feasible for the L9W to repopulate to pre-Katrina
                               levels and develop economically without increasing its carbon footprint, it does
                               appear feasible to repopulate while meeting the Obama administration goal
                               of reducing carbon emissions to 17 percent below 2005 levels. To do so could
                               involve costs ranging up to $5 million per year, depending on repopulation
                               and development policies and the mitigation measures employed. Economic
                               development, while highly desirable, would significantly increase the challenge
                               of meeting the Obama administration goal.

                               The most cost-effective mitigation measures involve behavioral changes. Aware-
                               ness of energy use can lead to reductions in usage. Use of compact fluorescent
                               light bulbs (CFLs) and reduced use or elimination of window air condition-
                               ers, clothes dryers, and dishwashers can reduce carbon emissions while saving
                               money. Unfortunately, behavioral changes have limited mitigation capacity.

Carbon Study Final Report 2012		                                                                                     i
Development of green spaces also has minimal costs but limited mitigation
          capacity. However, behavioral changes and green spaces contribute to commu-
          nity sustainability in a broader sense, so are highly desirable.

          Solar hot water heaters are also cost-effective, saving a homeowner almost $200
          per year. In addition, installation of solar hot water heaters has significant miti-
          gation capacity, making this among the most desirable mitigation measures.
          Solar panels and improved mechanical and HVAC systems will also save a
          homeowner, solar panels more so than HVAC systems, but neither as much as
          solar hot water heaters.

          Sustainable design and construction practices are estimated to cost no more
          than $1,100 per household per year over a 30 year lifetime. Such practices
          have the greatest mitigation capacity among the potential measures that were
          investigated, so opportunities to reduce net costs through subsidies or incen-
          tives should be investigated.


                                            Figure 1.
                           Lower Ninth Ward Map
                        Bayou
        nal


                           Beinvenue
    l Ca
  stria


              Galv
                  ez S
                       t
 Indu


                                                                          Lake Pontchartrain
        Claib     Lower Ninth
               orne
                    Ave
                        Ward
  St. C
    Hollaude A
                   ve

        Holy Cross


          Mississippi River                                              New Orleans


ii 									                                                                                     Carbon Study Final Report 2012
Introduction
                               New Orleans’ Lower 9th Ward (L9W) was devastated in 2005 by Hurricane
                               Katrina and the subsequent flooding that resulted from the failure of the In-
                               dustrial Canal levee. The community has been slow to recover. As of 2010, the
                               L9W had about one-quarter of its pre-Katrina population levels, compared
                               with more than three-quarters for all of New Orleans (U.S. Census Bureau,
                               2011). The Holy Cross neighborhood has experienced more rapid repopula-
                               tion than the rest of the L9W, with almost half of pre-Katrina population
                               levels, compared to less than one-quarter for the rest of the L9W (U.S. Census
                               Bureau, 2011; Greater New Orleans Community Data Center, 2010). Areas
                               of the L9W remain largely vacant, with governmental and community institu-
                               tions and commercial establishments slow to return.

                               The L9W has committed to recovering from Hurricane Katrina in a sustain-
                               able manner. A series of public meetings in 2006 led to preparation of a “Sus-
                               tainable Restoration Plan of Holy Cross/Lower 9th Ward”. In 2007, the Holy
                               Cross Neighborhood Association established the Lower 9th Ward Center for
                               Sustainable Engagement and Development (CSED), with the objective of en-
                               couraging sustainable economic development and stimulating civic engage-
                               ment. Specifically, CSED has expressed a goal of creating a prosperous, sustain-
                               able community that is carbon neutral by 2020 and climate neutral by 2030
                               (City of New Orleans Carbon Footprint Report, 2009). Numerous groups,
                               including civic, educational and religious institutions, Global Green, The Si-
                               erra Club, Common Ground, and Make it Right, have assisted CSED and the
                               L9W community in working to achieve this goal.


Carbon Study Final Report 2012		                                                                                  1
Lafayette College’s Economic Empowerment and Global Learning Project
  (EEGLP) has been working with CSED since 2007 to investigate sustainable
  development policies and practices. Previous projects have included develop-
  ment of a conceptual plan for a “green” lifestyle center at the intersection of St.
  Claude and Caffin Avenues; a study of the feasibility of converting the former
  McDonogh 19/Louis Armstrong school on St. Claude Avenue into an arts,
  culture and civic engagement center; and support for community gardens and
  urban agriculture throughout the L9W.

  In July 2009, EEGLP faculty and students began working with CSED on a
  study of the carbon impacts of L9W repopulation and economic development
  alternatives and the most cost-effective means of mitigating such impacts. In
  January 2010, at a meeting at the Center for Bioenvironmental Research at
  Tulane and Xavier Universities (CBR), EEGLP faculty and students present-
  ed their progress in modeling the L9W’s carbon footprint. In January 2011,
  EEGLP faculty and students presented another progress report at CBR, fore-
  casting the L9W’s carbon footprint under alternative repopulation and eco-
  nomic development scenarios; determining the mitigation necessary to achieve
  the L9W’s goal of carbon-neutrality under each scenario; and estimating the
  costs of potential mitigation measures. In August 2011, EEGLP faculty and
  students presented another progress report to CSED, estimating the net costs
  of mitigation to achieve the community’s goals, considering savings from en-
  ergy costs as well as tax incentives for mitigation measures. This report presents
  the findings of the study.


  Background
  In 2007, the Intergovernmental Panel on Climate Change (IPCC) determined
  that, without doubt, significant climate change is occurring, and that there is
  a 90 percent probability that the change is due to human activity, particularly
  the burning of fossil fuels and clearing of natural vegetation (IPCC, 2007).
  Climate change resulting from human activity is one of the most critical prob-
  lems facing society. Without significant reduction of greenhouse gases (GHG)
  emitted by burning fossil fuels, temperatures will continue to increase; sea lev-
  els will continue to rise; precipitation patterns will change; and extreme cli-
  mactic events, such as hurricanes and droughts, will increase in severity and
  frequency. Given its location and topography, such trends are likely to have a
  particularly severe impact on New Orleans.

  Recent observations indicate that climate change is occurring more rapidly
  than envisioned just a few years ago. Ocean warming is about 50 percent
  greater than had been predicted in 1990; sea levels have risen faster than fore-
  casted; ice coverage has shrunk; and levels of carbon dioxide (CO2) in the
  atmosphere have risen beyond what some scientists consider to be the “dan-
  gerous anthropogenic interference” (DAI) level, a level beyond which climate

2 									                                                                             Carbon Study Final Report 2012
disaster is imminent (U.S. Global Change Research Program, 2009; Kolbert,
                               2009). Extreme climate events are occurring more frequently (National Re-
                               search Council, 2011).

                               Although the recent economic recession resulted in a decline in U.S. energy
                               use and, therefore, carbon emissions, emissions in 2010 saw the largest increase
                               ever recorded (Gillis, 2011). Continued increases are expected as the economy
                               recovers and develops, unless measures to cost-effectively reduce energy use
                               and mitigate carbon emissions are implemented (National Research Council,
                               2011).

                               The U.S. is not the global leader in GHG emissions, which are currently more
                               than 30 million kilotons (kt) per year; carbon emissions from the U.S. had
                               been steady at about 5.5 million kt per year prior to the recent economic re-
                               cession (World Bank, 2011). China passed the U.S. in 2005 and is currently
                               responsible for more than 7 million kt per year. China has been the major
                               contributor to global increases over the past few years. Nevertheless, the U.S.
                               remains a major contributor to global emissions (India and Brazil, the next
                               largest emitters, each account for about 1.7 million kt per year), but has not
                               been a leader in global efforts to address climate change. Lack of a national
                               energy policy reflects the gridlock in national fiscal, social, healthcare, trans-
                               portation, etc., policies.

                               New Orleans is among the U.S. cities that are most vulnerable to the impacts
                               of climate change. Its tropical temperatures will increase as a result of global
                               warming, increasing cooling costs and the risk of heat-related health problems
                               for the elderly, the very young, and the ill. With much of the city below sea
                               level, increases in sea levels will threaten the city’s survival. Being adjacent to
                               the Gulf of Mexico and surrounded by water, additional or stronger hurricanes
                               are a particular problem, as evidenced by the devastation caused by Hurricane
                               Katrina in 2005.

                               In 1999 – well before the Katrina disaster – New Orleans joined the Interna-
                               tional Council for Local Environmental Initiatives (ICLEI) as a member of the
                               Cities for Climate Protection (CCP) campaign. In 2009, the city completed
                               an analysis of its carbon footprint using the CCP/ICLEI model (City of New
                               Orleans Carbon Footprint Report, 2009).

                               While the human causes of climate change are widely accepted and there is
                               growing support for mitigation, important questions remain concerning the
                               costs and impacts on economic development of climate change mitigation ef-
                               forts. The L9W is trying to balance environmental impacts with the need to
                               repopulate and develop its economy to recover from Hurricane Katrina. The
                               purpose of this study is to assist the L9W in achieving those goals by analyzing
                               the carbon impacts of alternative repopulation and development policies and
                               the cost-effectiveness of potential measures to mitigate such impacts.


Carbon Study Final Report 2012		                                                                                     3
Carbon Modeling
  Emissions of CO2 are considered to be a primary cause of the enhanced green-
  house effect, in which GHGs such as CO2 collect in the upper levels of the
  Earth’s atmosphere and form an insulating layer, preventing heat in the Earth’s
  atmosphere from being released into space (Intergovernmental Panel on Cli-
  mate Change, 2007). While the greenhouse effect allows life to survive on
  Earth, failure to release heat into space at the same rate that it is absorbed by
  the Earth’s atmosphere results in global warming and climate change. The prin-
  cipal causes of GHG emissions are burning of fossil fuels and cutting down of
  trees (U.S. Global Change Research Program, 2009).

  While CO2 is the most significant GHG, gases such as methane, nitrous ox-
  ide, fluorocarbons, and others, as well as water vapor, also contribute to the
  enhanced greenhouse effect. In order to reflect this, carbon footprints are typi-
  cally expressed as “carbon equivalents”, including major GHGs.

  Numerous carbon calculators have been developed for residences, businesses,
  industries, etc. (Padgett et al., 2008). Our analyses were based on carbon calcu-
  lators developed by the U.S. Environmental Protection Agency (EPA).

  Carbon footprints are the most widely used measure of emissions of CO2 and
  other GHGs. A carbon footprint can be used to estimate emissions of GHGs
  by industries, individuals, households, or geographical areas, based primarily
  on use of fossil fuels for generation of electricity, transportation, and other
  purposes.

  Carbon footprints can be defined in terms of three levels of scope: (City of New
  Orleans Carbon Footprint Report, 2009). For the purposes of this analysis:

  •	 Scope 1 emissions are generated within the L9W, from residential, trans-
     portation, commercial, and governmental/institutional sources
  •	 Scope 2 emissions are generated outside the L9W due to demand within
     the L9W, mainly due to electrical power generation
  •	 Scope 3 emissions are all indirect emissions not covered in Scope 2, such as
     those resulting from production or transport of purchased materials.

  This analysis primarily addressed Scope 1 and 2 emissions; Scope 3 emissions
  are typically not included in carbon footprints because they are very difficult to
  quantify for a specific location. However, Scope 3 emissions due to food were
  included in this analysis, because it makes comparisons between the L9W and
  the U.S. more consistent. It should be noted that scopes are relative to the geo-
  graphic entity being analyzed, i.e., some Scope 3 emissions of the L9W would
  be recorded as Scope 1 or 2 emissions for Louisiana and the U.S.

  This analysis addressed residential, commercial, and governmental/institution-
  al sources of emissions. Industrial sources, such as the Industrial Canal; Alabo
  Street, Andry Street, and Maurice Avenue wharves; and the sewage treatment
  plant, were not included. Jackson Barracks was also not included. The intent

4 									                                                                            Carbon Study Final Report 2012
was to focus on mitigation sources that the L9W community was most likely
                               to be able to influence.

                               Carbon footprint was used in this analysis as a proxy for environmental sustain-
                               ability. This is somewhat simplistic, since environmental sustainability involves
                               many resources. However, carbon footprint was determined to be a reasonable
                               proxy for the environmental sustainability of repopulation and development
                               alternatives for the purposes of this analysis because:

                               •	 CSED has specifically identified carbon-neutrality as a goal
                               •	 the Obama administration has expressed a specific goal of reducing carbon
                                  levels to 17 percent below 2005 levels by 2020
                               •	 carbon modeling and calculation of carbon footprints are relatively well-
                                  established and widely used as indicators of environmental sustainability
                               •	 markets for trading carbon emissions exist in some states and countries,
                                  providing an opportunity to incorporate market-based consideration on
                                  the analyses.

                               Consistent with the concepts reflected in corporate references to the “triple
                               bottom line” (financial, environmental and societal) and the EPA’s P3 (People,
                               Prosperity, and Planet) program, sustainable repopulation and development
                               require a much broader perspective than just environmental sustainability. In
                               addition to being environmentally sustainable, repopulation and development
                               alternatives must be economically, financially, socially, culturally, organization-
                               ally, and politically sustainable.


Carbon Study Final Report 2012		                                                                                     5
Current Carbon Footprint
  The carbon footprint of the L9W was estimated based on a series of analyses
  employing data that was increasingly specific to the L9W. To the extent pos-
  sible, analyses were based on 2010 U.S. Census data.

  Census data indicated a population of 2,714 in 1,040 households in the Holy
  Cross neighborhood and a population of 2,842 in 1,061 households in the
  remainder of the L9W in 2010 (U.S. Census Bureau, 2011). Based on house-
  holds receiving mail in 2005, these values would indicate that the Holy Cross
  neighborhood had reached about 43 percent of pre-Katrina levels, while the
  remainder of the L9W had reached about 19 percent of pre-Katrina levels
  (GNOCDC, 2010). It should be noted that, consistent with trends through-
  out New Orleans, household size has decreased since 2005 due to fewer chil-
  dren. In 2005, the average household size in the L9W, including the Holy
  Cross neighborhood, was approximately 2.8 people per household; in 2010,
  it was approximately 2.65 people per household. In the L9W and Holy Cross
  neighborhoods, this pattern may also reflect fewer multi-generational, extend-
  ed families than before Katrina.

  While U.S. Census data were used in these analyses, it should be acknowledged
  that such data is often criticized for undercounting low income and minority
  residents. In comparison with the 2010 Census data indicating 1,040 house-
  holds in the Holy Cross neighborhood and 1,061 households in the remainder
  of the L9W, the Greater New Orleans Community Data Center (GNOCDC)
  estimated that 1,226 households in the Holy Cross neighborhood and 1,271
  households in the remainder of the L9W were receiving mail in June 2010
  (GNOCDC, 2010).

  An initial analysis was based on data specific to New Orleans, as reported in the
  City of New Orleans Carbon Footprint Report issued in July 2009. The report
  presents emission and population data for 2007. Based on the assumption that
  carbon emissions per household in New Orleans remained constant between
  2007 and 2010, average 2007 carbon emissions per household for New Or-
  leans and population levels in the L9W as of June 2010 were used to estimate
  the current carbon footprint of the L9W. The analysis included emissions from
  governmental, residential, and commercial sources; industrial sources of emis-
  sions were not included.

  Based on the New Orleans carbon footprint data, carbon equivalent emissions
  from residential, commercial, and governmental sources in the L9W for 2007,
  based on the percentage of the city population in the L9W, were estimated to
  be 40,000 tons per year. Based on an estimate of 1,375 households in the L9W
  (including Holy Cross) in 2007, this represents an average of 55,000 to 60,000
  pounds per year per household, with 40,000 to 45,000 pounds per year of this
  due to residential, transportation and waste sources, and 15,000 to 20,000
  pounds per year due to commercial and governmental sources (GNOCDC,
  2010; Carbon Footprint Report, 2009). Assuming that average emissions per
  household remained constant between 2007 and 2010, the carbon footprint

6 									                                                                           Carbon Study Final Report 2012
of the L9W in 2010 was estimated, based on city-wide data, to be 60,000 tons
                               per year of carbon equivalents; of this, 40,000 tons were due to residential
                               sources and approximately 20,000 tons were due to commercial and govern-
                               mental sources.

                               Another analysis employed a model developed by EEGLP specifically for the
                               L9W, including a carbon calculator based on the EPA model. The model esti-
                               mated approximately 45,000 pounds per year per household of carbon equiva-
                               lent emissions from residential sources, for a total of approximately 47,250
                               tons per year in the L9W. With an estimated 12,336 tons per year from com-
                               mercial and institutional (including governmental) sources, as shown in Table
                               1, the total current L9W carbon footprint was estimated to be approximately
                               59,600 tons per year, essentially the same as the estimate based on city-wide
                               data.

                                   Table 1. Estimated Current Commercial and Institutional Sources of Emissions


                                         Activity                Ave.          Establishments        Total (tons)
                                     Grocery/Convenience                395                     4           1,580
                                       Fast food/restaurant             344                     6           2,064
                                                Retail store            211                     4             844
                                            Bank/financial              401                     2             802
                                        Gas/service station             164                     9           1,476
                                       Beauty/barber shop               164                     4             656
                                                    Church              83                      15           1245
                                                    School              488                     1             488
                                              Social center             282                     2             564
                                             Total L9W Commercial and Institutional
                                                                                                           12,336
                                                          Emissions

                               Based on these estimates, without reductions in the carbon footprint per house-
                               hold, repopulation is projected to result in proportional increases in the carbon
                               footprint of the L9W at a rate of about 45,000 pounds per year per household.
                               Economic development, including increases in the incomes of L9W residents
                               and development of commercial and institutional activity in the L9W, may
                               also result in increases in its carbon footprint, since households with higher
                               incomes tend to generate higher GHG emissions, and new or recovered busi-
                               nesses or institutions in the L9W will represent new sources of such emissions
                               (Grubb, Muller and Butler, 2004). In the absence of cost-effective mitigation,
                               repopulation and development of the L9W will increase its carbon footprint,
                               making achievement of the goal of carbon-neutrality more difficult.


Carbon Study Final Report 2012		                                                                                    7
Repopulation &
  Development Scenarios
  Four scenarios were developed to represent alternative future levels and pat-
  terns of repopulation and economic development in the L9W. The scenarios
  are consistent with the objectives of the L9W community, the New Orleans
  Master Plan, and local zoning ordinances. A carbon footprint was estimated
  for each scenario.

  The four scenarios were based on two repopulation alternatives and two eco-
  nomic development alternatives. All scenarios assumed a return to pre-Katrina
  population levels in the L9W, resulting in a total of about 7,600 households
  of approximately 2.8 persons per household for a total population of about
  21,000 (U.S. Census Bureau, 2000; GNOCDC, 2010). This assumption is
  consistent with the community goal of returning to pre-Katrina population
  levels in order to ensure the social, economic and political viability of the L9W
  (Sustainable Restoration Plan…, 2006).


  Repopulation Base Case
  The repopulation base case assumed that repopulation will approximate pre-
  Katrina distributions, with about one-third in the Holy Cross neighborhood
  and two-thirds in the remainder of the L9W. For this analysis, the L9W out-
  side the Holy Cross neighborhood was divided into two areas: the area between
  St. Claude Avenue and Galvez Street, and the area north of Galvez. Table 2
  presents estimates of pre-Katrina and June 2010 population levels in the Holy
  Cross neighborhood, the area north of Galvez Street, and the area between St.
  Claude Avenue and Galvez Street. The table also shows the numbers of ad-
  ditional households required in these areas to achieve pre-Katrina population
  levels under the repopulation base case.

8 									                                                                           Carbon Study Final Report 2012
Repopulation Alternative
                               The repopulation alternative assumed that future repopulation will be clustered
                               more densely in areas of higher elevation (generally above Mean Sea Level, as
                               approximated in the L9W by Galvez Street). This assumption is consistent with
                               the community goal of reducing the demographic footprint of the L9W and
                               concentrating future repopulation in areas of higher elevation in the southern
                               portion of the neighborhood (Sustainable Restoration Plan…, 2006). It is also
                               consistent with the concepts of sustainable engineering and the New Orleans
                               Master Plan.

                               All scenarios assumed that existing development in areas of lower elevation
                               north of Galvez Street will be maintained, and that currently unoccupied
                               houses north of Galvez (estimated at approximately 245) will be occupied, but
                               the repopulation alternative assumed that no new houses will be built north
                               of Galvez. Table 2 shows the estimated numbers of additional households re-
                               quired in the Holy Cross neighborhood and the area between St. Claude Av-
                               enue and Galvez Street to achieve pre-Katrina L9W population levels under
                               the repopulation alternative (GNOCDC, 2010).

                                                           Table 2. Repopulation Scenarios


                                                                                     Additional     Additional
                                                     Households     Households       Households     Households
                                        Area
                                                       2005          June 2010      Repopulation   Repopulation
                                                                                      Base Case     Alternative
                                     Holy Cross
                                                       2240             1040            1200          2625
                                   Neighborhood
                                   St. Claude Ave.
                                                       2680             795             1885          2630
                                    to Galvez St.
                                     North of
                                                       2680             265             2415           245
                                     Galvez St.
                                        Total          7600             2100            5500          5500

                               Clustering repopulation growth in a smaller footprint would be expected to
                               reduce per household emissions, based on evidence that density and per house-
                               hold emissions are inversely related (Ewing and Rong, 2008). This was incor-
                               porated in the estimates of carbon footprint by adjusting household emissions
                               by a factor representing assumed density.

                               If future repopulation is concentrated south of Galvez, the area between Galvez
                               and St. Claude would be expected to increase from low to medium density,
                               while the Holy Cross neighborhood would remain high density and the area
                               north of Galvez would remain low density. Based on previous research, it was
                               estimated that household emissions in low density areas would be approxi-
                               mately 45 percent higher than in medium density areas, for a total of 65,250
                               pounds per year, while household emissions in high density areas would be
                               approximately 45 percent lower than in medium density areas, for a total of
                               24,750 pounds per year (Norman, MacLean and Kennedy, 2006).

Carbon Study Final Report 2012		                                                                                  9
Economic Development Base Case

  The economic development base case assumed that household incomes in the
  L9W, adjusted for inflation, will return to pre-Katrina levels, approximately
  $27,500 per year (U.S. Census, 2000). It also assumed that commercial and
  institutional activity will return to estimated pre-Katrina levels.
  	
  Table 3 shows assumed L9W commercial and institutional activity for the eco-
  nomic development base case under each repopulation scenario. The repopu-
  lation alternative reflects slightly lower levels of commercial and institutional
  activity in the L9W than the repopulation base case, on the assumption that
  some commercial and institutional activity is geographically-dependent, i.e., if
  repopulation north of Galvez is limited to existing houses, fewer commercial
  and institutional activities will locate there.

                     Table 3. Assumed Commercial and Institutional Activity

                                                                  Repop alternative/dev base
                            Repop/dev base case
                                                                             case
    Commercial            Establish-         Emissions            Establish-      Emissions
     Activities             ments             (Tons)                ments          (Tons)
      Grocery/
    convenience              10                 3950                  8             3160
       store
   Fast food/res-
                             20                 6880                 18             6192
      taurant
    Retail store             20                 4220                 23             4853
    Gas/service
                             25                 4100                 22             3608
      station
   Beauty/barber
                              6                 984                   6              984
       shop
       Motel                  1                 799                   1              799
       Office                22                 8822                 19             7619
   Funeral home               1                 282                   1              282
   Bank/financial
                              5                 2005                  3             1203
     institution
   Entertainment              2                 422                   1              211
                                       Institutional Activities
      Church                 15                 1245                 14             1162
      School                  5                 2440                  5             2440
   Cultural/social
                              4                 1128                  4             1128
       center
   Police station             0                   0                   0               0
    Fire station              0                   0                   0               0
     Post office              0                   0                   0               0
           Total Emissions                     37,277                               33,641


10 									                                                                                   Carbon Study Final Report 2012
Economic Development Alternative
                               The economic development alternative assumed that the L9W average house-
                               hold income will increase to the U.S. national average income level, about
                               $50,000 per year, an increase of approximately 82 percent over pre-Katrina
                               levels (American Community Survey, 2010). Under this scenario, the carbon
                               footprint of households in the L9W and Holy Cross neighborhood was as-
                               sumed to be the same as for the U.S., so values from the U.S. State Depart-
                               ment’s Climate Action Report were used in the analyses for the economic de-
                               velopment alternatives. As previously mentioned, the scopes involved in the
                               analysis of the L9W and the U.S. differ somewhat in that some Scope 3 L9W
                               emissions are actually a part of Scope 1 and 2 U.S. emissions. However, the
                               Climate Action Report does not include Scope 3 emissions for the entire U.S.,
                               so the data is comparable to data previously used in this analysis. The national
                               average carbon footprint is 104,000 pounds per household.

                               Table 4 shows carbon footprints, expressed as tons of carbon equivalents per
                               year for each scenario, unless mitigated. No timing was assigned to the scenar-
                               ios. As discussed previously, the current L9W carbon footprint was estimated
                               to be approximately 60,000 tons per year, with approximately one-quarter of
                               its pre-Katrina population.


                                                     Table 4. Estimated Future Carbon Footprints

                                                                                 Repopulation
                                      Development
                                                                     Base Case                     Alternative
                                        Base Case                205,000 tons/year           150,000 tons/year
                                       Alternative               395,000 tons/year           302,000 tons/year


                               Targets
                               The L9W community has expressed a goal of achieving carbon-neutrality by
                               2020. If this goal is understood to require a target carbon footprint of zero tons
                               per year, the estimated future footprints shown in Table 4 would have to be
                               completely offset by mitigation measures. This appears to be very difficult to
                               achieve, if not impossible.

                               If, however, this goal is understood to mean that future repopulation and de-
                               velopment should not increase the L9W carbon footprint beyond its current
                               level, a carbon footprint of approximately 60,000 tons per year would be the
                               target. Table 5 shows the mitigation necessary under each scenario to achieve
                               this goal.


Carbon Study Final Report 2012		                                                                                    11
Table 5. Estimated Mitigation Required to Achieve L9W Goal

                                                  Repopulation
         Development
                                      Base Case                  Alternative
          Base Case               145,000 tons/year           90,000 tons/year
          Alternative             335,000 tons/year           242,000 tons/year
  	
  The Obama administration has expressed a goal of reducing carbon emissions
  to 17 percent below 2005 levels. Based on pre-Katrina population and as-
  sumed commercial and institutional activity in the L9W, the 2005 L9W foot-
  print was estimated to have been approximately 208,000 tons from residential,
  commercial, and institutional sources. Achieving the Obama administration
  goal would define a target for the L9W of approximately 173,000 tons per
  year. Table 6 shows the mitigation necessary under each scenario to achieve
  this goal.

     Table 6. Estimated Mitigation Required to Achieve Obama Administration Goal

                                                  Repopulation
         Development
                                      Base Case                  Alternative
          Base Case               32,000 tons/year               0 tons/year
          Alternative             222,000 tons/year           129,000 tons/year


  Potential Mitigation
  Measures
  The costs and capacities of potential measures to mitigate carbon emissions
  were analyzed in terms of annual costs per ton of carbon mitigated and tons
  of carbon mitigated per year. Some mitigation measures involve behavioral
  choices, such as thermostat settings; use of public transportation; and use of
  a dishwasher, clothes dryer, air conditioning, compact fluorescent lighting
  (CFL), etc. Such measures may involve no cost and could generate savings.
  Other measures involve construction or renovation activities, including:

  •	 development of new homes and neighborhoods according to sustainability
     guidelines
  •	 installation of solar photovoltaic panels on existing and new buildings
  •	 installation of solar hot water heaters in existing and new homes
  •	 installation of energy-efficient mechanical and electrical systems in existing
     homes
  •	 installation of energy-efficient insulation, doors and windows in existing
     homes
  •	 de-construction and re-use of building materials
  •	 development of green spaces and urban agriculture


12 									                                                                          Carbon Study Final Report 2012
Mitigation measures were investigated for residential, commercial, and insti-
                               tutional sources of emissions. Savings resulting from energy reductions, tax
                               credits, and other financial incentives were considered.

                               Table 7 shows annualized costs and carbon savings for potential mitigation
                               measures for individual households as well as for the entire L9W. As shown,
                               “costs” ranged from savings of approximately $100 per year per household for
                               a solar hot water heater to an annualized cost of almost $1,100 per year for a
                               house designed and constructed according to sustainability guidelines. Mitiga-
                               tion capacities ranged from 0.2 tons per year of carbon mitigated per house-
                               hold for improved doors and windows and insulation, to over 10 tons per year

                                   Table 7. Residential Mitigation Measures and Net Costs Per Ton of Carbon Saved


                                                                                                                    Annual
                                                                             Annual                      Annual
                                                                                                                     L9W
                                      Annual          Annual Carbon           Cost/                        L9W
                 Mitigation                                                             Annual Cost                  Cost/
                                      Cost per         Savings per           Ton of                      Carbon
                 Measure                                                                   L9W                      Ton of
                                     Household       Househould(tons)        Carbon                      Savings
                                                                                                                    Carbon
                                                                             Saved                        (tons)
                                                                                                                    Saved
               Natural Drying            $0                 0.68                  $0        $ -           5,141      $0
                     CFLs                $0                 0.50                  $0         $ -          3,830      $0
              Natural cooling            $0                 0.33                  $0        $ -            662
              Dishwashing by
                                         $0                 0.32                  $0         $ -          2,441      $0
                  Hand
              Solar Hot Water
                                        $100                1.41                  $71     $555,300        7,821      $71
                  Heater
                Solar Panels             $61                2.21                  $28     $466,500        16,777     $28
                    HVAC                 $9                 4.45                  $2      $18,000         8,900      $2
              Green Design &
                                       ($1,090)             10.12             ($108)    ($5,495,000)      51.011    ($108)
               Construction
             Lighting Controls         ($101)               0.80              ($126)     ($202,000)       1,600     ($126)
              Doors and Win-
                                        ($59)               0.20              ($295)     ($118,000)        400      ($297)
                  dows
                 Insulation             ($92)               0.20              ($654)     ($262,000)        400      ($654)
                                         Total Residential Mitigation Potential                           98,983


                               for a house designed and constructed according to sustainability guidelines.
                               As shown, the maximum mitigation capacity of these measures is approximate-
                               ly 100,000 tons per year, so mitigation of residential sources does not appear
                               to be sufficient to meet targets based on the L9W’s goal of carbon-neutrality
                               except under the economic development base case/repopulation alternative
                               scenario, if carbon-neutrality is understood to mean repopulating and devel-
                               oping without increasing the current L9W carbon footprint of approximately
                               60,000 tons per year.

                               It does appear possible to meet the Obama administration goal of reducing
                               carbon emissions to 17 percent below 2005 levels with residential mitigation
                               measures, under the economic development base case, i.e., incomes and eco-

Carbon Study Final Report 2012		                                                                                             13
nomic activity in the L9W return to pre-Katrina levels. As shown in Table 6,
  no mitigation would be required under the economic development base case/
  repopulation alternative scenario; a combination of behavioral changes and
  solar based measures could easily meet the mitigation required under the eco-
  nomic development base case/repopulation base case scenario.

  Economic development, while highly desirable, increases mitigation require-
  ments significantly. It may be possible to achieve, or nearly achieve, the Obama
  administration goal for the economic development alternative/repopulation al-
  ternative scenario if mitigation from commercial and institutional sources is
  included, but achieving the Obama target under the economic development
  alternative/repopulation base case scenario would require extraordinary efforts,
  perhaps including development of a solar power plant in the L9W or signifi-
  cant improvements in public transportation.

  Commercial and institutional mitigation measures were estimated using the
  same methods as for residential mitigation, since many methods for residential
  mitigation would also be practical for the types of smaller commercial and
  institutional establishments that exist and are likely to develop in the L9W.
  Mitigation estimates were very approximate, due to the unpredictability of fu-
  ture commercial and institutional development in the L9W. Since commercial
  and institutional sources represent a relatively minor portion of the L9W car-
  bon footprint, such approximations appeared reasonable. Potential mitigation
  from commercial and institutional sources was estimated to be approximately
  12,000 to 20,000 tons per year.

  Minimum costs for achieving the Obama administration goals through resi-
  dential, commercial and institutional measures are shown in Table 8. They
  range from zero to over $5 million per year, which would achieve the maxi-
  mum mitigation from residential, commercial and institutional sources but
  would still not meet the Obama goal under the economic development alter-
  native/repopulation base case scenario; extraordinary measures would be re-
  quired under that scenario to mitigate approximately 90,000 to 100,000 tons
  per year of GHG emissions beyond that which could be mitigated by resi-
  dential, commercial and institutional measures. These costs were based on the
  assumption that mitigation measures would be implemented in order of their
  cost-effectiveness, i.e., the most cost-effective measures would be implemented
  before less cost-effective measures.


  Table 8. Residential, Commercial, and Institutional Mitigation Costs to Achieve Obama
                                   Administration Goal

                                                       Repopulation
         Development
                                         Base Case                    Alternative
           Base Case                   $891,857/year                   $0/year
          Alternative                 ($5,036,171/year)*         ($5,036,171/year)*
  *Goal unattainable with current mitigation measures

  Figure 1 shows graphically the mitigation necessary to achieve the Obama ad-

14 									                                                                              Carbon Study Final Report 2012
ministration goal under the four scenarios and the direct costs. The most cost-
                               effective measures are toward the left end of the horizontal axis, as reflected
                               in the estimated cost per ton of carbon mitigated measured on the vertical
                               axis. Mitigation capacities (Carbon Saved) are measured along the horizontal
                               axis. Figure 2 shows mitigation costs net of any savings resulting from reduced
                               energy usage; Figure 3 shows mitigation costs net of energy savings and tax
                               or other incentives. Figure 4 shows mitigation measures on a household basis
                               (therefore resulting in different mitigation capacities) and is the same as Figure
                               3 but without green design (since on a household basis green design would be
                               double counting the individual measures taken).

                               Numerous assumptions were necessary to estimate costs and mitigation ef-
                               fectiveness and capacities of such measures. These are described in following
                               sections.


                               Mitigating Residential Emissions

                               Numerous potential measures are available to mitigate emissions from resi-
                               dences. These include behavioral measures, which involve no cost, or even sav-
                               ings, but could involve an inconvenience to L9W residents. Others require
                               design or construction and involve costs.


Carbon Study Final Report 2012		                                                                                    15
Behavioral Measures

  There are many ways to save energy (and money) in the home that cost little
  or nothing. It has been estimated that behavioral changes by community resi-
  dents, including changing thermostat settings, reducing lighting, using pub-
  lic transportation, and other measures, could reduce energy costs by about
  $7,000 per year per household; reduce energy use by 15 percent per year per
  household; and reduce carbon emissions by almost 25,000 pounds per year per
  household (Nurtured World, 2011).

  Another behavioral change could involve use of CFLs instead of traditional
  incandescent bulbs. Entergy will provide 20 free CFLs per household. These
  20 bulbs can reduce electric bills by $90 and mitigate 900 pounds of carbon
  equivalents per year per household.

  Mitigation can also be achieved by eliminating or reducing the use of some
  household appliances. The carbon calculator developed for the L9W was used
  to evaluate how much energy a household could save by eliminating certain
  appliances. Eliminating window air conditioners (but still using ceiling fans to
  keep a house cool) could save a household almost $150 on electric bills and
  mitigate almost 1,500 pounds of carbon equivalents per year. Drying clothes
  naturally rather than with a dryer could save a household $130 on electric bills
  and 1,300 pounds of carbon equivalents a year. Washing dishes by hand instead
  of using a dishwasher could mitigate almost 650 pounds of carbon equivalents
  per year and reduce electric bills by around $65 each year per household. Such
  measures can reduce a household’s electricity usage by 6 percent and mitigate
  4,300 pounds of carbon equivalents per household annually.

  However, not all households will readily adopt such changes, which could
  involve considerable inconvenience. Other options that can help to reduce
  household carbon footprints include replacing appliances that are not Energy
  Star© rated (most likely, any appliances that date from pre-Katrina) with high-
  efficiency appliances. This would save on energy bills as well as reduce carbon
  emissions. Although there are initial costs of purchasing a new appliance, the
  Louisiana State Rebate Program will provide $75 for a room air conditioner,
  $100 for a clothes washer, and $150 for a dishwasher, as well as for other ap-
  pliances (Database of State Incentives for Renewables and Efficiency, 2011).
  Most of these high-efficiency appliances reduce electricity use by 10 to 30 per-
  cent and can mitigate 500 pounds of carbon equivalents annually, based on
  a comparison of the most efficient Energy Star© appliance to what Energy
  Star© assumes as a normal, non-energy efficient appliance. However, it appears
  unlikely that there are many pre-Katrina appliances in the L9W, so most are
  probably already Energy Star rated. It was assumed that behavioral measures
  would be employed to mitigate approximately 14,000 tons per year in the
  L9W, at no cost.


16 									                                                                         Carbon Study Final Report 2012
Development of New Buildings and Neighborhoods
                               According to Sustainability Guidelines

                               Development of new buildings, including houses, schools, businesses, and
                               neighborhoods according to sustainability guidelines could involve Leader-
                               ship in Energy and Environmental Design (LEED™) standards developed by
                               the U.S. Green Building Council (USGBC) or more general green building
                               practices. These involve use of natural circulation and lighting; energy-efficient
                               building envelope and mechanical and electrical systems; and selection of ma-
                               terials on a life-cycle, rather than initial, cost basis. Sustainable design of new
                               residences was assumed to include solar panels and hot water heaters; high-ef-
                               ficiency mechanical and electrical systems; and energy saving doors, windows,
                               and insulation.

                               Neighborhood development consistent with sustainability guidelines would
                               involve clustering houses in areas of higher density, while using open spaces for
                               parks, urban agriculture, wetlands, woodlands, or other purposes; walkways,
                               use of bicycles, and public transportation would be enhanced. Commercial
                               and institutional activities would be integrated with residential clusters and
                               could incorporate the concepts of “new urbanism”, with mixed use patterns,
                               street front access to stores, use of second floors for professional and commer-
                               cial services, etc.

                               Currently, at least 80 houses in the L9W have been constructed according to
                               LEED™ criteria, including those developed by Make it Right and Global Green.
                               Make it Right has constructed 75 houses that have been certified as LEED™
                               Platinum or are awaiting certification, and is planning 75 more. Global Green
                               has constructed five LEED™ Platinum houses. In addition, Global Green’s de-
                               velopment is a pilot project for LEED™ for Neighborhood Development.

                               All analyses of housing costs and carbon savings were based on a typical shot-
                               gun cottage of approximately 1,100 square feet. Such cottages are common
                               throughout the L9W and representative of New Orleans architecture. They are
                               inherently sustainable in terms of high windows and ceilings, natural ventila-
                               tion, shutters, elevated first floors, and appropriate materials. Shotgun cottages,
                               with front porches and narrow lots that facilitate interaction among neighbors,
                               also contribute to neighborhood sustainability.

                               To analyze the costs and mitigation capabilities of constructing new housing
                               in the L9W according to green design criteria, a model was developed using
                               Autodesk© Revit Architecture 2012, depicting a typical shotgun cottage. The
                               1,100 square foot model cottage consisted of three bedrooms, a bathroom, liv-
                               ing/dining area, and kitchen. Floors, ceilings, roofs, windows, and walls were
                               modeled.

                               The Revit file was then exported to Autodesk© Green Building Studio for en-
                               ergy analyses. This program uses weather, energy prices, and other parameters
                               specific to Louisiana. Design alternatives including HVAC systems, lighting

Carbon Study Final Report 2012		                                                                                     17
systems, insulation, window treatments, and roofing types were varied using
  Green Building Studio to analyze the impacts on energy use and carbon emis-
  sions.

  While green design and construction practices can reduce energy use (and,
  therefore, costs), the perceived additional cost of “going green” is sometimes
  a barrier. However, considerable research has shown that construction accord-
  ing to LEED™ criteria is, on average, only one to two percent more expensive
  than normal construction, if it adds any cost at all (Cassidy, 2007). Based on
  an estimated construction cost for a typical shotgun cottage of approximately
  $150,000, green design and construction practices would increase costs by ap-
  proximately $3,000.

  In the L9W, building a sustainable house costs anywhere from $80/sq.ft. to
  $140/sq.ft, based on conversations held with representatives of Common
  Ground Relief and Global Green. However, in order to be conservative, it was
  assumed in this analysis that achieving maximum carbon mitigation through
  green design and construction would add approximately 10 percent to the cost
  of the model cottage ($15,000), for a final square footage cost of $150.

  Recognizing that a 10 percent premium for green design and construction is
  significantly higher than estimates of a LEED™ premium of 0-2 percent widely
  reported in literature, it was noted that most studies have been based on large
  commercial, institutional, and industrial buildings. Costs to achieve LEED™
  standards might represent a higher percentage of base costs for the cottages be-
  cause some of the design and much of the construction management for hous-
  ing construction in the L9W will probably be done by homeowners or small
  contractors who might not be familiar with green construction practices. Since
  homeowners would likely be one-time purchasers of green building services,
  there would be limited opportunities for learning curves to reduce costs. These
  and other factors were considered in deciding to use a 10 percent premium.

  The green building premium was annualized over the projected 30 year life of
  a shotgun cottage, at an interest rate of 6 percent. Estimated annual costs are
  approximately $1,100.

  There have been numerous estimates of carbon mitigation resulting from con-
  struction of new housing according to green criteria. In this analysis, it was
  assumed that construction of new housing according to green design criteria
  would reduce annual household emissions by 45 percent (Energy Star, 2010).
  Based on estimated emissions of 45,000 pounds of carbon equivalents per year
  per household in the L9W, it was estimated that design and construction of
  new housing according to sustainability guidelines would reduce emissions by
  20,250 pounds per year per household. It was assumed that all new housing in
  the L9W could be built according to sustainability guidelines.

  Not only is carbon emitted during daily activities of a residence, but materi-
  als used in construction convey “embodied carbon”, representing the carbon
  needed to extract and process raw materials; equipment required to manufac-
  ture products; and transportation of the finished products to end users (EPA,

18 									                                                                         Carbon Study Final Report 2012
2010). As mentioned previously, these are considered Scope 3 emissions, which
                               are generally beyond the scope of this analysis.

                               However, the Scope 3 carbon savings from building houses according to sus-
                               tainability guidelines are so significant as to warrant mention. Based on the
                               model shotgun cottage, a cottage built using non-sustainable materials would
                               generate 73.3 tons of embodied carbon, while a cottage built using green ma-
                               terials and practices would generate 43.8 tons, about a 40 percent decrease.
                               Material differences between a cottage designed and constructed according to
                               green criteria and a typical cottage include gypsum board from EcoRock, wood
                               flooring (instead of carpeting) in the bedrooms and living room, wood doors
                               (instead of aluminum), cellulose insulation, and concrete mixed with 25 per-
                               cent fly ash. While it would be inconsistent to use mitigation of Scope 3 emis-
                               sions to offset Scope 1 and 2 emissions, reducing embedded carbon is a benefit
                               of construction of new housing according to green criteria.

                               Development of neighborhoods according to sustainability guidelines would
                               be reflected in higher densities in areas of higher elevation and improved public
                               transportation. Such assumptions are reflected in the repopulation alternative.


                               Solar Photovoltaic Panels

                               Numerous L9W houses have solar photovoltaic panels, which produce electric-
                               ity that can be consumed or sold back to the electrical provider as part of “net
                               metering”. Some panels were purchased by homeowners and some were pro-
                               vided by donors or volunteers. Ten panels were provided to L9W homeowners
                               by Sharp Electronics, and Global Green has installed panels on the homes they
                               have constructed. Typical home systems in the L9W have a capacity of about
                               three kilowatts (kW) and an expected life of about 20 years.

                               Solar photovoltaic panels are one of the most popular forms of renewable en-
                               ergy. Solar panels are non-polluting and do not emit any GHGs (Solar Home,
                               2010). Based on Louisiana’s location, approximately three kilowatt hours
                               (kWh) per square meter per day of electricity could be generated from solar
                               energy (Johnson, 2009). Assuming four hours of peak sunlight per day, a three
                               kW system can produce 4,380 kWh per year, saving approximately 2.2 tons
                               of carbon. It was assumed in this analysis that all existing and new housing in
                               the L9W could have solar photovoltaic panels installed, which could save the
                               community 17,000 tons of carbon annually.

                               Recently, photovoltaic systems have cost approximately $6,000 per kW in-
                               stalled (Mike Murphy, 2012), although this cost has been declining signifi-
                               cantly in recent years, to as little as $3,000 per kW. To be conservative, historic
                               costs were used in this analysis. A typical three kW system, therefore, was esti-
                               mated to cost about $18,000 installed. Annualized over an expected life of 20
                               years at an interest rate of 6 percent per year (to be consistent with the Green
                               Building Studio), the cost is about $1,500 per year per system. Accounting for
                               energy savings of 4,380 kilowatt-hours would save the owner about $440 per
                               year, for a net annual cost of about $1,070 per year per household. Incorporat-
Carbon Study Final Report 2012		                                                                                     19
ing the Louisiana state tax credit of 50 percent and the Federal tax credit of 30
  percent on solar energy investments, there is no longer an annual cost for solar
  photovoltaic cells, but rather an annual gain of about $60. A solar energy sys-
  tem is exempt from increasing a homeowner’s Louisiana state property taxes. It
  was assumed that all new homes would be built with solar PV panels and that
  all existing homes could install solar PV panels as well.

  Solar Hot Water Heaters

  The sun has been used to heat water for centuries. Solar hot water heaters are
  very effective in warmer climates like Louisiana’s. A solar water heater can be
  hurricane-resistant and provide 80 to 90 percent of annual water heating needs
  (Solar Direct, 2010). There are two types of solar hot water heaters that have
  been used in New Orleans, one of which is no longer permitted (Mike Mur-
  phy, 2012). The system that is no longer allowed, which is cheaper at an initial
  cost of about $6,700, is a direct system, with a schematic, shown in Figure 5.
  The second system, the one used in our analysis and seen in Figure 6, costs
  about $9,500 but can save about 2,800 kWh of electricity, for an annual sav-
  ings of about $280, and reduce emissions by about two tons of carbon equiva-
  lents per year. Over a 10 year lifespan, the annual cost is about $1,350, which
  is comparable to solar PV panels. There is a rebate of either $750 or $1000 for
  solar hot water heaters, depending on the size of the system, from Entergy New
  Orleans. Combining this rebate with the 50 percent Louisiana state tax credit
  and 30 percent Federal tax credit means a homeowner could actually be gain-
  ing about $100 annually. It was assumed in this analysis that all new homes
  could be built with solar hot water heaters and that up to 25 percent of existing
  homes might upgrade their current system.


                                   Figure 2.
                Solar Hot Water Heaters
    Direct Solar Hot Water                      Indirect Solar Hot Water


20 									                                                                          Carbon Study Final Report 2012
Improved Mechanical and Electrical Systems

                               Many opportunities exist to encourage consumers to purchase energy-efficient
                               mechanical and electrical systems. Improvements to heating, ventilating, and
                               air conditioning (HVAC) and lighting systems in L9W homes were analyzed
                               in terms of mitigation capability and cost. It was assumed that improved me-
                               chanical and electrical systems could be installed in all existing homes in the
                               L9W; new homes designed and constructed according to sustainability guide-
                               lines would include such systems.

                               Improved HVAC Systems

                               Based on an analysis using Green Building Studio to model energy savings from
                               improved HVAC systems, choosing or upgrading from a low-rated system (14
                               SEER rating) to a more highly-rated system (17 SEER rating) can save 4.45
                               tons of carbon equivalents annually per household. Energy Star© is currently
                               issuing a $300 tax credit on all HVAC systems that meet such requirements.
                               Additionally, the Louisiana Department of Natural Resources offers a Home
                               Energy Rebate Option (HERO) for both existing and new homes, through
                               which each existing home can receive a rebate of $0.20 per kWh saved, with
                               a $3,000 maximum incentive, while new homes can receive $3,000 for re-
                               ducing the entire home’s energy costs by 50 percent through HVAC or other
                               improvements (Database of State Incentives for Renewables and Efficiency,
                               2011). Though initial costs of highly efficient HVAC systems can be $6,000
                               or more, choosing an efficient system with a high SEER rating can save $560
                               a year on energy bills. Through energy savings and tax and other incentives, a
                               homeowner can save about $26 annually.

                               Improved Lighting Systems

                               Designing a home’s lighting system to efficiently use lighting power density
                               (LPD) is a cost-free way to save energy. The LPD is an evaluation of the watt-
                               age used per area of room lighted. If light fixtures are logically placed through-
                               out a home to reduce lighting intensity by just 20 percent, a home could save
                               $35 dollars in energy bills and 400 pounds of carbon equivalents annually. An
                               easy and convenient way to reduce energy usage and costs is to include occu-
                               pancy and daylight sensors in the home. Occupancy sensors can turn lights on
                               or off whenever someone enters or leaves a room. This takes the guesswork out
                               of switching lights on or off. Daylight sensors can dim or turn off light fixtures
                               when there is sufficient daylight available to brighten a room. Such a system
                               costs almost $1,400. However, through HERO, existing homes can receive
                               $0.20 per kWh saved with various improvements (lighting included), and new
                               homes can receive $2,000 for achieving a HERS (Home Energy Ratings Sys-
                               tem) rating of 70 or better (Database of State Incentives for Renewables and
                               Efficiency, 2011). Analyses performed using the Green Building Studio showed
                               that installing sensors and reducing LPD can save a household over $100 on
                               energy bills and reduce its carbon footprint by 1,600 pounds annually.


Carbon Study Final Report 2012		                                                                                    21
Improved Insulation, Doors, and Windows

  Poor insulation and openings in the building envelope release warm air in the
  winter, increasing heating costs, and have the reverse effect in the summer,
  increasing cooling costs. Not only does increased HVAC usage for heating and
  cooling increase costs, but also uses more energy and, therefore, generates more
  carbon. The Green Building Studio was used to analyze the carbon savings of
  improved insulation, doors, and windows in existing L9W houses.

  New Orleans lies in Climate Zone 2. Each climate zone has specific ener-
  gy code requirements to qualify for tax credits (U.S. Department of Energy,
  2009). The Green Building Studio was used to analyze energy efficiency if
  houses improved on code requirements. Increasing insulation, such as under
  the CSED program to install thermal barriers in homes, would mitigate almost
  800 pounds of carbon equivalents and reduce energy costs nearly $200 annu-
  ally per household. Choosing code-minimum values or better, as well as install-
  ing Energy Star© or Therma Star© doors and windows, can help maintain a
  comfortable home environment as well as reduce the L9W carbon footprint. It
  was assumed that improved insulation, doors, and windows could be installed
  in all existing homes in the L9W; new homes designed and constructed accord-
  ing to sustainability guidelines would include such features.


  Green Spaces

  Another mitigation method that could contribute to meeting L9W sustainabil-
  ity goals is carbon sequestration, defined as “the removal and storage of carbon
  from the atmosphere in carbon sinks (such as oceans, forests, or soils) through
  physical or biological processes, such as photosynthesis” (GreenFacts, 2010).
  By constructing parks or playgrounds, developing urban agriculture, or allow-
  ing woodlands or wetlands to develop, carbon can be actively removed from
  the atmosphere, decreasing the L9W’s carbon emissions. Trees sequester 1.27
  tons of carbon per acre, green spaces sequester 0.5 tons per acre, and wetlands
  sequester 11 tons per acre (Gebhard, Gleaston et al. and Wills et al., 1994).

  Much of the L9W, particularly in the northern portion, remains vacant. Use
  of such spaces for parks, playgrounds, urban agriculture, or woodlands or wet-
  lands would eliminate carbon emissions that would result from development
  of those areas as well as through sequestration.

  For the repopulation base case, approximately 60 acres would be available for
  green spaces in the L9W, making the total carbon sequestration potential ap-
  proximately 60 tons annually, based on an average of one ton per acre. For the
  repopulation alternative, an additional 100 acres north of Galvez could be used
  for carbon sequestration through green spaces, for a total carbon sequestration
  potential of approximately 160 tons of carbon per year, based on an average of
  one ton per acre.

  Development and maintenance of green spaces can involve little or no initial
  and annual costs. The life of sequestration agents such as trees, bushes, and
22 									                                                                         Carbon Study Final Report 2012
other vegetation is as much as 50 years.

                               Bayou Bienvenue long served as a neighborhood wetland. If it is restored as
                               planned, it could serve as a sequestration agent. However, it is unlikely that
                               Bayou Bienvenue will be restored before 2020; in addition, active wetlands
                               are also emitters of GHGs, so it is not clear to what extent a renewed Bayou
                               Bienvenue would mitigate L9W GHG emissions.

                               Use of open spaces for parks, playgrounds, and other community functions
                               also contributes to neighborhood sustainability. There is a long and active tra-
                               dition in the L9W of backyard and neighborhood gardens. There are currently
                               several community gardens in the L9W, and several local organizations are
                               committed to supporting urban agriculture.

                               Carbon sequestration through development and maintenance of green spaces
                               appears to be a beneficial way to reduce carbon emissions for L9W at minimal
                               cost, although the mitigation impact is relatively insignificant. It should be
                               noted, however, that the savings from future emissions not generated (as well
                               as in terms of “embodied carbon”) as a result of not building greatly outweigh
                               the carbon savings from sequestration by green spaces.

                               De-construction

                               De-construction of buildings that cannot be renovated, and re-use of de-con-
                               structed materials, has been ongoing in the L9W. The Green Project, located
                               just outside the L9W, recycles salvaged building materials.

                               Numerous structures in the L9W could be de-constructed. The EPA estimates
                               that 70 percent of all materials from a building can be salvaged and recycled.
                               On average, deconstruction with maximum salvaged and recycled materials
                               costs about $4.50 to $5.40 per square foot, compared to $3.00 to $5.00 per
                               square foot for demolition. By de-constructing houses and recycling the ma-
                               terials, an estimated 1.7 tons of carbon can be saved per house. However, it
                               should be noted that this represents a reduction in Scope 3 emissions, as dis-
                               cussed previously, and could not be used to offset Scope 1 or 2 emissions (EPA,
                               2011).


                               Mitigating Institutional Emissions
                               Institutions such as schools and churches can be large carbon emitters. Schools
                               are high energy users so inherently emit a large amount of GHGs; because of
                               this, building energy-efficient schools has become a priority throughout the
                               country. The U.S. Green Building Council has LEED™ criteria for schools, and
                               there are numerous examples of energy-efficient schools and churches. Within
                               the L9W, schools will become more important as the population increases and
                               a younger population develops. As schools are built and repopulated, it will be
                               important to build energy-efficient schools. A typical school in the U.S. costs
                               about $150 per square foot. Building a green school adds about a $5 per square
                               foot premium onto these costs (Kats, 2006).

Carbon Study Final Report 2012		                                                                                  23
Energy efficient systems that are incorporated into school construction or ren-
  ovation can save the equivalent of $7 per square foot over a period of 15 years.
  This energy savings will make up for up for the “green” premium that is paid
  on the initial costs.

  Churches can also save on energy costs while reducing their carbon emissions
  for little or no cost. Energy Star© has created a program designed to give
  congregations tools and advice to help them lower their energy costs and also
  cut their carbon emissions. Energy Star© states that their energy conserva-
  tion advice can help churches reduce up to 30 percent of their energy costs
  (Energy Star for Congregations, 2011). Lighting is one of the greatest con-
  sumers of electricity in a church. Conservation measures include using energy
  efficient lighting and lighting controls, which is a relatively inexpensive way of
  decreasing energy costs. Depending on the congregation’s finances, such proj-
  ects could be worthwhile.

  Churches, schools, and other institutions could also implement mitigation
  measures such as solar hot water heaters and solar photovoltaic panels. How-
  ever, incentives and rebates that reduce the costs of such systems for homeown-
  ers may not be available to institutions.

  To some extent, the current lack of institutions in the L9W is an advantage;
  new institutional facilities can be planned and designed to be sustainable. Esti-
  mates of mitigation from institutional sources were based on the levels and mix
  of institutional activity shown in Table 3.

  Since the savings for churches, schools, and non-profit organizations are not in
  the form of up-front payments, such organizations need to find methods of fi-
  nancing energy-efficient projects to take advantage of tax and other incentives.
  These could come in the form of lease-purchase options or power purchase
  agreements.


  Mitigating Commercial Emissions
  While some carbon mitigation measures can be applied both to commercial
  and residential properties, businesses have specific tax incentives that apply to
  their projects. Within New Orleans, Entergy offers a rebate program that pro-
  vides up to $0.14 per kWh in rebates for businesses. Small businesses, which
  are defined as having an average peak demand less than 100 kW, are given
  $0.14 per kWh for implementing energy-efficient technologies for lighting
  and HVAC systems, doors, windows, insulation, and any other technology
  that results in measurable electricity use reduction. Businesses that have a peak
  demand greater than 100 kW are also eligible to receive $0.10 per kWh saved
  on lighting improvements and $0.12 per kWh saved on all other improve-
  ments.

  There is also a Federal tax deduction from which businesses can receive be-

24 									                                                                           Carbon Study Final Report 2012
tween $0.30 and $1.80 per square foot for energy-efficient investments. The
                               amount of the deduction depends on whether the building reaches certain
                               benchmarks for energy savings as defined by the Federal Energy Policy Act. The
                               deduction includes eligible technologies such as lighting and HVAC systems,
                               doors, windows, insulation, siding, and roofs. There are also Federal tax credits
                               of 30 percent on solar technology similar to the credits for residential proper-
                               ties (Database of State Incentives for Renewables and Efficiency, 2011).

                               Estimating mitigation from commercial sources is highly dependent on the
                               forecast of future commercial activity in the L9W. Estimates used in this analy-
                               sis were based on the levels and mix of commercial activity shown in Table 3.


                               Conclusions
                               Not surprisingly, it does not appear feasible for the L9W to repopulate to pre-
                               Katrina levels and develop economically without increasing its carbon foot-
                               print. However, it does appear feasible to repopulate and develop while meet-
                               ing the Obama administration goal of reducing carbon emissions to 17 percent
                               below 2005 levels. To do so could involve costs to L9W residents ranging from
                               nothing to over $5 million per year, depending on repopulation and develop-
                               ment policies and the mitigation measures employed.

                               It appears possible to meet the Obama administration goal with residential mit-
                               igation measures under the economic development base case, which assumes
                               that incomes and economic activity in the L9W return to pre-Katrina levels.
                               As shown in Table 6, no mitigation would be required under the economic
                               development base case/repopulation alternative scenario, which assumes that
                               incomes and economic activity return to pre-Katrina levels but that repopu-
                               lation is clustered in areas of higher elevation; a combination of behavioral
                               changes and solar measures could easily meet the mitigation required under
                               the economic development base case/repopulation base case scenario, which
                               assumes that incomes, economic activity, and population distributions return
                               to pre-Katrina levels.

                               Economic development, while highly desirable, increases mitigation require-
                               ments. If the incomes of L9W residents increase to the national average, the
                               challenges and costs of achieving the Obama administration goal increase sig-
                               nificantly.

                               It may be possible to achieve the Obama administration goal for the economic
                               development alternative/repopulation alternative scenario, which assumes that
                               incomes in the L9W increase to the national average and repopulation is clus-
                               tered in areas of higher elevation, if mitigation from commercial and insti-
                               tutional sources is included. Achieving the Obama goal under the economic
                               development alternative/repopulation base case scenario, which assumes that
                               incomes in the L9W increase to the national average and population distribu-
                               tions return to pre-Katrina levels, would require extraordinary efforts.

Carbon Study Final Report 2012		                                                                                   25
As detailed in Table 7, the most cost-effective carbon mitigation measures in-
  volve behavioral changes. Awareness of energy use can lead to reductions in
  usage. Use of CFLs and reduced use or elimination of window air condition-
  ers, clothes dryers, and dishwashers can reduce carbon emissions while saving
  money. Unfortunately, behavioral changes have limited mitigation capacity.
  De-construction and development of green spaces have minimal costs but lim-
  ited mitigation capacity. However, behavioral changes and use of open spaces
  for parks, playgrounds, and other community functions can also contribute to
  neighborhood sustainability and community engagement.

  Solar hot water heaters are cost-effective, saving almost $100 per year, and are
  therefore highly desirable for a homeowner. In addition, installation of solar
  hot water heaters has significant mitigation capacity, making this among the
  most desirable mitigation measures. Likewise, solar photovoltaic panels save
  almost $60 annually and have a large mitigation capacity. It should be noted,
  as mentioned previously, that the prices of solar photovoltaic panels have been
  dropping significantly over the past few years, but conservative estimates based
  on historic prices were used in this analysis; if prices continue to drop, solar
  photovoltaic panels will become increasingly cost-effective. Improved HVAC
  systems will save homeowners about $26 annually, but homeowners could save
  even more by using the highest rated machines available. HVAC systems also
  have considerable mitigation capacity, which makes them desirables upgrades
  to choose.

  Energy-efficient doors and windows, lighting controls, and insulation do not
  save money, but cost less than $500 per household per year. Improved me-
  chanical systems have significant mitigation capacity at relatively minimal cost.

  Sustainable design and construction practices cost about $1,100 per house-
  hold per year. However, such measures have the greatest mitigation capacity.
  It should be noted that the premium used for sustainable construction in this
  analysis was intentionally very conservative, so it is unlikely that the cost would
  be greater than $1,100 per year.


26 									                                                                            Carbon Study Final Report 2012
Lower 9th Ward Carbon Model Report

More Related Content

Similar to Lower 9th Ward Carbon Model Report

C L I Mclimatesolutions W W Fmay2k7
C L I Mclimatesolutions W W Fmay2k7C L I Mclimatesolutions W W Fmay2k7
C L I Mclimatesolutions W W Fmay2k7Psdmn Phil
 
IRENA : World Energy Transitions Outlook 2023
IRENA : World Energy Transitions Outlook 2023IRENA : World Energy Transitions Outlook 2023
IRENA : World Energy Transitions Outlook 2023Energy for One World
 
Dissertation(Vikash Bhushan).docx
Dissertation(Vikash Bhushan).docxDissertation(Vikash Bhushan).docx
Dissertation(Vikash Bhushan).docxVikashBhushan5
 
Recipe - Report on Energy and Climate Policy in Europe
Recipe - Report on Energy and Climate Policy in EuropeRecipe - Report on Energy and Climate Policy in Europe
Recipe - Report on Energy and Climate Policy in EuropeOpen Knowledge
 
UNEP Handbook: Sustainable Consumption and Production for Poverty Alleviation
UNEP Handbook: Sustainable Consumption and Production for Poverty Alleviation UNEP Handbook: Sustainable Consumption and Production for Poverty Alleviation
UNEP Handbook: Sustainable Consumption and Production for Poverty Alleviation David Vicent
 
Integrating Climate into our Strategy
Integrating Climate into our StrategyIntegrating Climate into our Strategy
Integrating Climate into our StrategyTotal
 
Circular Economy Policy in Korea (Ick Jin)
Circular Economy Policy in Korea (Ick Jin)Circular Economy Policy in Korea (Ick Jin)
Circular Economy Policy in Korea (Ick Jin)Ick Jin
 
ConservAmerica 2014 Energy Policy
ConservAmerica 2014 Energy PolicyConservAmerica 2014 Energy Policy
ConservAmerica 2014 Energy Policyconservamericabf
 
Design and management of sustainable built environments
Design and management of sustainable built environmentsDesign and management of sustainable built environments
Design and management of sustainable built environmentsSpringer
 
Energy and the environment 2014
Energy and the environment 2014Energy and the environment 2014
Energy and the environment 2014Conservamerica1
 
2013 – 2014 Strategy and Sustainability Highlights Report
2013 – 2014 Strategy and Sustainability Highlights Report2013 – 2014 Strategy and Sustainability Highlights Report
2013 – 2014 Strategy and Sustainability Highlights ReportSchneider Electric
 
Post-COP21: Aligning US Business and Climate
Post-COP21: Aligning US Business and ClimatePost-COP21: Aligning US Business and Climate
Post-COP21: Aligning US Business and ClimateAlex Taser
 
Business guide on carbon emission redution and sustainability
Business guide on carbon emission redution and sustainabilityBusiness guide on carbon emission redution and sustainability
Business guide on carbon emission redution and sustainabilityBarney Loehnis
 
Vale of White Horse LCLIP Report Abridged_1
Vale of White Horse LCLIP Report Abridged_1Vale of White Horse LCLIP Report Abridged_1
Vale of White Horse LCLIP Report Abridged_1Torsten Kowal
 
Low and zero carbon new homes Greenwood and Congreve final
Low and zero carbon new homes Greenwood and Congreve finalLow and zero carbon new homes Greenwood and Congreve final
Low and zero carbon new homes Greenwood and Congreve finalAlinaCongreve
 
Exxon Mobil: Climate Change
Exxon Mobil: Climate ChangeExxon Mobil: Climate Change
Exxon Mobil: Climate ChangeMashable
 

Similar to Lower 9th Ward Carbon Model Report (20)

C L I Mclimatesolutions W W Fmay2k7
C L I Mclimatesolutions W W Fmay2k7C L I Mclimatesolutions W W Fmay2k7
C L I Mclimatesolutions W W Fmay2k7
 
IRENA : World Energy Transitions Outlook 2023
IRENA : World Energy Transitions Outlook 2023IRENA : World Energy Transitions Outlook 2023
IRENA : World Energy Transitions Outlook 2023
 
Dissertation(Vikash Bhushan).docx
Dissertation(Vikash Bhushan).docxDissertation(Vikash Bhushan).docx
Dissertation(Vikash Bhushan).docx
 
Recipe - Report on Energy and Climate Policy in Europe
Recipe - Report on Energy and Climate Policy in EuropeRecipe - Report on Energy and Climate Policy in Europe
Recipe - Report on Energy and Climate Policy in Europe
 
UNEP Handbook: Sustainable Consumption and Production for Poverty Alleviation
UNEP Handbook: Sustainable Consumption and Production for Poverty Alleviation UNEP Handbook: Sustainable Consumption and Production for Poverty Alleviation
UNEP Handbook: Sustainable Consumption and Production for Poverty Alleviation
 
Integrating Climate into our Strategy
Integrating Climate into our StrategyIntegrating Climate into our Strategy
Integrating Climate into our Strategy
 
Circular Economy Policy in Korea (Ick Jin)
Circular Economy Policy in Korea (Ick Jin)Circular Economy Policy in Korea (Ick Jin)
Circular Economy Policy in Korea (Ick Jin)
 
ConservAmerica 2014 Energy Policy
ConservAmerica 2014 Energy PolicyConservAmerica 2014 Energy Policy
ConservAmerica 2014 Energy Policy
 
Risoe Energy Report 7
Risoe Energy Report 7Risoe Energy Report 7
Risoe Energy Report 7
 
Design and management of sustainable built environments
Design and management of sustainable built environmentsDesign and management of sustainable built environments
Design and management of sustainable built environments
 
Energy and the environment 2014
Energy and the environment 2014Energy and the environment 2014
Energy and the environment 2014
 
Final Paper
Final PaperFinal Paper
Final Paper
 
2013 – 2014 Strategy and Sustainability Highlights Report
2013 – 2014 Strategy and Sustainability Highlights Report2013 – 2014 Strategy and Sustainability Highlights Report
2013 – 2014 Strategy and Sustainability Highlights Report
 
Post-COP21: Aligning US Business and Climate
Post-COP21: Aligning US Business and ClimatePost-COP21: Aligning US Business and Climate
Post-COP21: Aligning US Business and Climate
 
Document- "Climate Resolve"
Document- "Climate Resolve"Document- "Climate Resolve"
Document- "Climate Resolve"
 
Business guide on carbon emission redution and sustainability
Business guide on carbon emission redution and sustainabilityBusiness guide on carbon emission redution and sustainability
Business guide on carbon emission redution and sustainability
 
Vale of White Horse LCLIP Report Abridged_1
Vale of White Horse LCLIP Report Abridged_1Vale of White Horse LCLIP Report Abridged_1
Vale of White Horse LCLIP Report Abridged_1
 
Solar PV Road Map
Solar PV Road MapSolar PV Road Map
Solar PV Road Map
 
Low and zero carbon new homes Greenwood and Congreve final
Low and zero carbon new homes Greenwood and Congreve finalLow and zero carbon new homes Greenwood and Congreve final
Low and zero carbon new homes Greenwood and Congreve final
 
Exxon Mobil: Climate Change
Exxon Mobil: Climate ChangeExxon Mobil: Climate Change
Exxon Mobil: Climate Change
 

Recently uploaded

"I see eyes in my soup": How Delivery Hero implemented the safety system for ...
"I see eyes in my soup": How Delivery Hero implemented the safety system for ..."I see eyes in my soup": How Delivery Hero implemented the safety system for ...
"I see eyes in my soup": How Delivery Hero implemented the safety system for ...Zilliz
 
Platformless Horizons for Digital Adaptability
Platformless Horizons for Digital AdaptabilityPlatformless Horizons for Digital Adaptability
Platformless Horizons for Digital AdaptabilityWSO2
 
Polkadot JAM Slides - Token2049 - By Dr. Gavin Wood
Polkadot JAM Slides - Token2049 - By Dr. Gavin WoodPolkadot JAM Slides - Token2049 - By Dr. Gavin Wood
Polkadot JAM Slides - Token2049 - By Dr. Gavin WoodJuan lago vázquez
 
FWD Group - Insurer Innovation Award 2024
FWD Group - Insurer Innovation Award 2024FWD Group - Insurer Innovation Award 2024
FWD Group - Insurer Innovation Award 2024The Digital Insurer
 
Exploring Multimodal Embeddings with Milvus
Exploring Multimodal Embeddings with MilvusExploring Multimodal Embeddings with Milvus
Exploring Multimodal Embeddings with MilvusZilliz
 
Modular Monolith - a Practical Alternative to Microservices @ Devoxx UK 2024
Modular Monolith - a Practical Alternative to Microservices @ Devoxx UK 2024Modular Monolith - a Practical Alternative to Microservices @ Devoxx UK 2024
Modular Monolith - a Practical Alternative to Microservices @ Devoxx UK 2024Victor Rentea
 
How to Troubleshoot Apps for the Modern Connected Worker
How to Troubleshoot Apps for the Modern Connected WorkerHow to Troubleshoot Apps for the Modern Connected Worker
How to Troubleshoot Apps for the Modern Connected WorkerThousandEyes
 
MINDCTI Revenue Release Quarter One 2024
MINDCTI Revenue Release Quarter One 2024MINDCTI Revenue Release Quarter One 2024
MINDCTI Revenue Release Quarter One 2024MIND CTI
 
Vector Search -An Introduction in Oracle Database 23ai.pptx
Vector Search -An Introduction in Oracle Database 23ai.pptxVector Search -An Introduction in Oracle Database 23ai.pptx
Vector Search -An Introduction in Oracle Database 23ai.pptxRemote DBA Services
 
Six Myths about Ontologies: The Basics of Formal Ontology
Six Myths about Ontologies: The Basics of Formal OntologySix Myths about Ontologies: The Basics of Formal Ontology
Six Myths about Ontologies: The Basics of Formal Ontologyjohnbeverley2021
 
Cloud Frontiers: A Deep Dive into Serverless Spatial Data and FME
Cloud Frontiers:  A Deep Dive into Serverless Spatial Data and FMECloud Frontiers:  A Deep Dive into Serverless Spatial Data and FME
Cloud Frontiers: A Deep Dive into Serverless Spatial Data and FMESafe Software
 
Connector Corner: Accelerate revenue generation using UiPath API-centric busi...
Connector Corner: Accelerate revenue generation using UiPath API-centric busi...Connector Corner: Accelerate revenue generation using UiPath API-centric busi...
Connector Corner: Accelerate revenue generation using UiPath API-centric busi...DianaGray10
 
CNIC Information System with Pakdata Cf In Pakistan
CNIC Information System with Pakdata Cf In PakistanCNIC Information System with Pakdata Cf In Pakistan
CNIC Information System with Pakdata Cf In Pakistandanishmna97
 
DEV meet-up UiPath Document Understanding May 7 2024 Amsterdam
DEV meet-up UiPath Document Understanding May 7 2024 AmsterdamDEV meet-up UiPath Document Understanding May 7 2024 Amsterdam
DEV meet-up UiPath Document Understanding May 7 2024 AmsterdamUiPathCommunity
 
Artificial Intelligence Chap.5 : Uncertainty
Artificial Intelligence Chap.5 : UncertaintyArtificial Intelligence Chap.5 : Uncertainty
Artificial Intelligence Chap.5 : UncertaintyKhushali Kathiriya
 
ProductAnonymous-April2024-WinProductDiscovery-MelissaKlemke
ProductAnonymous-April2024-WinProductDiscovery-MelissaKlemkeProductAnonymous-April2024-WinProductDiscovery-MelissaKlemke
ProductAnonymous-April2024-WinProductDiscovery-MelissaKlemkeProduct Anonymous
 
Apidays New York 2024 - The value of a flexible API Management solution for O...
Apidays New York 2024 - The value of a flexible API Management solution for O...Apidays New York 2024 - The value of a flexible API Management solution for O...
Apidays New York 2024 - The value of a flexible API Management solution for O...apidays
 
Architecting Cloud Native Applications
Architecting Cloud Native ApplicationsArchitecting Cloud Native Applications
Architecting Cloud Native ApplicationsWSO2
 
Why Teams call analytics are critical to your entire business
Why Teams call analytics are critical to your entire businessWhy Teams call analytics are critical to your entire business
Why Teams call analytics are critical to your entire businesspanagenda
 
ICT role in 21st century education and its challenges
ICT role in 21st century education and its challengesICT role in 21st century education and its challenges
ICT role in 21st century education and its challengesrafiqahmad00786416
 

Recently uploaded (20)

"I see eyes in my soup": How Delivery Hero implemented the safety system for ...
"I see eyes in my soup": How Delivery Hero implemented the safety system for ..."I see eyes in my soup": How Delivery Hero implemented the safety system for ...
"I see eyes in my soup": How Delivery Hero implemented the safety system for ...
 
Platformless Horizons for Digital Adaptability
Platformless Horizons for Digital AdaptabilityPlatformless Horizons for Digital Adaptability
Platformless Horizons for Digital Adaptability
 
Polkadot JAM Slides - Token2049 - By Dr. Gavin Wood
Polkadot JAM Slides - Token2049 - By Dr. Gavin WoodPolkadot JAM Slides - Token2049 - By Dr. Gavin Wood
Polkadot JAM Slides - Token2049 - By Dr. Gavin Wood
 
FWD Group - Insurer Innovation Award 2024
FWD Group - Insurer Innovation Award 2024FWD Group - Insurer Innovation Award 2024
FWD Group - Insurer Innovation Award 2024
 
Exploring Multimodal Embeddings with Milvus
Exploring Multimodal Embeddings with MilvusExploring Multimodal Embeddings with Milvus
Exploring Multimodal Embeddings with Milvus
 
Modular Monolith - a Practical Alternative to Microservices @ Devoxx UK 2024
Modular Monolith - a Practical Alternative to Microservices @ Devoxx UK 2024Modular Monolith - a Practical Alternative to Microservices @ Devoxx UK 2024
Modular Monolith - a Practical Alternative to Microservices @ Devoxx UK 2024
 
How to Troubleshoot Apps for the Modern Connected Worker
How to Troubleshoot Apps for the Modern Connected WorkerHow to Troubleshoot Apps for the Modern Connected Worker
How to Troubleshoot Apps for the Modern Connected Worker
 
MINDCTI Revenue Release Quarter One 2024
MINDCTI Revenue Release Quarter One 2024MINDCTI Revenue Release Quarter One 2024
MINDCTI Revenue Release Quarter One 2024
 
Vector Search -An Introduction in Oracle Database 23ai.pptx
Vector Search -An Introduction in Oracle Database 23ai.pptxVector Search -An Introduction in Oracle Database 23ai.pptx
Vector Search -An Introduction in Oracle Database 23ai.pptx
 
Six Myths about Ontologies: The Basics of Formal Ontology
Six Myths about Ontologies: The Basics of Formal OntologySix Myths about Ontologies: The Basics of Formal Ontology
Six Myths about Ontologies: The Basics of Formal Ontology
 
Cloud Frontiers: A Deep Dive into Serverless Spatial Data and FME
Cloud Frontiers:  A Deep Dive into Serverless Spatial Data and FMECloud Frontiers:  A Deep Dive into Serverless Spatial Data and FME
Cloud Frontiers: A Deep Dive into Serverless Spatial Data and FME
 
Connector Corner: Accelerate revenue generation using UiPath API-centric busi...
Connector Corner: Accelerate revenue generation using UiPath API-centric busi...Connector Corner: Accelerate revenue generation using UiPath API-centric busi...
Connector Corner: Accelerate revenue generation using UiPath API-centric busi...
 
CNIC Information System with Pakdata Cf In Pakistan
CNIC Information System with Pakdata Cf In PakistanCNIC Information System with Pakdata Cf In Pakistan
CNIC Information System with Pakdata Cf In Pakistan
 
DEV meet-up UiPath Document Understanding May 7 2024 Amsterdam
DEV meet-up UiPath Document Understanding May 7 2024 AmsterdamDEV meet-up UiPath Document Understanding May 7 2024 Amsterdam
DEV meet-up UiPath Document Understanding May 7 2024 Amsterdam
 
Artificial Intelligence Chap.5 : Uncertainty
Artificial Intelligence Chap.5 : UncertaintyArtificial Intelligence Chap.5 : Uncertainty
Artificial Intelligence Chap.5 : Uncertainty
 
ProductAnonymous-April2024-WinProductDiscovery-MelissaKlemke
ProductAnonymous-April2024-WinProductDiscovery-MelissaKlemkeProductAnonymous-April2024-WinProductDiscovery-MelissaKlemke
ProductAnonymous-April2024-WinProductDiscovery-MelissaKlemke
 
Apidays New York 2024 - The value of a flexible API Management solution for O...
Apidays New York 2024 - The value of a flexible API Management solution for O...Apidays New York 2024 - The value of a flexible API Management solution for O...
Apidays New York 2024 - The value of a flexible API Management solution for O...
 
Architecting Cloud Native Applications
Architecting Cloud Native ApplicationsArchitecting Cloud Native Applications
Architecting Cloud Native Applications
 
Why Teams call analytics are critical to your entire business
Why Teams call analytics are critical to your entire businessWhy Teams call analytics are critical to your entire business
Why Teams call analytics are critical to your entire business
 
ICT role in 21st century education and its challenges
ICT role in 21st century education and its challengesICT role in 21st century education and its challenges
ICT role in 21st century education and its challenges
 

Lower 9th Ward Carbon Model Report

  • 1. Lw r oe Nnh C ro Su y i l e ot 0 2 it ab n td F aR p r2 1 n Wad r
  • 2. EEGLP G P R O JEC T E CO N O M I C E N IN MP AR W E O ER L MEN T A ND GLO BAL
  • 3. Table of Contents Executive Summary.........................................................................................................................i Introduction..................................................................................................................................... 1 Background...................................................................................................................................... 2 Carbon Modeling........................................................................................................................... 4 Current Carbon Footprint............................................................................................................ 6 Repopulation & Development Scenarios.............................................................................. 8 Repopulation Base Case.............................................................................................................. 8 Repopulation Alternative............................................................................................................ 9 Economic Development Base Case.......................................................................................10 Economic Development Alternative.....................................................................................11 Targets..............................................................................................................................................11 Potential Mitigation Measures.................................................................................................12 Mitigating Residential Emissions............................................................................................15 Behavioral Measures..................................................................................................................16 Development of New Buildings and Neighborhoods According to Sustainability Guidelines ...............................................................................17 Solar Photovoltaic Panels..........................................................................................................19 Solar Hot Water Heaters.............................................................................................................20 Improved Mechanical and Electrical Systems....................................................................21 Improved HVAC Systems...........................................................................................................21 Improved Lighting Systems......................................................................................................21 Improved Insulation, Doors, and Windows.........................................................................22 Green Spaces.................................................................................................................................22 De-construction............................................................................................................................23 Mitigating Institutional Emissions.........................................................................................23 Mitigating Commercial Emissions..........................................................................................24 Conclusions....................................................................................................................................25 References.......................................................................................................................................31 Acknowledgments.......................................................................................................................35
  • 4. Table of Tables Table 1. Estimated Current Commercial and Institutional Sources of Emissions.... 7 Table 2. Repopulation Scenarios............................................................................................... 9 Table 3. Assumed Commercial and Institutional Activity..............................................10 Table 4. Estimated Future Carbon Footprints....................................................................11 Table 5. Estimated Mitigation Required to Achieve L9W Goal.....................................12 Table 6. Estimated Mitigation Required to Achieve Obama Administration Goal...................................................................................12 Table 7. Residential Mitigation Measures and Net Costs Per Ton of Carbon Saved...............................................................................13 Table 8. Residential, Commercial, and Institutional Mitigation Costs to Achieve Administration Goal............................................................14 Table of Figures Figure 1. Map................................................................................................................................... ii Figure 2. Solar Hot Water Heaters...........................................................................................20 Figure 3. Carbon Mitigation Measures: Costs.....................................................................27 Figure 4. Carbon Mitigation Measures: Costs After Energy Savings..........................28 Figure 5. Carbon Mitigation Measures: Costs After Energy & Tax Savings...............29 Figure 6. Carbon Mitigation Measures: Household Costs..............................................30
  • 5. Executive Summary New Orleans’ Lower 9th Ward (L9W) was devastated in 2005 by Hurricane Katrina and the subsequent flooding that resulted from the failure of the In- dustrial Canal levee. The community has been slow to recover. As of 2010, the L9W had about one-quarter of its pre-Katrina population levels, compared with more than three-quarters for all of New Orleans. The L9W has commit- ted to recovering from Hurricane Katrina in a sustainable manner. The Lower 9th Ward Center for Sustainable Engagement and Development (CSED) has expressed a goal of creating a prosperous, sustainable community that is carbon neutral by 2020 and climate neutral by 2030. Lafayette College’s Economic Empowerment and Global Learning Project (EEGLP) has been working with CSED since 2007 to investigate sustainable development policies and practices. In July 2009, EEGLP faculty and students began working with CSED on a study of the carbon impacts of L9W repopula- tion and economic development alternatives and the most cost-effective means of mitigating such impacts. This report presents the findings of that study. The study estimated the current carbon footprint of the L9W and forecasted future footprints under alternative repopulation and development scenarios. All scenarios assumed a return to pre-Katrina population levels in the L9W, but varied in terms of population distributions and economic development. Mitigation necessary to meet targets defined by CSED and the Obama admin- istration was investigated, and mitigation costs were estimated. Potential miti- gation measures included behavioral changes as well as development of new homes and neighborhoods according to sustainability guidelines; installation of solar photovoltaic panels; installation of solar hot water heaters; installation of insulation and new doors and windows in existing buildings; installation of high-efficiency mechanical and electrical systems in existing buildings; and development of open spaces, among others. While it does not appear feasible for the L9W to repopulate to pre-Katrina levels and develop economically without increasing its carbon footprint, it does appear feasible to repopulate while meeting the Obama administration goal of reducing carbon emissions to 17 percent below 2005 levels. To do so could involve costs ranging up to $5 million per year, depending on repopulation and development policies and the mitigation measures employed. Economic development, while highly desirable, would significantly increase the challenge of meeting the Obama administration goal. The most cost-effective mitigation measures involve behavioral changes. Aware- ness of energy use can lead to reductions in usage. Use of compact fluorescent light bulbs (CFLs) and reduced use or elimination of window air condition- ers, clothes dryers, and dishwashers can reduce carbon emissions while saving money. Unfortunately, behavioral changes have limited mitigation capacity. Carbon Study Final Report 2012 i
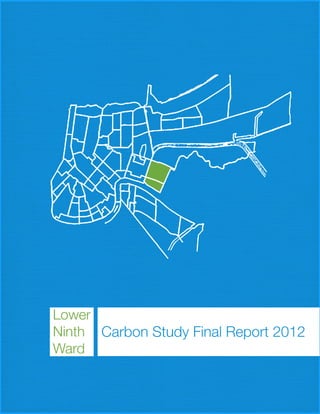
  • 6. Development of green spaces also has minimal costs but limited mitigation capacity. However, behavioral changes and green spaces contribute to commu- nity sustainability in a broader sense, so are highly desirable. Solar hot water heaters are also cost-effective, saving a homeowner almost $200 per year. In addition, installation of solar hot water heaters has significant miti- gation capacity, making this among the most desirable mitigation measures. Solar panels and improved mechanical and HVAC systems will also save a homeowner, solar panels more so than HVAC systems, but neither as much as solar hot water heaters. Sustainable design and construction practices are estimated to cost no more than $1,100 per household per year over a 30 year lifetime. Such practices have the greatest mitigation capacity among the potential measures that were investigated, so opportunities to reduce net costs through subsidies or incen- tives should be investigated. Figure 1. Lower Ninth Ward Map Bayou nal Beinvenue l Ca stria Galv ez S t Indu Lake Pontchartrain Claib Lower Ninth orne Ave Ward St. C Hollaude A ve Holy Cross Mississippi River New Orleans ii Carbon Study Final Report 2012
  • 7. Introduction New Orleans’ Lower 9th Ward (L9W) was devastated in 2005 by Hurricane Katrina and the subsequent flooding that resulted from the failure of the In- dustrial Canal levee. The community has been slow to recover. As of 2010, the L9W had about one-quarter of its pre-Katrina population levels, compared with more than three-quarters for all of New Orleans (U.S. Census Bureau, 2011). The Holy Cross neighborhood has experienced more rapid repopula- tion than the rest of the L9W, with almost half of pre-Katrina population levels, compared to less than one-quarter for the rest of the L9W (U.S. Census Bureau, 2011; Greater New Orleans Community Data Center, 2010). Areas of the L9W remain largely vacant, with governmental and community institu- tions and commercial establishments slow to return. The L9W has committed to recovering from Hurricane Katrina in a sustain- able manner. A series of public meetings in 2006 led to preparation of a “Sus- tainable Restoration Plan of Holy Cross/Lower 9th Ward”. In 2007, the Holy Cross Neighborhood Association established the Lower 9th Ward Center for Sustainable Engagement and Development (CSED), with the objective of en- couraging sustainable economic development and stimulating civic engage- ment. Specifically, CSED has expressed a goal of creating a prosperous, sustain- able community that is carbon neutral by 2020 and climate neutral by 2030 (City of New Orleans Carbon Footprint Report, 2009). Numerous groups, including civic, educational and religious institutions, Global Green, The Si- erra Club, Common Ground, and Make it Right, have assisted CSED and the L9W community in working to achieve this goal. Carbon Study Final Report 2012 1
  • 8. Lafayette College’s Economic Empowerment and Global Learning Project (EEGLP) has been working with CSED since 2007 to investigate sustainable development policies and practices. Previous projects have included develop- ment of a conceptual plan for a “green” lifestyle center at the intersection of St. Claude and Caffin Avenues; a study of the feasibility of converting the former McDonogh 19/Louis Armstrong school on St. Claude Avenue into an arts, culture and civic engagement center; and support for community gardens and urban agriculture throughout the L9W. In July 2009, EEGLP faculty and students began working with CSED on a study of the carbon impacts of L9W repopulation and economic development alternatives and the most cost-effective means of mitigating such impacts. In January 2010, at a meeting at the Center for Bioenvironmental Research at Tulane and Xavier Universities (CBR), EEGLP faculty and students present- ed their progress in modeling the L9W’s carbon footprint. In January 2011, EEGLP faculty and students presented another progress report at CBR, fore- casting the L9W’s carbon footprint under alternative repopulation and eco- nomic development scenarios; determining the mitigation necessary to achieve the L9W’s goal of carbon-neutrality under each scenario; and estimating the costs of potential mitigation measures. In August 2011, EEGLP faculty and students presented another progress report to CSED, estimating the net costs of mitigation to achieve the community’s goals, considering savings from en- ergy costs as well as tax incentives for mitigation measures. This report presents the findings of the study. Background In 2007, the Intergovernmental Panel on Climate Change (IPCC) determined that, without doubt, significant climate change is occurring, and that there is a 90 percent probability that the change is due to human activity, particularly the burning of fossil fuels and clearing of natural vegetation (IPCC, 2007). Climate change resulting from human activity is one of the most critical prob- lems facing society. Without significant reduction of greenhouse gases (GHG) emitted by burning fossil fuels, temperatures will continue to increase; sea lev- els will continue to rise; precipitation patterns will change; and extreme cli- mactic events, such as hurricanes and droughts, will increase in severity and frequency. Given its location and topography, such trends are likely to have a particularly severe impact on New Orleans. Recent observations indicate that climate change is occurring more rapidly than envisioned just a few years ago. Ocean warming is about 50 percent greater than had been predicted in 1990; sea levels have risen faster than fore- casted; ice coverage has shrunk; and levels of carbon dioxide (CO2) in the atmosphere have risen beyond what some scientists consider to be the “dan- gerous anthropogenic interference” (DAI) level, a level beyond which climate 2 Carbon Study Final Report 2012
  • 9. disaster is imminent (U.S. Global Change Research Program, 2009; Kolbert, 2009). Extreme climate events are occurring more frequently (National Re- search Council, 2011). Although the recent economic recession resulted in a decline in U.S. energy use and, therefore, carbon emissions, emissions in 2010 saw the largest increase ever recorded (Gillis, 2011). Continued increases are expected as the economy recovers and develops, unless measures to cost-effectively reduce energy use and mitigate carbon emissions are implemented (National Research Council, 2011). The U.S. is not the global leader in GHG emissions, which are currently more than 30 million kilotons (kt) per year; carbon emissions from the U.S. had been steady at about 5.5 million kt per year prior to the recent economic re- cession (World Bank, 2011). China passed the U.S. in 2005 and is currently responsible for more than 7 million kt per year. China has been the major contributor to global increases over the past few years. Nevertheless, the U.S. remains a major contributor to global emissions (India and Brazil, the next largest emitters, each account for about 1.7 million kt per year), but has not been a leader in global efforts to address climate change. Lack of a national energy policy reflects the gridlock in national fiscal, social, healthcare, trans- portation, etc., policies. New Orleans is among the U.S. cities that are most vulnerable to the impacts of climate change. Its tropical temperatures will increase as a result of global warming, increasing cooling costs and the risk of heat-related health problems for the elderly, the very young, and the ill. With much of the city below sea level, increases in sea levels will threaten the city’s survival. Being adjacent to the Gulf of Mexico and surrounded by water, additional or stronger hurricanes are a particular problem, as evidenced by the devastation caused by Hurricane Katrina in 2005. In 1999 – well before the Katrina disaster – New Orleans joined the Interna- tional Council for Local Environmental Initiatives (ICLEI) as a member of the Cities for Climate Protection (CCP) campaign. In 2009, the city completed an analysis of its carbon footprint using the CCP/ICLEI model (City of New Orleans Carbon Footprint Report, 2009). While the human causes of climate change are widely accepted and there is growing support for mitigation, important questions remain concerning the costs and impacts on economic development of climate change mitigation ef- forts. The L9W is trying to balance environmental impacts with the need to repopulate and develop its economy to recover from Hurricane Katrina. The purpose of this study is to assist the L9W in achieving those goals by analyzing the carbon impacts of alternative repopulation and development policies and the cost-effectiveness of potential measures to mitigate such impacts. Carbon Study Final Report 2012 3
  • 10. Carbon Modeling Emissions of CO2 are considered to be a primary cause of the enhanced green- house effect, in which GHGs such as CO2 collect in the upper levels of the Earth’s atmosphere and form an insulating layer, preventing heat in the Earth’s atmosphere from being released into space (Intergovernmental Panel on Cli- mate Change, 2007). While the greenhouse effect allows life to survive on Earth, failure to release heat into space at the same rate that it is absorbed by the Earth’s atmosphere results in global warming and climate change. The prin- cipal causes of GHG emissions are burning of fossil fuels and cutting down of trees (U.S. Global Change Research Program, 2009). While CO2 is the most significant GHG, gases such as methane, nitrous ox- ide, fluorocarbons, and others, as well as water vapor, also contribute to the enhanced greenhouse effect. In order to reflect this, carbon footprints are typi- cally expressed as “carbon equivalents”, including major GHGs. Numerous carbon calculators have been developed for residences, businesses, industries, etc. (Padgett et al., 2008). Our analyses were based on carbon calcu- lators developed by the U.S. Environmental Protection Agency (EPA). Carbon footprints are the most widely used measure of emissions of CO2 and other GHGs. A carbon footprint can be used to estimate emissions of GHGs by industries, individuals, households, or geographical areas, based primarily on use of fossil fuels for generation of electricity, transportation, and other purposes. Carbon footprints can be defined in terms of three levels of scope: (City of New Orleans Carbon Footprint Report, 2009). For the purposes of this analysis: • Scope 1 emissions are generated within the L9W, from residential, trans- portation, commercial, and governmental/institutional sources • Scope 2 emissions are generated outside the L9W due to demand within the L9W, mainly due to electrical power generation • Scope 3 emissions are all indirect emissions not covered in Scope 2, such as those resulting from production or transport of purchased materials. This analysis primarily addressed Scope 1 and 2 emissions; Scope 3 emissions are typically not included in carbon footprints because they are very difficult to quantify for a specific location. However, Scope 3 emissions due to food were included in this analysis, because it makes comparisons between the L9W and the U.S. more consistent. It should be noted that scopes are relative to the geo- graphic entity being analyzed, i.e., some Scope 3 emissions of the L9W would be recorded as Scope 1 or 2 emissions for Louisiana and the U.S. This analysis addressed residential, commercial, and governmental/institution- al sources of emissions. Industrial sources, such as the Industrial Canal; Alabo Street, Andry Street, and Maurice Avenue wharves; and the sewage treatment plant, were not included. Jackson Barracks was also not included. The intent 4 Carbon Study Final Report 2012
  • 11. was to focus on mitigation sources that the L9W community was most likely to be able to influence. Carbon footprint was used in this analysis as a proxy for environmental sustain- ability. This is somewhat simplistic, since environmental sustainability involves many resources. However, carbon footprint was determined to be a reasonable proxy for the environmental sustainability of repopulation and development alternatives for the purposes of this analysis because: • CSED has specifically identified carbon-neutrality as a goal • the Obama administration has expressed a specific goal of reducing carbon levels to 17 percent below 2005 levels by 2020 • carbon modeling and calculation of carbon footprints are relatively well- established and widely used as indicators of environmental sustainability • markets for trading carbon emissions exist in some states and countries, providing an opportunity to incorporate market-based consideration on the analyses. Consistent with the concepts reflected in corporate references to the “triple bottom line” (financial, environmental and societal) and the EPA’s P3 (People, Prosperity, and Planet) program, sustainable repopulation and development require a much broader perspective than just environmental sustainability. In addition to being environmentally sustainable, repopulation and development alternatives must be economically, financially, socially, culturally, organization- ally, and politically sustainable. Carbon Study Final Report 2012 5
  • 12. Current Carbon Footprint The carbon footprint of the L9W was estimated based on a series of analyses employing data that was increasingly specific to the L9W. To the extent pos- sible, analyses were based on 2010 U.S. Census data. Census data indicated a population of 2,714 in 1,040 households in the Holy Cross neighborhood and a population of 2,842 in 1,061 households in the remainder of the L9W in 2010 (U.S. Census Bureau, 2011). Based on house- holds receiving mail in 2005, these values would indicate that the Holy Cross neighborhood had reached about 43 percent of pre-Katrina levels, while the remainder of the L9W had reached about 19 percent of pre-Katrina levels (GNOCDC, 2010). It should be noted that, consistent with trends through- out New Orleans, household size has decreased since 2005 due to fewer chil- dren. In 2005, the average household size in the L9W, including the Holy Cross neighborhood, was approximately 2.8 people per household; in 2010, it was approximately 2.65 people per household. In the L9W and Holy Cross neighborhoods, this pattern may also reflect fewer multi-generational, extend- ed families than before Katrina. While U.S. Census data were used in these analyses, it should be acknowledged that such data is often criticized for undercounting low income and minority residents. In comparison with the 2010 Census data indicating 1,040 house- holds in the Holy Cross neighborhood and 1,061 households in the remainder of the L9W, the Greater New Orleans Community Data Center (GNOCDC) estimated that 1,226 households in the Holy Cross neighborhood and 1,271 households in the remainder of the L9W were receiving mail in June 2010 (GNOCDC, 2010). An initial analysis was based on data specific to New Orleans, as reported in the City of New Orleans Carbon Footprint Report issued in July 2009. The report presents emission and population data for 2007. Based on the assumption that carbon emissions per household in New Orleans remained constant between 2007 and 2010, average 2007 carbon emissions per household for New Or- leans and population levels in the L9W as of June 2010 were used to estimate the current carbon footprint of the L9W. The analysis included emissions from governmental, residential, and commercial sources; industrial sources of emis- sions were not included. Based on the New Orleans carbon footprint data, carbon equivalent emissions from residential, commercial, and governmental sources in the L9W for 2007, based on the percentage of the city population in the L9W, were estimated to be 40,000 tons per year. Based on an estimate of 1,375 households in the L9W (including Holy Cross) in 2007, this represents an average of 55,000 to 60,000 pounds per year per household, with 40,000 to 45,000 pounds per year of this due to residential, transportation and waste sources, and 15,000 to 20,000 pounds per year due to commercial and governmental sources (GNOCDC, 2010; Carbon Footprint Report, 2009). Assuming that average emissions per household remained constant between 2007 and 2010, the carbon footprint 6 Carbon Study Final Report 2012
  • 13. of the L9W in 2010 was estimated, based on city-wide data, to be 60,000 tons per year of carbon equivalents; of this, 40,000 tons were due to residential sources and approximately 20,000 tons were due to commercial and govern- mental sources. Another analysis employed a model developed by EEGLP specifically for the L9W, including a carbon calculator based on the EPA model. The model esti- mated approximately 45,000 pounds per year per household of carbon equiva- lent emissions from residential sources, for a total of approximately 47,250 tons per year in the L9W. With an estimated 12,336 tons per year from com- mercial and institutional (including governmental) sources, as shown in Table 1, the total current L9W carbon footprint was estimated to be approximately 59,600 tons per year, essentially the same as the estimate based on city-wide data. Table 1. Estimated Current Commercial and Institutional Sources of Emissions Activity Ave. Establishments Total (tons) Grocery/Convenience 395 4 1,580 Fast food/restaurant 344 6 2,064 Retail store 211 4 844 Bank/financial 401 2 802 Gas/service station 164 9 1,476 Beauty/barber shop 164 4 656 Church 83 15 1245 School 488 1 488 Social center 282 2 564 Total L9W Commercial and Institutional 12,336 Emissions Based on these estimates, without reductions in the carbon footprint per house- hold, repopulation is projected to result in proportional increases in the carbon footprint of the L9W at a rate of about 45,000 pounds per year per household. Economic development, including increases in the incomes of L9W residents and development of commercial and institutional activity in the L9W, may also result in increases in its carbon footprint, since households with higher incomes tend to generate higher GHG emissions, and new or recovered busi- nesses or institutions in the L9W will represent new sources of such emissions (Grubb, Muller and Butler, 2004). In the absence of cost-effective mitigation, repopulation and development of the L9W will increase its carbon footprint, making achievement of the goal of carbon-neutrality more difficult. Carbon Study Final Report 2012 7
  • 14. Repopulation & Development Scenarios Four scenarios were developed to represent alternative future levels and pat- terns of repopulation and economic development in the L9W. The scenarios are consistent with the objectives of the L9W community, the New Orleans Master Plan, and local zoning ordinances. A carbon footprint was estimated for each scenario. The four scenarios were based on two repopulation alternatives and two eco- nomic development alternatives. All scenarios assumed a return to pre-Katrina population levels in the L9W, resulting in a total of about 7,600 households of approximately 2.8 persons per household for a total population of about 21,000 (U.S. Census Bureau, 2000; GNOCDC, 2010). This assumption is consistent with the community goal of returning to pre-Katrina population levels in order to ensure the social, economic and political viability of the L9W (Sustainable Restoration Plan…, 2006). Repopulation Base Case The repopulation base case assumed that repopulation will approximate pre- Katrina distributions, with about one-third in the Holy Cross neighborhood and two-thirds in the remainder of the L9W. For this analysis, the L9W out- side the Holy Cross neighborhood was divided into two areas: the area between St. Claude Avenue and Galvez Street, and the area north of Galvez. Table 2 presents estimates of pre-Katrina and June 2010 population levels in the Holy Cross neighborhood, the area north of Galvez Street, and the area between St. Claude Avenue and Galvez Street. The table also shows the numbers of ad- ditional households required in these areas to achieve pre-Katrina population levels under the repopulation base case. 8 Carbon Study Final Report 2012
  • 15. Repopulation Alternative The repopulation alternative assumed that future repopulation will be clustered more densely in areas of higher elevation (generally above Mean Sea Level, as approximated in the L9W by Galvez Street). This assumption is consistent with the community goal of reducing the demographic footprint of the L9W and concentrating future repopulation in areas of higher elevation in the southern portion of the neighborhood (Sustainable Restoration Plan…, 2006). It is also consistent with the concepts of sustainable engineering and the New Orleans Master Plan. All scenarios assumed that existing development in areas of lower elevation north of Galvez Street will be maintained, and that currently unoccupied houses north of Galvez (estimated at approximately 245) will be occupied, but the repopulation alternative assumed that no new houses will be built north of Galvez. Table 2 shows the estimated numbers of additional households re- quired in the Holy Cross neighborhood and the area between St. Claude Av- enue and Galvez Street to achieve pre-Katrina L9W population levels under the repopulation alternative (GNOCDC, 2010). Table 2. Repopulation Scenarios Additional Additional Households Households Households Households Area 2005 June 2010 Repopulation Repopulation Base Case Alternative Holy Cross 2240 1040 1200 2625 Neighborhood St. Claude Ave. 2680 795 1885 2630 to Galvez St. North of 2680 265 2415 245 Galvez St. Total 7600 2100 5500 5500 Clustering repopulation growth in a smaller footprint would be expected to reduce per household emissions, based on evidence that density and per house- hold emissions are inversely related (Ewing and Rong, 2008). This was incor- porated in the estimates of carbon footprint by adjusting household emissions by a factor representing assumed density. If future repopulation is concentrated south of Galvez, the area between Galvez and St. Claude would be expected to increase from low to medium density, while the Holy Cross neighborhood would remain high density and the area north of Galvez would remain low density. Based on previous research, it was estimated that household emissions in low density areas would be approxi- mately 45 percent higher than in medium density areas, for a total of 65,250 pounds per year, while household emissions in high density areas would be approximately 45 percent lower than in medium density areas, for a total of 24,750 pounds per year (Norman, MacLean and Kennedy, 2006). Carbon Study Final Report 2012 9
  • 16. Economic Development Base Case The economic development base case assumed that household incomes in the L9W, adjusted for inflation, will return to pre-Katrina levels, approximately $27,500 per year (U.S. Census, 2000). It also assumed that commercial and institutional activity will return to estimated pre-Katrina levels. Table 3 shows assumed L9W commercial and institutional activity for the eco- nomic development base case under each repopulation scenario. The repopu- lation alternative reflects slightly lower levels of commercial and institutional activity in the L9W than the repopulation base case, on the assumption that some commercial and institutional activity is geographically-dependent, i.e., if repopulation north of Galvez is limited to existing houses, fewer commercial and institutional activities will locate there. Table 3. Assumed Commercial and Institutional Activity Repop alternative/dev base Repop/dev base case case Commercial Establish- Emissions Establish- Emissions Activities ments (Tons) ments (Tons) Grocery/ convenience 10 3950 8 3160 store Fast food/res- 20 6880 18 6192 taurant Retail store 20 4220 23 4853 Gas/service 25 4100 22 3608 station Beauty/barber 6 984 6 984 shop Motel 1 799 1 799 Office 22 8822 19 7619 Funeral home 1 282 1 282 Bank/financial 5 2005 3 1203 institution Entertainment 2 422 1 211 Institutional Activities Church 15 1245 14 1162 School 5 2440 5 2440 Cultural/social 4 1128 4 1128 center Police station 0 0 0 0 Fire station 0 0 0 0 Post office 0 0 0 0 Total Emissions 37,277 33,641 10 Carbon Study Final Report 2012
  • 17. Economic Development Alternative The economic development alternative assumed that the L9W average house- hold income will increase to the U.S. national average income level, about $50,000 per year, an increase of approximately 82 percent over pre-Katrina levels (American Community Survey, 2010). Under this scenario, the carbon footprint of households in the L9W and Holy Cross neighborhood was as- sumed to be the same as for the U.S., so values from the U.S. State Depart- ment’s Climate Action Report were used in the analyses for the economic de- velopment alternatives. As previously mentioned, the scopes involved in the analysis of the L9W and the U.S. differ somewhat in that some Scope 3 L9W emissions are actually a part of Scope 1 and 2 U.S. emissions. However, the Climate Action Report does not include Scope 3 emissions for the entire U.S., so the data is comparable to data previously used in this analysis. The national average carbon footprint is 104,000 pounds per household. Table 4 shows carbon footprints, expressed as tons of carbon equivalents per year for each scenario, unless mitigated. No timing was assigned to the scenar- ios. As discussed previously, the current L9W carbon footprint was estimated to be approximately 60,000 tons per year, with approximately one-quarter of its pre-Katrina population. Table 4. Estimated Future Carbon Footprints Repopulation Development Base Case Alternative Base Case 205,000 tons/year 150,000 tons/year Alternative 395,000 tons/year 302,000 tons/year Targets The L9W community has expressed a goal of achieving carbon-neutrality by 2020. If this goal is understood to require a target carbon footprint of zero tons per year, the estimated future footprints shown in Table 4 would have to be completely offset by mitigation measures. This appears to be very difficult to achieve, if not impossible. If, however, this goal is understood to mean that future repopulation and de- velopment should not increase the L9W carbon footprint beyond its current level, a carbon footprint of approximately 60,000 tons per year would be the target. Table 5 shows the mitigation necessary under each scenario to achieve this goal. Carbon Study Final Report 2012 11
  • 18. Table 5. Estimated Mitigation Required to Achieve L9W Goal Repopulation Development Base Case Alternative Base Case 145,000 tons/year 90,000 tons/year Alternative 335,000 tons/year 242,000 tons/year The Obama administration has expressed a goal of reducing carbon emissions to 17 percent below 2005 levels. Based on pre-Katrina population and as- sumed commercial and institutional activity in the L9W, the 2005 L9W foot- print was estimated to have been approximately 208,000 tons from residential, commercial, and institutional sources. Achieving the Obama administration goal would define a target for the L9W of approximately 173,000 tons per year. Table 6 shows the mitigation necessary under each scenario to achieve this goal. Table 6. Estimated Mitigation Required to Achieve Obama Administration Goal Repopulation Development Base Case Alternative Base Case 32,000 tons/year 0 tons/year Alternative 222,000 tons/year 129,000 tons/year Potential Mitigation Measures The costs and capacities of potential measures to mitigate carbon emissions were analyzed in terms of annual costs per ton of carbon mitigated and tons of carbon mitigated per year. Some mitigation measures involve behavioral choices, such as thermostat settings; use of public transportation; and use of a dishwasher, clothes dryer, air conditioning, compact fluorescent lighting (CFL), etc. Such measures may involve no cost and could generate savings. Other measures involve construction or renovation activities, including: • development of new homes and neighborhoods according to sustainability guidelines • installation of solar photovoltaic panels on existing and new buildings • installation of solar hot water heaters in existing and new homes • installation of energy-efficient mechanical and electrical systems in existing homes • installation of energy-efficient insulation, doors and windows in existing homes • de-construction and re-use of building materials • development of green spaces and urban agriculture 12 Carbon Study Final Report 2012
  • 19. Mitigation measures were investigated for residential, commercial, and insti- tutional sources of emissions. Savings resulting from energy reductions, tax credits, and other financial incentives were considered. Table 7 shows annualized costs and carbon savings for potential mitigation measures for individual households as well as for the entire L9W. As shown, “costs” ranged from savings of approximately $100 per year per household for a solar hot water heater to an annualized cost of almost $1,100 per year for a house designed and constructed according to sustainability guidelines. Mitiga- tion capacities ranged from 0.2 tons per year of carbon mitigated per house- hold for improved doors and windows and insulation, to over 10 tons per year Table 7. Residential Mitigation Measures and Net Costs Per Ton of Carbon Saved Annual Annual Annual L9W Annual Annual Carbon Cost/ L9W Mitigation Annual Cost Cost/ Cost per Savings per Ton of Carbon Measure L9W Ton of Household Househould(tons) Carbon Savings Carbon Saved (tons) Saved Natural Drying $0 0.68 $0 $ - 5,141 $0 CFLs $0 0.50 $0 $ - 3,830 $0 Natural cooling $0 0.33 $0 $ - 662 Dishwashing by $0 0.32 $0 $ - 2,441 $0 Hand Solar Hot Water $100 1.41 $71 $555,300 7,821 $71 Heater Solar Panels $61 2.21 $28 $466,500 16,777 $28 HVAC $9 4.45 $2 $18,000 8,900 $2 Green Design & ($1,090) 10.12 ($108) ($5,495,000) 51.011 ($108) Construction Lighting Controls ($101) 0.80 ($126) ($202,000) 1,600 ($126) Doors and Win- ($59) 0.20 ($295) ($118,000) 400 ($297) dows Insulation ($92) 0.20 ($654) ($262,000) 400 ($654) Total Residential Mitigation Potential 98,983 for a house designed and constructed according to sustainability guidelines. As shown, the maximum mitigation capacity of these measures is approximate- ly 100,000 tons per year, so mitigation of residential sources does not appear to be sufficient to meet targets based on the L9W’s goal of carbon-neutrality except under the economic development base case/repopulation alternative scenario, if carbon-neutrality is understood to mean repopulating and devel- oping without increasing the current L9W carbon footprint of approximately 60,000 tons per year. It does appear possible to meet the Obama administration goal of reducing carbon emissions to 17 percent below 2005 levels with residential mitigation measures, under the economic development base case, i.e., incomes and eco- Carbon Study Final Report 2012 13
  • 20. nomic activity in the L9W return to pre-Katrina levels. As shown in Table 6, no mitigation would be required under the economic development base case/ repopulation alternative scenario; a combination of behavioral changes and solar based measures could easily meet the mitigation required under the eco- nomic development base case/repopulation base case scenario. Economic development, while highly desirable, increases mitigation require- ments significantly. It may be possible to achieve, or nearly achieve, the Obama administration goal for the economic development alternative/repopulation al- ternative scenario if mitigation from commercial and institutional sources is included, but achieving the Obama target under the economic development alternative/repopulation base case scenario would require extraordinary efforts, perhaps including development of a solar power plant in the L9W or signifi- cant improvements in public transportation. Commercial and institutional mitigation measures were estimated using the same methods as for residential mitigation, since many methods for residential mitigation would also be practical for the types of smaller commercial and institutional establishments that exist and are likely to develop in the L9W. Mitigation estimates were very approximate, due to the unpredictability of fu- ture commercial and institutional development in the L9W. Since commercial and institutional sources represent a relatively minor portion of the L9W car- bon footprint, such approximations appeared reasonable. Potential mitigation from commercial and institutional sources was estimated to be approximately 12,000 to 20,000 tons per year. Minimum costs for achieving the Obama administration goals through resi- dential, commercial and institutional measures are shown in Table 8. They range from zero to over $5 million per year, which would achieve the maxi- mum mitigation from residential, commercial and institutional sources but would still not meet the Obama goal under the economic development alter- native/repopulation base case scenario; extraordinary measures would be re- quired under that scenario to mitigate approximately 90,000 to 100,000 tons per year of GHG emissions beyond that which could be mitigated by resi- dential, commercial and institutional measures. These costs were based on the assumption that mitigation measures would be implemented in order of their cost-effectiveness, i.e., the most cost-effective measures would be implemented before less cost-effective measures. Table 8. Residential, Commercial, and Institutional Mitigation Costs to Achieve Obama Administration Goal Repopulation Development Base Case Alternative Base Case $891,857/year $0/year Alternative ($5,036,171/year)* ($5,036,171/year)* *Goal unattainable with current mitigation measures Figure 1 shows graphically the mitigation necessary to achieve the Obama ad- 14 Carbon Study Final Report 2012
  • 21. ministration goal under the four scenarios and the direct costs. The most cost- effective measures are toward the left end of the horizontal axis, as reflected in the estimated cost per ton of carbon mitigated measured on the vertical axis. Mitigation capacities (Carbon Saved) are measured along the horizontal axis. Figure 2 shows mitigation costs net of any savings resulting from reduced energy usage; Figure 3 shows mitigation costs net of energy savings and tax or other incentives. Figure 4 shows mitigation measures on a household basis (therefore resulting in different mitigation capacities) and is the same as Figure 3 but without green design (since on a household basis green design would be double counting the individual measures taken). Numerous assumptions were necessary to estimate costs and mitigation ef- fectiveness and capacities of such measures. These are described in following sections. Mitigating Residential Emissions Numerous potential measures are available to mitigate emissions from resi- dences. These include behavioral measures, which involve no cost, or even sav- ings, but could involve an inconvenience to L9W residents. Others require design or construction and involve costs. Carbon Study Final Report 2012 15
  • 22. Behavioral Measures There are many ways to save energy (and money) in the home that cost little or nothing. It has been estimated that behavioral changes by community resi- dents, including changing thermostat settings, reducing lighting, using pub- lic transportation, and other measures, could reduce energy costs by about $7,000 per year per household; reduce energy use by 15 percent per year per household; and reduce carbon emissions by almost 25,000 pounds per year per household (Nurtured World, 2011). Another behavioral change could involve use of CFLs instead of traditional incandescent bulbs. Entergy will provide 20 free CFLs per household. These 20 bulbs can reduce electric bills by $90 and mitigate 900 pounds of carbon equivalents per year per household. Mitigation can also be achieved by eliminating or reducing the use of some household appliances. The carbon calculator developed for the L9W was used to evaluate how much energy a household could save by eliminating certain appliances. Eliminating window air conditioners (but still using ceiling fans to keep a house cool) could save a household almost $150 on electric bills and mitigate almost 1,500 pounds of carbon equivalents per year. Drying clothes naturally rather than with a dryer could save a household $130 on electric bills and 1,300 pounds of carbon equivalents a year. Washing dishes by hand instead of using a dishwasher could mitigate almost 650 pounds of carbon equivalents per year and reduce electric bills by around $65 each year per household. Such measures can reduce a household’s electricity usage by 6 percent and mitigate 4,300 pounds of carbon equivalents per household annually. However, not all households will readily adopt such changes, which could involve considerable inconvenience. Other options that can help to reduce household carbon footprints include replacing appliances that are not Energy Star© rated (most likely, any appliances that date from pre-Katrina) with high- efficiency appliances. This would save on energy bills as well as reduce carbon emissions. Although there are initial costs of purchasing a new appliance, the Louisiana State Rebate Program will provide $75 for a room air conditioner, $100 for a clothes washer, and $150 for a dishwasher, as well as for other ap- pliances (Database of State Incentives for Renewables and Efficiency, 2011). Most of these high-efficiency appliances reduce electricity use by 10 to 30 per- cent and can mitigate 500 pounds of carbon equivalents annually, based on a comparison of the most efficient Energy Star© appliance to what Energy Star© assumes as a normal, non-energy efficient appliance. However, it appears unlikely that there are many pre-Katrina appliances in the L9W, so most are probably already Energy Star rated. It was assumed that behavioral measures would be employed to mitigate approximately 14,000 tons per year in the L9W, at no cost. 16 Carbon Study Final Report 2012
  • 23. Development of New Buildings and Neighborhoods According to Sustainability Guidelines Development of new buildings, including houses, schools, businesses, and neighborhoods according to sustainability guidelines could involve Leader- ship in Energy and Environmental Design (LEED™) standards developed by the U.S. Green Building Council (USGBC) or more general green building practices. These involve use of natural circulation and lighting; energy-efficient building envelope and mechanical and electrical systems; and selection of ma- terials on a life-cycle, rather than initial, cost basis. Sustainable design of new residences was assumed to include solar panels and hot water heaters; high-ef- ficiency mechanical and electrical systems; and energy saving doors, windows, and insulation. Neighborhood development consistent with sustainability guidelines would involve clustering houses in areas of higher density, while using open spaces for parks, urban agriculture, wetlands, woodlands, or other purposes; walkways, use of bicycles, and public transportation would be enhanced. Commercial and institutional activities would be integrated with residential clusters and could incorporate the concepts of “new urbanism”, with mixed use patterns, street front access to stores, use of second floors for professional and commer- cial services, etc. Currently, at least 80 houses in the L9W have been constructed according to LEED™ criteria, including those developed by Make it Right and Global Green. Make it Right has constructed 75 houses that have been certified as LEED™ Platinum or are awaiting certification, and is planning 75 more. Global Green has constructed five LEED™ Platinum houses. In addition, Global Green’s de- velopment is a pilot project for LEED™ for Neighborhood Development. All analyses of housing costs and carbon savings were based on a typical shot- gun cottage of approximately 1,100 square feet. Such cottages are common throughout the L9W and representative of New Orleans architecture. They are inherently sustainable in terms of high windows and ceilings, natural ventila- tion, shutters, elevated first floors, and appropriate materials. Shotgun cottages, with front porches and narrow lots that facilitate interaction among neighbors, also contribute to neighborhood sustainability. To analyze the costs and mitigation capabilities of constructing new housing in the L9W according to green design criteria, a model was developed using Autodesk© Revit Architecture 2012, depicting a typical shotgun cottage. The 1,100 square foot model cottage consisted of three bedrooms, a bathroom, liv- ing/dining area, and kitchen. Floors, ceilings, roofs, windows, and walls were modeled. The Revit file was then exported to Autodesk© Green Building Studio for en- ergy analyses. This program uses weather, energy prices, and other parameters specific to Louisiana. Design alternatives including HVAC systems, lighting Carbon Study Final Report 2012 17
  • 24. systems, insulation, window treatments, and roofing types were varied using Green Building Studio to analyze the impacts on energy use and carbon emis- sions. While green design and construction practices can reduce energy use (and, therefore, costs), the perceived additional cost of “going green” is sometimes a barrier. However, considerable research has shown that construction accord- ing to LEED™ criteria is, on average, only one to two percent more expensive than normal construction, if it adds any cost at all (Cassidy, 2007). Based on an estimated construction cost for a typical shotgun cottage of approximately $150,000, green design and construction practices would increase costs by ap- proximately $3,000. In the L9W, building a sustainable house costs anywhere from $80/sq.ft. to $140/sq.ft, based on conversations held with representatives of Common Ground Relief and Global Green. However, in order to be conservative, it was assumed in this analysis that achieving maximum carbon mitigation through green design and construction would add approximately 10 percent to the cost of the model cottage ($15,000), for a final square footage cost of $150. Recognizing that a 10 percent premium for green design and construction is significantly higher than estimates of a LEED™ premium of 0-2 percent widely reported in literature, it was noted that most studies have been based on large commercial, institutional, and industrial buildings. Costs to achieve LEED™ standards might represent a higher percentage of base costs for the cottages be- cause some of the design and much of the construction management for hous- ing construction in the L9W will probably be done by homeowners or small contractors who might not be familiar with green construction practices. Since homeowners would likely be one-time purchasers of green building services, there would be limited opportunities for learning curves to reduce costs. These and other factors were considered in deciding to use a 10 percent premium. The green building premium was annualized over the projected 30 year life of a shotgun cottage, at an interest rate of 6 percent. Estimated annual costs are approximately $1,100. There have been numerous estimates of carbon mitigation resulting from con- struction of new housing according to green criteria. In this analysis, it was assumed that construction of new housing according to green design criteria would reduce annual household emissions by 45 percent (Energy Star, 2010). Based on estimated emissions of 45,000 pounds of carbon equivalents per year per household in the L9W, it was estimated that design and construction of new housing according to sustainability guidelines would reduce emissions by 20,250 pounds per year per household. It was assumed that all new housing in the L9W could be built according to sustainability guidelines. Not only is carbon emitted during daily activities of a residence, but materi- als used in construction convey “embodied carbon”, representing the carbon needed to extract and process raw materials; equipment required to manufac- ture products; and transportation of the finished products to end users (EPA, 18 Carbon Study Final Report 2012
  • 25. 2010). As mentioned previously, these are considered Scope 3 emissions, which are generally beyond the scope of this analysis. However, the Scope 3 carbon savings from building houses according to sus- tainability guidelines are so significant as to warrant mention. Based on the model shotgun cottage, a cottage built using non-sustainable materials would generate 73.3 tons of embodied carbon, while a cottage built using green ma- terials and practices would generate 43.8 tons, about a 40 percent decrease. Material differences between a cottage designed and constructed according to green criteria and a typical cottage include gypsum board from EcoRock, wood flooring (instead of carpeting) in the bedrooms and living room, wood doors (instead of aluminum), cellulose insulation, and concrete mixed with 25 per- cent fly ash. While it would be inconsistent to use mitigation of Scope 3 emis- sions to offset Scope 1 and 2 emissions, reducing embedded carbon is a benefit of construction of new housing according to green criteria. Development of neighborhoods according to sustainability guidelines would be reflected in higher densities in areas of higher elevation and improved public transportation. Such assumptions are reflected in the repopulation alternative. Solar Photovoltaic Panels Numerous L9W houses have solar photovoltaic panels, which produce electric- ity that can be consumed or sold back to the electrical provider as part of “net metering”. Some panels were purchased by homeowners and some were pro- vided by donors or volunteers. Ten panels were provided to L9W homeowners by Sharp Electronics, and Global Green has installed panels on the homes they have constructed. Typical home systems in the L9W have a capacity of about three kilowatts (kW) and an expected life of about 20 years. Solar photovoltaic panels are one of the most popular forms of renewable en- ergy. Solar panels are non-polluting and do not emit any GHGs (Solar Home, 2010). Based on Louisiana’s location, approximately three kilowatt hours (kWh) per square meter per day of electricity could be generated from solar energy (Johnson, 2009). Assuming four hours of peak sunlight per day, a three kW system can produce 4,380 kWh per year, saving approximately 2.2 tons of carbon. It was assumed in this analysis that all existing and new housing in the L9W could have solar photovoltaic panels installed, which could save the community 17,000 tons of carbon annually. Recently, photovoltaic systems have cost approximately $6,000 per kW in- stalled (Mike Murphy, 2012), although this cost has been declining signifi- cantly in recent years, to as little as $3,000 per kW. To be conservative, historic costs were used in this analysis. A typical three kW system, therefore, was esti- mated to cost about $18,000 installed. Annualized over an expected life of 20 years at an interest rate of 6 percent per year (to be consistent with the Green Building Studio), the cost is about $1,500 per year per system. Accounting for energy savings of 4,380 kilowatt-hours would save the owner about $440 per year, for a net annual cost of about $1,070 per year per household. Incorporat- Carbon Study Final Report 2012 19
  • 26. ing the Louisiana state tax credit of 50 percent and the Federal tax credit of 30 percent on solar energy investments, there is no longer an annual cost for solar photovoltaic cells, but rather an annual gain of about $60. A solar energy sys- tem is exempt from increasing a homeowner’s Louisiana state property taxes. It was assumed that all new homes would be built with solar PV panels and that all existing homes could install solar PV panels as well. Solar Hot Water Heaters The sun has been used to heat water for centuries. Solar hot water heaters are very effective in warmer climates like Louisiana’s. A solar water heater can be hurricane-resistant and provide 80 to 90 percent of annual water heating needs (Solar Direct, 2010). There are two types of solar hot water heaters that have been used in New Orleans, one of which is no longer permitted (Mike Mur- phy, 2012). The system that is no longer allowed, which is cheaper at an initial cost of about $6,700, is a direct system, with a schematic, shown in Figure 5. The second system, the one used in our analysis and seen in Figure 6, costs about $9,500 but can save about 2,800 kWh of electricity, for an annual sav- ings of about $280, and reduce emissions by about two tons of carbon equiva- lents per year. Over a 10 year lifespan, the annual cost is about $1,350, which is comparable to solar PV panels. There is a rebate of either $750 or $1000 for solar hot water heaters, depending on the size of the system, from Entergy New Orleans. Combining this rebate with the 50 percent Louisiana state tax credit and 30 percent Federal tax credit means a homeowner could actually be gain- ing about $100 annually. It was assumed in this analysis that all new homes could be built with solar hot water heaters and that up to 25 percent of existing homes might upgrade their current system. Figure 2. Solar Hot Water Heaters Direct Solar Hot Water Indirect Solar Hot Water 20 Carbon Study Final Report 2012
  • 27. Improved Mechanical and Electrical Systems Many opportunities exist to encourage consumers to purchase energy-efficient mechanical and electrical systems. Improvements to heating, ventilating, and air conditioning (HVAC) and lighting systems in L9W homes were analyzed in terms of mitigation capability and cost. It was assumed that improved me- chanical and electrical systems could be installed in all existing homes in the L9W; new homes designed and constructed according to sustainability guide- lines would include such systems. Improved HVAC Systems Based on an analysis using Green Building Studio to model energy savings from improved HVAC systems, choosing or upgrading from a low-rated system (14 SEER rating) to a more highly-rated system (17 SEER rating) can save 4.45 tons of carbon equivalents annually per household. Energy Star© is currently issuing a $300 tax credit on all HVAC systems that meet such requirements. Additionally, the Louisiana Department of Natural Resources offers a Home Energy Rebate Option (HERO) for both existing and new homes, through which each existing home can receive a rebate of $0.20 per kWh saved, with a $3,000 maximum incentive, while new homes can receive $3,000 for re- ducing the entire home’s energy costs by 50 percent through HVAC or other improvements (Database of State Incentives for Renewables and Efficiency, 2011). Though initial costs of highly efficient HVAC systems can be $6,000 or more, choosing an efficient system with a high SEER rating can save $560 a year on energy bills. Through energy savings and tax and other incentives, a homeowner can save about $26 annually. Improved Lighting Systems Designing a home’s lighting system to efficiently use lighting power density (LPD) is a cost-free way to save energy. The LPD is an evaluation of the watt- age used per area of room lighted. If light fixtures are logically placed through- out a home to reduce lighting intensity by just 20 percent, a home could save $35 dollars in energy bills and 400 pounds of carbon equivalents annually. An easy and convenient way to reduce energy usage and costs is to include occu- pancy and daylight sensors in the home. Occupancy sensors can turn lights on or off whenever someone enters or leaves a room. This takes the guesswork out of switching lights on or off. Daylight sensors can dim or turn off light fixtures when there is sufficient daylight available to brighten a room. Such a system costs almost $1,400. However, through HERO, existing homes can receive $0.20 per kWh saved with various improvements (lighting included), and new homes can receive $2,000 for achieving a HERS (Home Energy Ratings Sys- tem) rating of 70 or better (Database of State Incentives for Renewables and Efficiency, 2011). Analyses performed using the Green Building Studio showed that installing sensors and reducing LPD can save a household over $100 on energy bills and reduce its carbon footprint by 1,600 pounds annually. Carbon Study Final Report 2012 21
  • 28. Improved Insulation, Doors, and Windows Poor insulation and openings in the building envelope release warm air in the winter, increasing heating costs, and have the reverse effect in the summer, increasing cooling costs. Not only does increased HVAC usage for heating and cooling increase costs, but also uses more energy and, therefore, generates more carbon. The Green Building Studio was used to analyze the carbon savings of improved insulation, doors, and windows in existing L9W houses. New Orleans lies in Climate Zone 2. Each climate zone has specific ener- gy code requirements to qualify for tax credits (U.S. Department of Energy, 2009). The Green Building Studio was used to analyze energy efficiency if houses improved on code requirements. Increasing insulation, such as under the CSED program to install thermal barriers in homes, would mitigate almost 800 pounds of carbon equivalents and reduce energy costs nearly $200 annu- ally per household. Choosing code-minimum values or better, as well as install- ing Energy Star© or Therma Star© doors and windows, can help maintain a comfortable home environment as well as reduce the L9W carbon footprint. It was assumed that improved insulation, doors, and windows could be installed in all existing homes in the L9W; new homes designed and constructed accord- ing to sustainability guidelines would include such features. Green Spaces Another mitigation method that could contribute to meeting L9W sustainabil- ity goals is carbon sequestration, defined as “the removal and storage of carbon from the atmosphere in carbon sinks (such as oceans, forests, or soils) through physical or biological processes, such as photosynthesis” (GreenFacts, 2010). By constructing parks or playgrounds, developing urban agriculture, or allow- ing woodlands or wetlands to develop, carbon can be actively removed from the atmosphere, decreasing the L9W’s carbon emissions. Trees sequester 1.27 tons of carbon per acre, green spaces sequester 0.5 tons per acre, and wetlands sequester 11 tons per acre (Gebhard, Gleaston et al. and Wills et al., 1994). Much of the L9W, particularly in the northern portion, remains vacant. Use of such spaces for parks, playgrounds, urban agriculture, or woodlands or wet- lands would eliminate carbon emissions that would result from development of those areas as well as through sequestration. For the repopulation base case, approximately 60 acres would be available for green spaces in the L9W, making the total carbon sequestration potential ap- proximately 60 tons annually, based on an average of one ton per acre. For the repopulation alternative, an additional 100 acres north of Galvez could be used for carbon sequestration through green spaces, for a total carbon sequestration potential of approximately 160 tons of carbon per year, based on an average of one ton per acre. Development and maintenance of green spaces can involve little or no initial and annual costs. The life of sequestration agents such as trees, bushes, and 22 Carbon Study Final Report 2012
  • 29. other vegetation is as much as 50 years. Bayou Bienvenue long served as a neighborhood wetland. If it is restored as planned, it could serve as a sequestration agent. However, it is unlikely that Bayou Bienvenue will be restored before 2020; in addition, active wetlands are also emitters of GHGs, so it is not clear to what extent a renewed Bayou Bienvenue would mitigate L9W GHG emissions. Use of open spaces for parks, playgrounds, and other community functions also contributes to neighborhood sustainability. There is a long and active tra- dition in the L9W of backyard and neighborhood gardens. There are currently several community gardens in the L9W, and several local organizations are committed to supporting urban agriculture. Carbon sequestration through development and maintenance of green spaces appears to be a beneficial way to reduce carbon emissions for L9W at minimal cost, although the mitigation impact is relatively insignificant. It should be noted, however, that the savings from future emissions not generated (as well as in terms of “embodied carbon”) as a result of not building greatly outweigh the carbon savings from sequestration by green spaces. De-construction De-construction of buildings that cannot be renovated, and re-use of de-con- structed materials, has been ongoing in the L9W. The Green Project, located just outside the L9W, recycles salvaged building materials. Numerous structures in the L9W could be de-constructed. The EPA estimates that 70 percent of all materials from a building can be salvaged and recycled. On average, deconstruction with maximum salvaged and recycled materials costs about $4.50 to $5.40 per square foot, compared to $3.00 to $5.00 per square foot for demolition. By de-constructing houses and recycling the ma- terials, an estimated 1.7 tons of carbon can be saved per house. However, it should be noted that this represents a reduction in Scope 3 emissions, as dis- cussed previously, and could not be used to offset Scope 1 or 2 emissions (EPA, 2011). Mitigating Institutional Emissions Institutions such as schools and churches can be large carbon emitters. Schools are high energy users so inherently emit a large amount of GHGs; because of this, building energy-efficient schools has become a priority throughout the country. The U.S. Green Building Council has LEED™ criteria for schools, and there are numerous examples of energy-efficient schools and churches. Within the L9W, schools will become more important as the population increases and a younger population develops. As schools are built and repopulated, it will be important to build energy-efficient schools. A typical school in the U.S. costs about $150 per square foot. Building a green school adds about a $5 per square foot premium onto these costs (Kats, 2006). Carbon Study Final Report 2012 23
  • 30. Energy efficient systems that are incorporated into school construction or ren- ovation can save the equivalent of $7 per square foot over a period of 15 years. This energy savings will make up for up for the “green” premium that is paid on the initial costs. Churches can also save on energy costs while reducing their carbon emissions for little or no cost. Energy Star© has created a program designed to give congregations tools and advice to help them lower their energy costs and also cut their carbon emissions. Energy Star© states that their energy conserva- tion advice can help churches reduce up to 30 percent of their energy costs (Energy Star for Congregations, 2011). Lighting is one of the greatest con- sumers of electricity in a church. Conservation measures include using energy efficient lighting and lighting controls, which is a relatively inexpensive way of decreasing energy costs. Depending on the congregation’s finances, such proj- ects could be worthwhile. Churches, schools, and other institutions could also implement mitigation measures such as solar hot water heaters and solar photovoltaic panels. How- ever, incentives and rebates that reduce the costs of such systems for homeown- ers may not be available to institutions. To some extent, the current lack of institutions in the L9W is an advantage; new institutional facilities can be planned and designed to be sustainable. Esti- mates of mitigation from institutional sources were based on the levels and mix of institutional activity shown in Table 3. Since the savings for churches, schools, and non-profit organizations are not in the form of up-front payments, such organizations need to find methods of fi- nancing energy-efficient projects to take advantage of tax and other incentives. These could come in the form of lease-purchase options or power purchase agreements. Mitigating Commercial Emissions While some carbon mitigation measures can be applied both to commercial and residential properties, businesses have specific tax incentives that apply to their projects. Within New Orleans, Entergy offers a rebate program that pro- vides up to $0.14 per kWh in rebates for businesses. Small businesses, which are defined as having an average peak demand less than 100 kW, are given $0.14 per kWh for implementing energy-efficient technologies for lighting and HVAC systems, doors, windows, insulation, and any other technology that results in measurable electricity use reduction. Businesses that have a peak demand greater than 100 kW are also eligible to receive $0.10 per kWh saved on lighting improvements and $0.12 per kWh saved on all other improve- ments. There is also a Federal tax deduction from which businesses can receive be- 24 Carbon Study Final Report 2012
  • 31. tween $0.30 and $1.80 per square foot for energy-efficient investments. The amount of the deduction depends on whether the building reaches certain benchmarks for energy savings as defined by the Federal Energy Policy Act. The deduction includes eligible technologies such as lighting and HVAC systems, doors, windows, insulation, siding, and roofs. There are also Federal tax credits of 30 percent on solar technology similar to the credits for residential proper- ties (Database of State Incentives for Renewables and Efficiency, 2011). Estimating mitigation from commercial sources is highly dependent on the forecast of future commercial activity in the L9W. Estimates used in this analy- sis were based on the levels and mix of commercial activity shown in Table 3. Conclusions Not surprisingly, it does not appear feasible for the L9W to repopulate to pre- Katrina levels and develop economically without increasing its carbon foot- print. However, it does appear feasible to repopulate and develop while meet- ing the Obama administration goal of reducing carbon emissions to 17 percent below 2005 levels. To do so could involve costs to L9W residents ranging from nothing to over $5 million per year, depending on repopulation and develop- ment policies and the mitigation measures employed. It appears possible to meet the Obama administration goal with residential mit- igation measures under the economic development base case, which assumes that incomes and economic activity in the L9W return to pre-Katrina levels. As shown in Table 6, no mitigation would be required under the economic development base case/repopulation alternative scenario, which assumes that incomes and economic activity return to pre-Katrina levels but that repopu- lation is clustered in areas of higher elevation; a combination of behavioral changes and solar measures could easily meet the mitigation required under the economic development base case/repopulation base case scenario, which assumes that incomes, economic activity, and population distributions return to pre-Katrina levels. Economic development, while highly desirable, increases mitigation require- ments. If the incomes of L9W residents increase to the national average, the challenges and costs of achieving the Obama administration goal increase sig- nificantly. It may be possible to achieve the Obama administration goal for the economic development alternative/repopulation alternative scenario, which assumes that incomes in the L9W increase to the national average and repopulation is clus- tered in areas of higher elevation, if mitigation from commercial and insti- tutional sources is included. Achieving the Obama goal under the economic development alternative/repopulation base case scenario, which assumes that incomes in the L9W increase to the national average and population distribu- tions return to pre-Katrina levels, would require extraordinary efforts. Carbon Study Final Report 2012 25
  • 32. As detailed in Table 7, the most cost-effective carbon mitigation measures in- volve behavioral changes. Awareness of energy use can lead to reductions in usage. Use of CFLs and reduced use or elimination of window air condition- ers, clothes dryers, and dishwashers can reduce carbon emissions while saving money. Unfortunately, behavioral changes have limited mitigation capacity. De-construction and development of green spaces have minimal costs but lim- ited mitigation capacity. However, behavioral changes and use of open spaces for parks, playgrounds, and other community functions can also contribute to neighborhood sustainability and community engagement. Solar hot water heaters are cost-effective, saving almost $100 per year, and are therefore highly desirable for a homeowner. In addition, installation of solar hot water heaters has significant mitigation capacity, making this among the most desirable mitigation measures. Likewise, solar photovoltaic panels save almost $60 annually and have a large mitigation capacity. It should be noted, as mentioned previously, that the prices of solar photovoltaic panels have been dropping significantly over the past few years, but conservative estimates based on historic prices were used in this analysis; if prices continue to drop, solar photovoltaic panels will become increasingly cost-effective. Improved HVAC systems will save homeowners about $26 annually, but homeowners could save even more by using the highest rated machines available. HVAC systems also have considerable mitigation capacity, which makes them desirables upgrades to choose. Energy-efficient doors and windows, lighting controls, and insulation do not save money, but cost less than $500 per household per year. Improved me- chanical systems have significant mitigation capacity at relatively minimal cost. Sustainable design and construction practices cost about $1,100 per house- hold per year. However, such measures have the greatest mitigation capacity. It should be noted that the premium used for sustainable construction in this analysis was intentionally very conservative, so it is unlikely that the cost would be greater than $1,100 per year. 26 Carbon Study Final Report 2012