SlideShare une entreprise Scribd logo
1  sur  1
Télécharger pour lire hors ligne
What Students Know and Can Do: Student Performance in Mathematics, Reading and Science

Snapshot of performance in mathematics, reading and science
Countries/economies with a mean performance/share of top performers above the OECD average
Countries/economies with a share of low achievers below the OECD average
Countries/economies with a mean performance/share of low achievers/share of top performers
not statistically significantly different from the OECD average
Countries/economies with a mean performance/share of top performers below the OECD average
Countries/economies with a share of low achievers above the OECD average
Mathematics
 

Mean score
in PISA 2012

Reading

Share
Share
of low achievers of top performers
in mathematics in mathematics
(Level 5 or 6)
(Below Level 2)

Annualised
change
in score points

Mean score
in PISA 2012

Science

Annualised
change
in score points

Mean score
in PISA 2012

Annualised
change
in score points

OECD average

494

23.1

12.6

-0.3

496

0.3

501

0.5

Shanghai-China
Singapore
Hong Kong-China
Chinese Taipei
Korea
Macao-China
Japan
Liechtenstein
Switzerland
Netherlands
Estonia
Finland
Canada
Poland
Belgium
Germany
Viet Nam
Austria
Australia
Ireland
Slovenia
Denmark
New Zealand
Czech Republic
France
United Kingdom
Iceland
Latvia
Luxembourg
Norway
Portugal
Italy
Spain
Russian Federation
Slovak Republic
United States
Lithuania
Sweden
Hungary
Croatia
Israel
Greece
Serbia
Turkey
Romania
Cyprus 1, 2
Bulgaria
United Arab Emirates
Kazakhstan
Thailand
Chile
Malaysia
Mexico
Montenegro
Uruguay
Costa Rica
Albania
Brazil
Argentina
Tunisia
Jordan
Colombia
Qatar
Indonesia
Peru

613
573
561
560
554
538
536
535
531
523
521
519
518
518
515
514
511
506
504
501
501
500
500
499
495
494
493
491
490
489
487
485
484
482
482
481
479
478
477
471
466
453
449
448
445
440
439
434
432
427
423
421
413
410
409
407
394
391
388
388
386
376
376
375
368

3.8
8.3
8.5
12.8
9.1
10.8
11.1
14.1
12.4
14.8
10.5
12.3
13.8
14.4
18.9
17.7
14.2
18.7
19.7
16.9
20.1
16.8
22.6
21.0
22.4
21.8
21.5
19.9
24.3
22.3
24.9
24.7
23.6
24.0
27.5
25.8
26.0
27.1
28.1
29.9
33.5
35.7
38.9
42.0
40.8
42.0
43.8
46.3
45.2
49.7
51.5
51.8
54.7
56.6
55.8
59.9
60.7
67.1
66.5
67.7
68.6
73.8
69.6
75.7
74.6

55.4
40.0
33.7
37.2
30.9
24.3
23.7
24.8
21.4
19.3
14.6
15.3
16.4
16.7
19.4
17.5
13.3
14.3
14.8
10.7
13.7
10.0
15.0
12.9
12.9
11.8
11.2
8.0
11.2
9.4
10.6
9.9
8.0
7.8
11.0
8.8
8.1
8.0
9.3
7.0
9.4
3.9
4.6
5.9
3.2
3.7
4.1
3.5
0.9
2.6
1.6
1.3
0.6
1.0
1.4
0.6
0.8
0.8
0.3
0.8
0.6
0.3
2.0
0.3
0.6

4.2
3.8
1.3
1.7
1.1
1.0
0.4
0.3
0.6
-1.6
0.9
-2.8
-1.4
2.6
-1.6
1.4
m
0.0
-2.2
-0.6
-0.6
-1.8
-2.5
-2.5
-1.5
-0.3
-2.2
0.5
-0.3
-0.3
2.8
2.7
0.1
1.1
-1.4
0.3
-1.4
-3.3
-1.3
0.6
4.2
1.1
2.2
3.2
4.9
m
4.2
m
9.0
1.0
1.9
8.1
3.1
1.7
-1.4
-1.2
5.6
4.1
1.2
3.1
0.2
1.1
9.2
0.7
1.0

570
542
545
523
536
509
538
516
509
511
516
524
523
518
509
508
508
490
512
523
481
496
512
493
505
499
483
489
488
504
488
490
488
475
463
498
477
483
488
485
486
477
446
475
438
449
436
442
393
441
441
398
424
422
411
441
394
410
396
404
399
403
388
396
384

4.6
5.4
2.3
4.5
0.9
0.8
1.5
1.3
1.0
-0.1
2.4
-1.7
-0.9
2.8
0.1
1.8
m
-0.2
-1.4
-0.9
-2.2
0.1
-1.1
-0.5
0.0
0.7
-1.3
1.9
0.7
0.1
1.6
0.5
-0.3
1.1
-0.1
-0.3
1.1
-2.8
1.0
1.2
3.7
0.5
7.6
4.1
1.1
m
0.4
m
0.8
1.1
3.1
-7.8
1.1
5.0
-1.8
-1.0
4.1
1.2
-1.6
3.8
-0.3
3.0
12.0
2.3
5.2

580
551
555
523
538
521
547
525
515
522
541
545
525
526
505
524
528
506
521
522
514
498
516
508
499
514
478
502
491
495
489
494
496
486
471
497
496
485
494
491
470
467
445
463
439
438
446
448
425
444
445
420
415
410
416
429
397
405
406
398
409
399
384
382
373

1.8
3.3
2.1
-1.5
2.6
1.6
2.6
0.4
0.6
-0.5
1.5
-3.0
-1.5
4.6
-0.8
1.4
m
-0.8
-0.9
2.3
-0.8
0.4
-2.5
-1.0
0.6
-0.1
-2.0
2.0
0.9
1.3
2.5
3.0
1.3
1.0
-2.7
1.4
1.3
-3.1
-1.6
-0.3
2.8
-1.1
1.5
6.4
3.4
m
2.0
m
8.1
3.9
1.1
-1.4
0.9
-0.3
-2.1
-0.6
2.2
2.3
2.4
2.2
-2.1
1.8
5.4
-1.9
1.3

1. Footnote by Turkey: The information in this document with reference to “Cyprus” relates to the southern part of the Island. There is no single authority representing both Turkish
and Greek Cypriot people on the Island. Turkey recognises the Turkish Republic of Northern Cyprus (TRNC). Until a lasting and equitable solution is found within the context of
the United Nations, Turkey shall preserve its position concerning the “Cyprus issue”.
2. Footnote by all the European Union Member States of the OECD and the European Union: The Republic of Cyprus is recognised by all members of the United Nations with
the exception of Turkey. The information in this document relates to the area under the effective control of the Government of the Republic of Cyprus.
The annualised change is the average annual change in PISA score points from a country’s/economy’s earliest participation in PISA to PISA 2012. It is calculated taking into
account all of a country’s/economy’s participation in PISA.
Note: Countries/economies in which the annualised change in performance is statistically significant are marked in bold.
Countries and economies are ranked in descending order of the mean mathematics score in PISA 2012.
Source: OECD, PISA 2012 Database; Tables I.2.1a, I.2.1b, I.2.3a, I.2.3b, I.4.3a, I.4.3b, I.5.3a and I.5.3b.

PISA 2012 RESULTS IN FOCUS  © OECD 2013

5

Contenu connexe

Similaire à تونس تحتل الــ 5 مراتب الأخيرة في تصنيف دولي يخص التعليم

Presentation for Erasmusplus project LTSDU on PISA 2012 results in Italy
Presentation for Erasmusplus project LTSDU on PISA 2012 results in ItalyPresentation for Erasmusplus project LTSDU on PISA 2012 results in Italy
Presentation for Erasmusplus project LTSDU on PISA 2012 results in Italysisifo68
 
Education Policy Outlook - Making Reforms Happen
Education Policy Outlook - Making Reforms HappenEducation Policy Outlook - Making Reforms Happen
Education Policy Outlook - Making Reforms HappenEduSkills OECD
 
PISA Report 2012 - Spain
PISA Report 2012 - SpainPISA Report 2012 - Spain
PISA Report 2012 - SpainMiqui Mel
 
Skilled for Life: Key Findings From the Survey of Adult Skills
Skilled for Life: Key Findings From the Survey of Adult SkillsSkilled for Life: Key Findings From the Survey of Adult Skills
Skilled for Life: Key Findings From the Survey of Adult SkillsIpsos UK
 
Use of PISA in quality improvement polices – Richard Yelland, OECD Head of Po...
Use of PISA in quality improvement polices – Richard Yelland, OECD Head of Po...Use of PISA in quality improvement polices – Richard Yelland, OECD Head of Po...
Use of PISA in quality improvement polices – Richard Yelland, OECD Head of Po...unicefmne
 
10 Slides on the World Economy in February 2014
10 Slides on the World Economy in February 201410 Slides on the World Economy in February 2014
10 Slides on the World Economy in February 2014Hannah Thomas
 
University/Industry -- Italy/World
University/Industry -- Italy/WorldUniversity/Industry -- Italy/World
University/Industry -- Italy/WorldAntonio Gulli
 
HLEG thematic workshop on "Inequality of Opportunity", Dirk van Damme
HLEG thematic workshop on "Inequality of Opportunity", Dirk van DammeHLEG thematic workshop on "Inequality of Opportunity", Dirk van Damme
HLEG thematic workshop on "Inequality of Opportunity", Dirk van DammeStatsCommunications
 
Latvia ensure--inclusive-and-robust-growth-main-findings-oecd
Latvia ensure--inclusive-and-robust-growth-main-findings-oecdLatvia ensure--inclusive-and-robust-growth-main-findings-oecd
Latvia ensure--inclusive-and-robust-growth-main-findings-oecdOECD, Economics Department
 
Edu policy outlook bp jan 2015
Edu policy outlook bp jan 2015Edu policy outlook bp jan 2015
Edu policy outlook bp jan 2015Beatriz Pont
 
Numeracy Achievement Gaps of Low- and High-Performing Adults: An Analysis Wit...
Numeracy Achievement Gaps of Low- and High-Performing Adults: An Analysis Wit...Numeracy Achievement Gaps of Low- and High-Performing Adults: An Analysis Wit...
Numeracy Achievement Gaps of Low- and High-Performing Adults: An Analysis Wit...AIRPIAAC
 
Investing in the future OECD MDCR Thailand 2018
Investing in the future OECD MDCR Thailand 2018Investing in the future OECD MDCR Thailand 2018
Investing in the future OECD MDCR Thailand 2018OECD, Economics Department
 
PISA 2012 Evaluating school systems to improve education
PISA 2012 Evaluating school systems  to improve educationPISA 2012 Evaluating school systems  to improve education
PISA 2012 Evaluating school systems to improve educationEduSkills OECD
 
Implications of PIACC Findings for England
Implications of PIACC Findings for EnglandImplications of PIACC Findings for England
Implications of PIACC Findings for EnglandIpsos UK
 
PISA 2018 - Are Students Smart About Money?
PISA 2018  - Are Students Smart About Money?PISA 2018  - Are Students Smart About Money?
PISA 2018 - Are Students Smart About Money?EduSkills OECD
 
Youth4Job Case Study
Youth4Job Case StudyYouth4Job Case Study
Youth4Job Case StudyJan Šašek
 
Why Skills Matter - Further Results from the Survey of Adult Skills
Why Skills Matter - Further Results from the Survey of Adult Skills Why Skills Matter - Further Results from the Survey of Adult Skills
Why Skills Matter - Further Results from the Survey of Adult Skills EduSkills OECD
 

Similaire à تونس تحتل الــ 5 مراتب الأخيرة في تصنيف دولي يخص التعليم (20)

Presentation for Erasmusplus project LTSDU on PISA 2012 results in Italy
Presentation for Erasmusplus project LTSDU on PISA 2012 results in ItalyPresentation for Erasmusplus project LTSDU on PISA 2012 results in Italy
Presentation for Erasmusplus project LTSDU on PISA 2012 results in Italy
 
Education Policy Outlook - Making Reforms Happen
Education Policy Outlook - Making Reforms HappenEducation Policy Outlook - Making Reforms Happen
Education Policy Outlook - Making Reforms Happen
 
PISA Report 2012 - Spain
PISA Report 2012 - SpainPISA Report 2012 - Spain
PISA Report 2012 - Spain
 
Skilled for Life: Key Findings From the Survey of Adult Skills
Skilled for Life: Key Findings From the Survey of Adult SkillsSkilled for Life: Key Findings From the Survey of Adult Skills
Skilled for Life: Key Findings From the Survey of Adult Skills
 
Use of PISA in quality improvement polices – Richard Yelland, OECD Head of Po...
Use of PISA in quality improvement polices – Richard Yelland, OECD Head of Po...Use of PISA in quality improvement polices – Richard Yelland, OECD Head of Po...
Use of PISA in quality improvement polices – Richard Yelland, OECD Head of Po...
 
10 Slides on the World Economy in February 2014
10 Slides on the World Economy in February 201410 Slides on the World Economy in February 2014
10 Slides on the World Economy in February 2014
 
OECD Skills Outlook - Key findings from the survey of adult skills
OECD Skills Outlook - Key findings from the survey of adult skillsOECD Skills Outlook - Key findings from the survey of adult skills
OECD Skills Outlook - Key findings from the survey of adult skills
 
University/Industry -- Italy/World
University/Industry -- Italy/WorldUniversity/Industry -- Italy/World
University/Industry -- Italy/World
 
HLEG thematic workshop on "Inequality of Opportunity", Dirk van Damme
HLEG thematic workshop on "Inequality of Opportunity", Dirk van DammeHLEG thematic workshop on "Inequality of Opportunity", Dirk van Damme
HLEG thematic workshop on "Inequality of Opportunity", Dirk van Damme
 
Latvia ensure--inclusive-and-robust-growth-main-findings-oecd
Latvia ensure--inclusive-and-robust-growth-main-findings-oecdLatvia ensure--inclusive-and-robust-growth-main-findings-oecd
Latvia ensure--inclusive-and-robust-growth-main-findings-oecd
 
Edu policy outlook bp jan 2015
Edu policy outlook bp jan 2015Edu policy outlook bp jan 2015
Edu policy outlook bp jan 2015
 
Numeracy Achievement Gaps of Low- and High-Performing Adults: An Analysis Wit...
Numeracy Achievement Gaps of Low- and High-Performing Adults: An Analysis Wit...Numeracy Achievement Gaps of Low- and High-Performing Adults: An Analysis Wit...
Numeracy Achievement Gaps of Low- and High-Performing Adults: An Analysis Wit...
 
Investing in the future OECD MDCR Thailand 2018
Investing in the future OECD MDCR Thailand 2018Investing in the future OECD MDCR Thailand 2018
Investing in the future OECD MDCR Thailand 2018
 
PISA 2012 Evaluating school systems to improve education
PISA 2012 Evaluating school systems  to improve educationPISA 2012 Evaluating school systems  to improve education
PISA 2012 Evaluating school systems to improve education
 
Schleicher resultados Pisa 2012
Schleicher resultados Pisa 2012Schleicher resultados Pisa 2012
Schleicher resultados Pisa 2012
 
OECD Skills Strategy Luxembourg
OECD Skills Strategy LuxembourgOECD Skills Strategy Luxembourg
OECD Skills Strategy Luxembourg
 
Implications of PIACC Findings for England
Implications of PIACC Findings for EnglandImplications of PIACC Findings for England
Implications of PIACC Findings for England
 
PISA 2018 - Are Students Smart About Money?
PISA 2018  - Are Students Smart About Money?PISA 2018  - Are Students Smart About Money?
PISA 2018 - Are Students Smart About Money?
 
Youth4Job Case Study
Youth4Job Case StudyYouth4Job Case Study
Youth4Job Case Study
 
Why Skills Matter - Further Results from the Survey of Adult Skills
Why Skills Matter - Further Results from the Survey of Adult Skills Why Skills Matter - Further Results from the Survey of Adult Skills
Why Skills Matter - Further Results from the Survey of Adult Skills
 

تونس تحتل الــ 5 مراتب الأخيرة في تصنيف دولي يخص التعليم

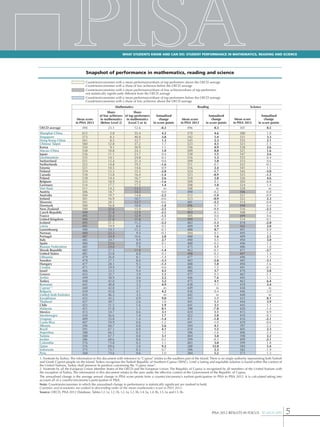
  • 1. What Students Know and Can Do: Student Performance in Mathematics, Reading and Science Snapshot of performance in mathematics, reading and science Countries/economies with a mean performance/share of top performers above the OECD average Countries/economies with a share of low achievers below the OECD average Countries/economies with a mean performance/share of low achievers/share of top performers not statistically significantly different from the OECD average Countries/economies with a mean performance/share of top performers below the OECD average Countries/economies with a share of low achievers above the OECD average Mathematics   Mean score in PISA 2012 Reading Share Share of low achievers of top performers in mathematics in mathematics (Level 5 or 6) (Below Level 2) Annualised change in score points Mean score in PISA 2012 Science Annualised change in score points Mean score in PISA 2012 Annualised change in score points OECD average 494 23.1 12.6 -0.3 496 0.3 501 0.5 Shanghai-China Singapore Hong Kong-China Chinese Taipei Korea Macao-China Japan Liechtenstein Switzerland Netherlands Estonia Finland Canada Poland Belgium Germany Viet Nam Austria Australia Ireland Slovenia Denmark New Zealand Czech Republic France United Kingdom Iceland Latvia Luxembourg Norway Portugal Italy Spain Russian Federation Slovak Republic United States Lithuania Sweden Hungary Croatia Israel Greece Serbia Turkey Romania Cyprus 1, 2 Bulgaria United Arab Emirates Kazakhstan Thailand Chile Malaysia Mexico Montenegro Uruguay Costa Rica Albania Brazil Argentina Tunisia Jordan Colombia Qatar Indonesia Peru 613 573 561 560 554 538 536 535 531 523 521 519 518 518 515 514 511 506 504 501 501 500 500 499 495 494 493 491 490 489 487 485 484 482 482 481 479 478 477 471 466 453 449 448 445 440 439 434 432 427 423 421 413 410 409 407 394 391 388 388 386 376 376 375 368 3.8 8.3 8.5 12.8 9.1 10.8 11.1 14.1 12.4 14.8 10.5 12.3 13.8 14.4 18.9 17.7 14.2 18.7 19.7 16.9 20.1 16.8 22.6 21.0 22.4 21.8 21.5 19.9 24.3 22.3 24.9 24.7 23.6 24.0 27.5 25.8 26.0 27.1 28.1 29.9 33.5 35.7 38.9 42.0 40.8 42.0 43.8 46.3 45.2 49.7 51.5 51.8 54.7 56.6 55.8 59.9 60.7 67.1 66.5 67.7 68.6 73.8 69.6 75.7 74.6 55.4 40.0 33.7 37.2 30.9 24.3 23.7 24.8 21.4 19.3 14.6 15.3 16.4 16.7 19.4 17.5 13.3 14.3 14.8 10.7 13.7 10.0 15.0 12.9 12.9 11.8 11.2 8.0 11.2 9.4 10.6 9.9 8.0 7.8 11.0 8.8 8.1 8.0 9.3 7.0 9.4 3.9 4.6 5.9 3.2 3.7 4.1 3.5 0.9 2.6 1.6 1.3 0.6 1.0 1.4 0.6 0.8 0.8 0.3 0.8 0.6 0.3 2.0 0.3 0.6 4.2 3.8 1.3 1.7 1.1 1.0 0.4 0.3 0.6 -1.6 0.9 -2.8 -1.4 2.6 -1.6 1.4 m 0.0 -2.2 -0.6 -0.6 -1.8 -2.5 -2.5 -1.5 -0.3 -2.2 0.5 -0.3 -0.3 2.8 2.7 0.1 1.1 -1.4 0.3 -1.4 -3.3 -1.3 0.6 4.2 1.1 2.2 3.2 4.9 m 4.2 m 9.0 1.0 1.9 8.1 3.1 1.7 -1.4 -1.2 5.6 4.1 1.2 3.1 0.2 1.1 9.2 0.7 1.0 570 542 545 523 536 509 538 516 509 511 516 524 523 518 509 508 508 490 512 523 481 496 512 493 505 499 483 489 488 504 488 490 488 475 463 498 477 483 488 485 486 477 446 475 438 449 436 442 393 441 441 398 424 422 411 441 394 410 396 404 399 403 388 396 384 4.6 5.4 2.3 4.5 0.9 0.8 1.5 1.3 1.0 -0.1 2.4 -1.7 -0.9 2.8 0.1 1.8 m -0.2 -1.4 -0.9 -2.2 0.1 -1.1 -0.5 0.0 0.7 -1.3 1.9 0.7 0.1 1.6 0.5 -0.3 1.1 -0.1 -0.3 1.1 -2.8 1.0 1.2 3.7 0.5 7.6 4.1 1.1 m 0.4 m 0.8 1.1 3.1 -7.8 1.1 5.0 -1.8 -1.0 4.1 1.2 -1.6 3.8 -0.3 3.0 12.0 2.3 5.2 580 551 555 523 538 521 547 525 515 522 541 545 525 526 505 524 528 506 521 522 514 498 516 508 499 514 478 502 491 495 489 494 496 486 471 497 496 485 494 491 470 467 445 463 439 438 446 448 425 444 445 420 415 410 416 429 397 405 406 398 409 399 384 382 373 1.8 3.3 2.1 -1.5 2.6 1.6 2.6 0.4 0.6 -0.5 1.5 -3.0 -1.5 4.6 -0.8 1.4 m -0.8 -0.9 2.3 -0.8 0.4 -2.5 -1.0 0.6 -0.1 -2.0 2.0 0.9 1.3 2.5 3.0 1.3 1.0 -2.7 1.4 1.3 -3.1 -1.6 -0.3 2.8 -1.1 1.5 6.4 3.4 m 2.0 m 8.1 3.9 1.1 -1.4 0.9 -0.3 -2.1 -0.6 2.2 2.3 2.4 2.2 -2.1 1.8 5.4 -1.9 1.3 1. Footnote by Turkey: The information in this document with reference to “Cyprus” relates to the southern part of the Island. There is no single authority representing both Turkish and Greek Cypriot people on the Island. Turkey recognises the Turkish Republic of Northern Cyprus (TRNC). Until a lasting and equitable solution is found within the context of the United Nations, Turkey shall preserve its position concerning the “Cyprus issue”. 2. Footnote by all the European Union Member States of the OECD and the European Union: The Republic of Cyprus is recognised by all members of the United Nations with the exception of Turkey. The information in this document relates to the area under the effective control of the Government of the Republic of Cyprus. The annualised change is the average annual change in PISA score points from a country’s/economy’s earliest participation in PISA to PISA 2012. It is calculated taking into account all of a country’s/economy’s participation in PISA. Note: Countries/economies in which the annualised change in performance is statistically significant are marked in bold. Countries and economies are ranked in descending order of the mean mathematics score in PISA 2012. Source: OECD, PISA 2012 Database; Tables I.2.1a, I.2.1b, I.2.3a, I.2.3b, I.4.3a, I.4.3b, I.5.3a and I.5.3b. PISA 2012 RESULTS IN FOCUS  © OECD 2013 5