SlideShare une entreprise Scribd logo
1  sur  17
Télécharger pour lire hors ligne
WILLIAMS CAPITAL RESEARCH
Equity Research                   Yahoo Inc. (NASDAQ:YHOO)
Company Update                    Current Rating: PERFORM

December 17, 2010                 Initiating Coverage with a Perform Rating

Internet Analyst: Brian Bolan 773 413 0285; bolan@willcap.com

Trading Desk: NY 800-924-1511                       CT 800-688-6349

YHOO                    Perform                            Fiscal Year                    Calendar Year             Curr. Q.   1 yr ago              Next 4 Quarters
                                      Key Data
Price:                   $16.51       (Rev in                                                                       Dec-10     Dec-09     Mar-11    Jun-11    Sep-11     Dec-11
                                                  FY09       FY10E       FY11E     CY09      CY10E        CY11E
Price Target:            $18.00       $bns)                                                                         F4Q10E     F4Q09      F1Q11E    F2Q11E    F3Q11E     F4Q11E
52 Week High:            $19.12       Rev prev:    NA         NA          NA       NA          NA          NA         NA         NA        NA        NA         NA        NA
52 Week Low:             $12.94       Rev          6.460       6.517       6.801    6.460       6.517       6.801      1.718      1.732     1.619     1.659      1.673     1.849
NTM P/E:                   16x        EPS          NA         NA          NA       NA          NA          NA         NA         NA        NA        NA         NA        NA
                                      prev:
                                      EPS
Market Cap ($B):          21.52                    $0.61       $0.67       $0.84    $0.61       $0.67       $0.84      $0.18      $0.15     $0.19     $0.20      $0.20     $0.25
Ent Value ($B):           19.00       EV/S:        2.94x       2.92x       2.79x    2.94x      2.92x        2.79x
Shares Outstdg (M):       1.30        P/E         27.07x      24.64x      19.65x   27.07x     24.64x       19.65x
Avg Daily Volume (M):     18.90
Cash/Share:               2.16
BV/Share:                 9.28


            Yet Another Hierarchical Officious Oracle is the acronym for Yahoo!. Yahoo! was first made available in 1994
            and has grown to serve more than 2.3 billion visits per month. Through its search engine, users can navigate the
            web and find useful information along with tools to communicate with others.

            The economic downturn and attempted acquisition by Microsoft (Nasdaq: MSFT - $27.99, not rated) has provided
            large distractions to a company that quite literally cannot afford another distraction. Having reached a deal with
            Microsoft to handle the search, the company is focusing on display and improving technology to better serve large
            clients.

            We believe that the fundamentals will improve slightly throughout the remainder of the year but that this is
            already in the stock. Upside surprises to US market share are expected by management although we are
            somewhat sceptical. We expect display to lead most of the upside for Yahoo! in the second half of 2010 as search
            looks to us to be a margin enhancer instead of its previous role as revenue growth supplier.

            At 31x trailing twelve months earnings, we believe that Yahoo! is fairly valued despite the difficulty in assigning
            value to the Asian assets the firm has. We initiate coverage on Yahoo! with a Market Perform rating and a 12-
            month price target of $18.00 based on a 21x multiple of our 2011 earnings estimate.


            Industry Discussion

            The internet search market is dominated by Google but still has several major competitors. While some smaller
            players are still around, the majority of the attention in the space is focused on Google, Yahoo! and
            Microsoft(Bing). Other companies like AOL Inc. (NYSE: AOL - $24.84, not rated) and Ask.com are still

            PLEASE SEE THE APPENDIX TO THIS REPORT ON PAGES 14‐17 FOR IMPORTANT DISCLOSURES, REG AC 
            ANALYST CERTIFICATION AND DISCLAIMERS 
            Brian Bolan                  Bolan@willcap.com Trading NY 800-924-1511, CT 800-688-6349
WILLIAMS CAPITAL RESEARCH                            PAGE 2                                  December 17, 2010


relevant in terms of market share, but few others have been able to make or sustain an impact in the industry.
Search sites, unlike popular portals, have maintained their position as starting points for users. Yahoo! made
being the starting point for users a key strategic initiative, demonstrating the importance of being first. Whether
users prefer content on the starting page or a search box, it is clear that search will continue to be a dominate
platform for the internet.

Taking the search engine beyond the search home page has been the goal of the major search companies over the
last several years. They have utilized the ability to quickly index a page, scan it for keywords or phrases and
deliver highly targeted ads that match the content of the specific page. The best example of this was in the social
networking space as Google outbid competitors to deliver ads to one of the most trafficked sites, the News Corp-
owned MySpace. The deal focused on better monetizing the massive traffic on the site and led its major
competitor to enlist the help of Microsoft to serve its ads. The difference in the two deals was a $15 billion
valuation that was given to Facebook by Microsoft via a minority stake investment. With the investment,
Microsoft became the ad serving agent for Facebook, the popular social networking site.

A watershed moment came during the 4Q07 Google earnings conference call. The company noted that it was
facing challenges in monetizing the traffic that MySpace was generating. Microsoft sensed weakness and moved
to attempt to level the playing field in the search space by making a $46B bid for Yahoo!. An arduous fight
ensued as Yahoo! was determined to remain independent and struck an accord with Google in an effort to escape
Microsoft’s bear hug. Yahoo! successfully thwarted the takeover attempt; however, it continues to see its market
share decrease. Microsoft has abandoned its quest for a complete purchase of Yahoo! and has instead moved to
join forces with Yahoo! and combine the search efforts of Bing with Yahoo! to better compete with Google.

Yahoo! stayed out of the competition for server ads to the major social networks, with Microsoft investing in and
serving ads for Facebook, while Google still delivers ads for MySpace. Display rates came down significantly in
the economic downturn as ad buying mainstays of Auto’s and Finance verticals both suffered more than most.
Rates have returned as ad budgets for online brand buys have increased in 2010.

Where the growth will come from

 Much has already been said about the shift of ad budgets to online from offline. We believe this trend will
continue; but just as that trend continues to accelerate, another segment is at its nascent stage. Mobile phones
have become more sophisticated in the last few years, with BlackBerry maker Research in Motion still leading the
way in terms of market share. What was a battle between BlackBerry and Palm has turned into a race with
several competitors, the most notable of which is Apple’s (Nasdaq: AAPL - $321.25, not rated) iPhone. The rich
content of the web has moved from the PC to the smartphone. The potential to target consumers via tracking
movement and purchases subsidized via advertising could significantly change how commerce is enacted.

 As new technology comes to market, we believe that consumers will embrace smartphones and their features. It
may be some time before consumers are willing to allow for web-based payments to take share from credit cards,
but it is something that makes sense over the long term. This bodes well for the platform that is the most robust
which, by definition, will allow for the most applications.

We believe that Yahoo! will take an agnostic approach to the two key platforms of Android and Apple and
develop applications for both. We would note that the Yahoo Search app for iPhone with its drawing features is a
strong competitor in the market.


Brian Bolan     Bolan@willcap.com         Trading NY 800-924-1511,           CT 800-688-6349
WILLIAMS CAPITAL RESEARCH                               PAGE 3                                December 17, 2010


Market Share

Over the last several years, market share has been measured by several companies that purchase the “clickstream”
of users from internet service providers (ISP). This raw data is analyzed to determine how many searches were
made in a specific time frame (generally one month) and where they were made. This data is not fully endorsed
by the search companies, but the trends are usually in agreement with the search companies’ internal logs.

Google is the dominant search company with almost 70% of the worldwide market as tabulated by comScore.
We believe that Google’s market share of search will continue to grow and will approach the 75% level in the
summer of 2011. Yahoo!, on the other hand, has seen its share of the US and worldwide markets continue to fall.
We believe that this trend will continue despite the search partnership the company entered into with Bing. With
only a year under Bing’s belt it is hard to compare it to Yahoo! and Google, but it is a significant change from the
MSN search stats Microsoft used to deliver. Early results for March indicate that Yahoo! gained share from both
Google and Bing, and showed some signs of stabilization in what had been a year-long pattern of market share
losses for Yahoo!.

Going forward, we believe that search market share numbers will focus mostly on worldwide measurements as
opposed to domestic vs. international. That being said, Google dominance is unquestioned worldwide, although
there are smaller segments of the world where Google is not the leader. Yandex is the leader in Russia, but this
market is small compared to the US.

Exhibit 1


Source: Company reports and Williams Capital Research

Seasonality

There is an issue of seasonality that affects internet usage and internet companies. The general consensus is that
usage slows during the summer months as the weather draws more people to outdoor activities. The later part of
the third quarter is buoyed by back to school when traffic increases from academic sources. The fourth quarter is
traditionally the strongest quarter as the combination of the educational segment and the searches that arise from
the holiday shopping and travel season increase traffic.


Brian Bolan     Bolan@willcap.com          Trading NY 800-924-1511,           CT 800-688-6349
WILLIAMS CAPITAL RESEARCH                            PAGE 4                                 December 17, 2010


Comparable Companies

Yahoo! faces competition from numerous sources, and while it produces its own content, it partners with
newspapers and other media partners in attempts to drive traffic. The company relies on both the search engine
and its owned media properties for a majority of its revenue. The search deal with Microsoft makes that
comparable a moot point in terms of search, as the two search engines will likely begin producing the exact same
results. In essence the same search will produce the same results at Bing as well as the Yahoo! search. We
believe this will, over time, shift market share from Yahoo! search to Bing.

Google (NASDAQ: GOOG - $591.71, rated Outperform) - Google dominates the search market with
approximately 65% of US market share and has a sizeable digital footprint. Through its acquisition of
DoubleClick, it also participates in the display business placing ads on properties the company owns as well as
for Network partners. Google has a substantial balance sheet and the ability to make large acquisitions or
develop costly operations from scratch.

Aol. (NYSE: AOL - $321.25, not rated) - After a spin out from Time Warner, Aol. is now a primary competitor
with Yahoo! in the highly competitive fields of display advertising, email and instant messaging. Aol. search is
enhanced by Google and maintains roughly 3-4% of the domestic search market. Lately, the company has
focused more on producing localized content on which it runs display advertisements.

Microsoft (NASDAQ: MSFT- $27.99, not rated) - Despite being a key partner in search, Microsoft also offers
an ad network to publishers to reach mobile, content (display) and search platforms. Although the online division
of Microsoft is not a significant portion of total revenue contribution, we believe that the company will continue
to compete in the space.

Baidu (NASDAQ: BIDU - $98.31, not rated) - The Chinese search engine is a competitor in the international
space. Based in China, Baidu has seen its stock soar since its IPO and has dominated the Chinese language
search market. Though most of its appeal has been its MP3 search and downloads, Biadu competes with
Yahoo!’s Asian properties

Yandex (Private Company) – Yandex is a Russian search engine that has 19 million daily users and is growing
fast in Eastern Europe. The company’s market share in Russia increased from 56% in January 2009 to 62% by
February of 2010 with page-views of 10 billion in December 2009. Google had 21.8% market share in Russia in
February 2010.


Brian Bolan     Bolan@willcap.com         Trading NY 800-924-1511,          CT 800-688-6349
WILLIAMS CAPITAL RESEARCH                             PAGE 5                                December 17, 2010


Exhibit 2


Source: Google Finance, recent prices


Company Background

Yahoo!, which recently turned 15 years old, has seen a dramatic series of events that most parents of
teenagers understand. From birth to bubble to bust to buyout, this company has gone through a lot and
continues to be a leader in the internet. To get a better understanding of the company we are looking at
each unit and how it has performed over the last few years.

Exhibit 3


Source: Company reports & Williams Capital Research


Search

Owned and Operated (O&O) Search has been a source of disappointment since its revenue peaked back in 3Q08,
as the broader economy began to turn. The company struggled the rest of the year but entered 2010 with more
disappointments in search.


Brian Bolan      Bolan@willcap.com         Trading NY 800-924-1511,         CT 800-688-6349
WILLIAMS CAPITAL RESEARCH                             PAGE 6                                December 17, 2010


Exhibit 4


Source: Company reports & Williams Capital Research

We believe that the search deal with Microsoft will ultimately improve margins as the company continues to
focus of driving more display share.

Display

The Display business is best characterized by brand-building advertisements. These command lower rates than
search-based ad rates as search is more a “point of purchase” style advertisement. With the economy recovering,
display rates are likely to move higher off of what are likely artificially low rates over the past few quarters.
With more devices coming to market (iPad, Slate, and smartphones) we believe that total impressions will grow
in the remainder of the year despite the fact that Yahoo! saw 0% pageview growth in 1Q10.

Exhibit 5


Source: Company reports & Williams Capital Research


Affiliate
Yahoo! noted on its 1Q10 conference call that it is working to deepen its relationship with significant partners,
and we believe that its continued focus on better ad serving technology will pay off in the form of higher revenue


Brian Bolan     Bolan@willcap.com          Trading NY 800-924-1511,         CT 800-688-6349
WILLIAMS CAPITAL RESEARCH                             PAGE 7                               December 17, 2010


from affiliates. With Yahoo!’s reach of 600 million audience members, it remains a high priority for most
advertisers.

Exhibit 6


Source: Company reports & Williams Capital Research

Listings and Services

The decrease in revenues in Listings and Services is likely to continue as Yahoo! sold HotJobs to Monster.com in
February 2010. This change could have affected the listings at HotJobs in the quarter outside of the pre-existing
contracts.

Exhibit 7


Source: Company reports & Williams Capital Research


Fees

 Fees revenue declined 11.7% sequentially in 1Q10 as broadband partnership shifted to advertising from a fee-
based structure. At the end of CY08, Yahoo! had 19 million fee-paying customers and by the end of the
following year that number stood at 9.7 million. We expect to see further decreases in the fee revenue line item
over the course of the year.


Brian Bolan     Bolan@willcap.com          Trading NY 800-924-1511,        CT 800-688-6349
WILLIAMS CAPITAL RESEARCH                             PAGE 8                                 December 17, 2010


Exhibit 8


Source: Company reports & Williams Capital Research


Acquisitions

 Yahoo! has a history of acquiring companies, but lately the track record has been less than stellar. The Company
proved that it wasn’t afraid of large scale acquisitions when it purchased Overture or the $5 billion price tag it
paid for the Mark Cuban Broadcast.com company. Since that time the company continued eating up smaller
companies, some of which eventually dissolved and some that failed to reach their pre-acquisition hype.

Yahoo! bought a couple of ad exchanges over the last two years including RightMedia and Blue Lithium. The
move brought a new model (exchange) to Yahoo! but we have seen little evidence that the marketplace is about to
shift the way it purchases ads.

We believe the takeaway from the last two acquisitions (Maktoob.com in August 2009 and citizensports.com in
March 2010) shows the company will continue to add to its platform despite its currency (stock) being weaker
than it has been over the last few years. That said, we do not believe that any significant acquisitions are in the
works for Yahoo!.

Management

Venture Capitalists have a saying about management, ‘the jockey is just as important as the horse.’ This means
that management can make or break even the best of ideas. That seemed to be the case over the last several years
with Yahoo!. Terry Semel, a former CEO of Yahoo! wanted to position the company as close as he could to
Hollywood in order to develop media relations and advertising partnerships. One too many misses of earnings
led him to leave the position and he was replaced by co-founder Jerry Yang.

Jerry Yang’s tenure as CEO was far shorter, as Microsoft attempted to acquire Yahoo! but Yang did not want to
see the company he founded be sold to what many in the technology industry consider to be the new age “Big
Brother”.

The hiring of Carol Bartz was a surprise move going with more veteran leadership that featured more crass out
takes. At the start of her tenure her energy and shakeup were welcome changes, but a brain drain of talent leaving
for start-ups and competitors has made us question the decision. A few months ago, Bartz was on a media blitz


Brian Bolan     Bolan@willcap.com          Trading NY 800-924-1511,          CT 800-688-6349
WILLIAMS CAPITAL RESEARCH                             PAGE 9                                  December 17, 2010


after completing a year as CEO but still had troubles in describing what Yahoo! does and what the plan for the
future was. Our concerns with top management are that Yahoo! may be trying to be too much to too many
instead of focusing on core competencies.

Carol Bartz Ms. Bartz has served as Chief Executive Officer and as a member of the Board of Directors since
January 2009. Ms. Bartz served as the Executive Chairman of the Board of Autodesk, Inc., a computer-aided
design software provider, from May 2006 to February 2009, as Chairman, President and Chief Executive Officer
of Autodesk from April 1992 to April 2006 and as a director of Autodesk from April 1992 to February 2009.

Tim Morse, Prior to joining Yahoo!, Morse was the CFO of Altera Corporation, a semiconductor company
specializing in programmable logic devices for communications, industrial, and consumer applications, where he
established scalable, cost-effective processes and controls. He previously served as the CFO and general manager
of business development for General Electric Plastics.

The recent loss of Hilary Schneider speaks to the continuous turmoil at the top as Yahoo! has struggled with
giving its vision clarity. We expect Yahoo! to begin to look at poaching talent from companies like AOL and
Google as it continues to tweak its value proposition to the market. Much as being a one stop shop in the
financial sector did not work, we do not believe that advertisers or consumers are looking for one place, one site
to handle all of their digital needs. The recent layoffs of 600-700 employees will also work against the general
morale of the people that remain at Yahoo!

Financial Statement Analysis

Yahoo!’s Income Statement showed year over year top line growth for consecutive quarters the first time in
several quarters with Display increasing 20% year over year in 1Q10 and 19% year over year in 2Q10. Affiliates
also contributed to the growth but it was the only other line item to show year over year growth. We anticipate
year over year growth of 4% in the remaining quarter of 2010.

Yahoo! will have a complex year financially with the Microsoft search deal providing some cost savings for the
company and potentially lowering expected R&D costs towards the end of the year. With less of a focus on
search, the company will likely be looking to display and affiliates to pick up any revenue shortfall. We expect
margins, on a whole to begin to improve over the next several quarters.

Balance Sheet

At the end of 2Q10, Yahoo! had more than $3.8 billion in cash and equivalents and marketable securities, down
from $4.14 billion following the first quarter of 2010. During the most recent quarter, the company repurchased
32 million shares for $496 million. On June 24 a new buyback of $3 billion was authorized, and we expect the
company to continue to repurchase shares.

Yahoo! does not have any long term debt at this time. We do not expect Yahoo! to take on any long term debt in
the foreseeable future.

Asian Assets

The company holds a significant interest in two Asian internet properties, Yahoo! Japan and Alibaba Group.
These investments have caused a great deal of consternation among investors and the press as calls for
monetization have not been answered. Given the tax implications, lack of liquidity, and general lack of premium


Brian Bolan     Bolan@willcap.com          Trading NY 800-924-1511,           CT 800-688-6349
WILLIAMS CAPITAL RESEARCH                            PAGE 10                                  December 17, 2010


buyers, we expect Yahoo! to continue to hold these assets for the foreseeable future. Yahoo! holds approximately
35% ownership of Yahoo! Japan and a 44% ownership of the Alibaba Group.

Over the last few years there has been a call to monetize these assets and or call attention so that the market will
reflect the value of these assets in the Yahoo! share price. We believe that assets hold value, but investors should
be more concerned with the day-to-day operations of the company instead of looking for a monetization event.
Should the company move to monetize any of the Asian assets, it may be interpreted as sign of weakness and the
near term financial gain may be undermined by longer term pressure on the stock.

Financial Outlook

The company has noted that its current goals are to increase margins, and the Microsoft Search deal will go a long
way to helping that happen. We expect that better rates for the display business combined with better audience
targeting will result in better performance for Yahoo! in 2010.

We are not overly aggressive in terms of our estimates for Yahoo! as we are skeptical that the company will
substantially improve its search share. At the same time, we believe that margins should expand as costs move
lower and revenue improves slightly.


Recommendation and Valuation

We are initiating coverage of Yahoo! with a Market Perform rating and a one-year price target of $18. Over the
last year, we have seen severe multiple contraction as revenue deceleration has taken its toll on the valuation. We
see potential for improvements for the display business and increases in operating margin due to the Microsoft
deal to help the financial outlook for 2011. Our price target is derived off of a 21x multiple of our 2011 earnings
estimate.

Having been a member of the “Nifty-Fifty” (50x forward earnings) in the past, Yahoo! has seen its valuation
readjusted after the Microsoft offer and subsequent search deal. We believe that Wall Street discounts the Asian
assets slightly more than the approximate $8.3 billion value they have as a sale or greater monetization is
unlikely. The weak cash position compared to two of its main rivals is also an aspect that we believe has to factor
into overall valuation.

Our price target of $18 per share is derived by a multiple of 21x our 2011 earnings estimate of $0.84.


Investment Risks

If the company experiences any or all of the following risk factors, as well as others, the company’s stock price
may be affected.

 Advertisers reduce internet budgets. Advertising is the source of the majority of Yahoo!’s revenue. Should
    advertisers lose faith in the internet as a medium for advertisements Yahoo! would suffer a significant
    revenue slowdown.

 A better advertising platform is developed for internet advertising.            Search has been the dominant


Brian Bolan     Bolan@willcap.com          Trading NY 800-924-1511,          CT 800-688-6349
WILLIAMS CAPITAL RESEARCH                             PAGE 11                              December 17, 2010


      application on the internet for the last ten years. Should another application become more acceptable than
      search, advertisers could move budgets from search to that platform.

 Competition is intense and moves quickly. Yahoo! faces intense competition from Google and AOL among
    others. Should a competitor develop a more efficient and relevant search engine, a better email platform,
    or a more compelling display platform, Yahoo! would be severely impacted.

 Future growth is predicated on success of mobile. Many of our assumptions of growth are based on the
     future success of all things mobile. Should Yahoo! fail to adapt to a changing environment that focuses on
     mobile delivery of search and display ads, the company would face significant challenges.

 Loss of key management. Turnover at Yahoo! has been significant concern for some time and continues to
     remain a challenge to top management. Should this trend continue the talent drain will result in an
     inability to properly serve clients which would put future revenues at risk.


Exhibit 9


Source: Company reports & Williams Capital Research


Brian Bolan     Bolan@willcap.com          Trading NY 800-924-1511,        CT 800-688-6349
WILLIAMS CAPITAL RESEARCH                             PAGE 12                     December 17, 2010


                                   Yahoo! 3Q10 Income Statement Analysis

Exhibit 10


Source: Company reports & Williams Capital Research


Brian Bolan     Bolan@willcap.com          Trading NY 800-924-1511,   CT 800-688-6349
WILLIAMS CAPITAL RESEARCH                             PAGE 13                     December 17, 2010


                                           Yahoo! Income Statement

Exhibit 11


Source: Company reports & Williams Capital Research


Brian Bolan     Bolan@willcap.com          Trading NY 800-924-1511,   CT 800-688-6349
WILLIAMS CAPITAL RESEARCH                                PAGE 14                                  December 17, 2010


Appendix -
Exhibit 12 Two Year Price Chart

 Yahoo Inc. (YHOO)               Price Perform ance Chart (Rating and Target)
 14-Dec-2007 to 15-Dec-2010 (Daily)
                              Ratings: O=Outperform; P=Perform; U=Underperform
                                                                                 35

                                                                                 30

                                                                      P $18.00   25

                                                                                 20

                                                                                 15

                                                                                 10

                                                                                 5
1/08   4/08   7/08 10/08 1/09   4/09   7/09 10/09 1/10   4/10   7/10 10/10
       Yahoo! Inc.
                                                             Source: FactSet Prices


Prices as of December 16th, 2010.

                                             ANALYST CERTIFICATION

I hereby certify that the views expressed in the foregoing research report accurately reflect my
personal any of the subject companies mentioned in this report. I further certify that no part of
my compensation was, is, or will be directly, or indirectly, related to the specific
recommendations or views contained in this research report.

Financial Interests: Neither I, Brian Bolan, nor a member of my household owns securities
in any of the subject companies mentioned in this research report. Neither I, nor a member of
my household is an officer, director, or advisory board member of the issuer or has another
significant affiliation with the subject company. I do not know or have reason to know at the
time of this publication of any other material conflict of interest.

By: Brian Bolan

                        Williams Capital Research DISCLOSURE INFORMATION

                     ADDITIONAL INFORMATION IS AVAILABLE UPON REQUEST

Analyst Compensation: The author's compensation is based upon the value directly or
indirectly attributed to the research services by Williams Capital institutional brokerage
clients. The author of this report is compensated based on the performance of the firm, and
has not received any compensation in the past 12 months from any of the subject companies
mentioned in this report. The performance of the firm is driven by its secondary trading
revenues, investment banking revenues, and asset management revenues.


Brian Bolan          Bolan@willcap.com        Trading NY 800-924-1511,                CT 800-688-6349
WILLIAMS CAPITAL RESEARCH                    PAGE 15                           December 17, 2010


Williams Capital Group does not act as a market-maker.

Williams Capital Group does act as a block positioner.

               WILLIAMS CAPITAL RESEARCH STOCK RATING KEY:

Outperform: (BUY) In the analyst's opinion, the stock will outperform the sector by 5%
over the next 12 months.

Perform: (HOLD) In the analyst's opinion, the stock or sector will be in line with the sector
over the next 12 months.

Underperform: (SELL) In the analyst's opinion, the stock or sector will underperform the
sector by 5% over the next 12 months.


                                        DISCLAIMER

 The opinions, forecasts, and recommendations contained in this report are those of the analyst
preparing the report and are based upon the information available to them as of the date of the
report. The analysts are basing their opinions upon information they have received from
sources they believe to be accurate and reliable and the completeness and/or accuracy is
neither implied nor guaranteed. The opinions and recommendations are subject to change
without notice.

Williams Capital Research has no obligation to continue to provide this institutional
research product and no such obligation is implied or guaranteed. The report is provided to
the Institutional clients of Williams Capital Research for informational purposes only and
is not an offer or a solicitation for the purchase or sale of any financial instrument. The firm
does not make a market in the security of the subject company(ies) or affiliated securities. The
firm or its employees may buy or sell the subject company’s(ies’) securities or derivatives that
is/are the subject(s) of this report. And the firm from time to time may buy or sell the subject
company’s fixed income securities from customers on a principal basis. Past performance is
not an indication of future results. Calculations of price targets are based on a combination of
one or more methodologies generally accepted among financial analysts, including but not
limited to, analysis of multiples and/or discounted cash flows (whether whole or in part), or
any other method which may be applied.

Although the statements of fact in this report have been obtained from and are based upon
outside sources that the firm believes to be reliable, the firm does not guarantee the accuracy or
completeness of material contained in this report. Any such estimates or forecasts contained in
this report may not be met. Past performance is not an indication of future results. Calculations


Brian Bolan   Bolan@willcap.com     Trading NY 800-924-1511,     CT 800-688-6349
WILLIAMS CAPITAL RESEARCH                      PAGE 16                             December 17, 2010


of price targets are based on a combination of one or more methodologies generally accepted
among financial analysts, including but not limited to, analysis of multiples and/or discounted
cash flows (whether whole or in part), or any other method which may be applied. Rating,
target price and price history information on the company in this report is available upon
request.


                          ADDITIONAL DISCLOSURE INFORMATION:

 The Williams Capital Group, L.P. or its Affiliates do and seek compensation for
investment banking services from the subject company(ies) within the next 3 months. As a
result, investors should be aware that the firm may have a conflict of interest that
could affect the objectivity of this report. Investors should consider this report as
only a single factor in making their investment decision. Additional information
is available upon request.

 “Investment Banking Clients” is defined as companies in respect of which The Williams
Capital Group, L.P. (the “firm”) or its affiliates have received or are entitled to receive
compensation for investment banking services in connection with transactions that were
publicly announced in the past 12 months.
Distribution of Equity Research Ratings as of: December 16, 2010

                                        Outperform       Perform          Sell

All Research Coverage:                      75%            25%             0%
Universe of IBC:                             0%             0%             0%
Consumer Staples:                           50%            50%             0%
Consumer Staples - IBC:                      0%             0%             0%


Company Ratings History
                                                              Prior      Current            Target
Company Name          Ticker   Date          Action           Rating     Rating     Price    Price
Yahoo!                YHOO 16-Dec-10 Initiation of Coverage None         Perform    $16.51 $18.00


Brian Bolan   Bolan@willcap.com       Trading NY 800-924-1511,         CT 800-688-6349
WILLIAMS CAPITAL RESEARCH                        PAGE 17                              December 17, 2010


Valuation

We are initiating coverage of Yahoo! with a Market Perform rating and a one-year price target of $18.
Over the last year, we have seen severe multiple contraction as revenue deceleration has taken its toll on
the valuation. We see potential for improvements for the display business and increases in operating
margin due to the Microsoft deal to help the financial outlook for 2011. Our price target is derived off of
a 21x multiple of our 2011 earnings estimate.

Having been a member of the “Nifty-Fifty”(50x forward earnings) in the past, Yahoo! has seen its
valuation readjusted after the Microsoft offer and subsequent search deal. We believe that Wall Street
discounts the Asian assets slightly more than the approximate $8.3 billion value they have as a sale or
greater monetization is unlikely. The weak cash position compared to two of its main rivals is also an
aspect that we believe has to factor into overall valuation.

Our price target of $18 per share is derived by a multiple of 21x our 2011 earnings estimate of $0.84.


Risks

If the company experiences any or all of the following risk factors, as well as others, the company’s
stock price may be affected.

        1. Advertisers reduce internet budgets. Advertising is the source of the majority of
           Yahoo!’s revenue. Should advertisers lose faith in the internet as a medium for
           advertisements Yahoo! would suffer a significant revenue slowdown.
        2. A better advertising platform is developed for internet advertising. Search has
           been the dominant application on the internet for the last ten years. Should another
           application become more acceptable than search, advertisers could move budgets from
           search to that platform.
        3. Competition is intense and moves quickly. Yahoo! faces intense competition from
           Google and AOL among others. Should a competitor develop a more efficient and relevant
           search engine, a better email platform, or a more compelling display platform, Yahoo!
           would be severely impacted.
        4. Future growth is predicated on success of mobile. Many of our assumptions of
           growth are based on the future success of all things mobile. Should Yahoo! fail to adapt to a
           changing environment that focuses on mobile delivery of search and display ads, the
           company would face significant challenges.
        5. Loss of key management. Turnover at Yahoo! has been significant concern for some
           time and continues to remain a challenge to top management. Should this trend continue
           the talent drain will result in an inability to properly serve clients which would put future
           revenues at risk.


To receive any additional information upon which this report is based, please contact the following
individuals or write to Research Production Department, Williams Capital Research, 650 Fifth Ave.,
New York, NY 10019 -

    Suling Lew, Head of Institutional Sales            or         Jack Murphy, Director of Research
                 212-373-4243                                           203-659-6007


Brian Bolan    Bolan@willcap.com       Trading NY 800-924-1511,         CT 800-688-6349

Contenu connexe

Tendances

Analysis report espn_jd_lyell
Analysis report espn_jd_lyellAnalysis report espn_jd_lyell
Analysis report espn_jd_lyellJamesLyell1
 
HAND FUN! Feb 15
HAND FUN! Feb 15HAND FUN! Feb 15
HAND FUN! Feb 15MBNBet
 
E bay 2011analystday_final2
E bay 2011analystday_final2E bay 2011analystday_final2
E bay 2011analystday_final2Marketingfacts
 
The Jeff Bezos Personal Empire
The Jeff Bezos Personal EmpireThe Jeff Bezos Personal Empire
The Jeff Bezos Personal EmpireStacey Troup
 
10 trends that are shaping the world of mobile gaming
10 trends that are shaping the world of mobile gaming10 trends that are shaping the world of mobile gaming
10 trends that are shaping the world of mobile gamingPocket Gamer Biz
 

Tendances (6)

Analysis report espn_jd_lyell
Analysis report espn_jd_lyellAnalysis report espn_jd_lyell
Analysis report espn_jd_lyell
 
HAND FUN! Feb 15
HAND FUN! Feb 15HAND FUN! Feb 15
HAND FUN! Feb 15
 
E bay 2011analystday_final2
E bay 2011analystday_final2E bay 2011analystday_final2
E bay 2011analystday_final2
 
The Jeff Bezos Personal Empire
The Jeff Bezos Personal EmpireThe Jeff Bezos Personal Empire
The Jeff Bezos Personal Empire
 
Echelon Magazine Digital Media Kit
Echelon Magazine Digital Media KitEchelon Magazine Digital Media Kit
Echelon Magazine Digital Media Kit
 
10 trends that are shaping the world of mobile gaming
10 trends that are shaping the world of mobile gaming10 trends that are shaping the world of mobile gaming
10 trends that are shaping the world of mobile gaming
 

En vedette

Yhoo downgrade 1 26-11 final
Yhoo downgrade 1 26-11 finalYhoo downgrade 1 26-11 final
Yhoo downgrade 1 26-11 finalBrian Bolan
 
Expe earnings 4 q10
Expe earnings 4 q10Expe earnings 4 q10
Expe earnings 4 q10Brian Bolan
 
Goog 1 q11_earnings_review
Goog 1 q11_earnings_reviewGoog 1 q11_earnings_review
Goog 1 q11_earnings_reviewBrian Bolan
 
Story Telling
Story TellingStory Telling
Story TellingDCYEAR4
 
Goog 4 Q 2010 Earnings Bolan 1 21 11 Final
Goog 4 Q 2010 Earnings Bolan 1 21 11 FinalGoog 4 Q 2010 Earnings Bolan 1 21 11 Final
Goog 4 Q 2010 Earnings Bolan 1 21 11 FinalBrian Bolan
 
Mapa conceptual sobre Gerencia de Proyectos y Ciclo de Vida de un Proyecto
Mapa conceptual sobre Gerencia de Proyectos y Ciclo de Vida de un ProyectoMapa conceptual sobre Gerencia de Proyectos y Ciclo de Vida de un Proyecto
Mapa conceptual sobre Gerencia de Proyectos y Ciclo de Vida de un ProyectoJose Luis Trespalacios Mulett
 
Clp 4 dby 2012
Clp 4 dby 2012Clp 4 dby 2012
Clp 4 dby 2012DCYEAR4
 

En vedette (9)

Lake House 10
Lake House 10Lake House 10
Lake House 10
 
Cops
CopsCops
Cops
 
Yhoo downgrade 1 26-11 final
Yhoo downgrade 1 26-11 finalYhoo downgrade 1 26-11 final
Yhoo downgrade 1 26-11 final
 
Expe earnings 4 q10
Expe earnings 4 q10Expe earnings 4 q10
Expe earnings 4 q10
 
Goog 1 q11_earnings_review
Goog 1 q11_earnings_reviewGoog 1 q11_earnings_review
Goog 1 q11_earnings_review
 
Story Telling
Story TellingStory Telling
Story Telling
 
Goog 4 Q 2010 Earnings Bolan 1 21 11 Final
Goog 4 Q 2010 Earnings Bolan 1 21 11 FinalGoog 4 Q 2010 Earnings Bolan 1 21 11 Final
Goog 4 Q 2010 Earnings Bolan 1 21 11 Final
 
Mapa conceptual sobre Gerencia de Proyectos y Ciclo de Vida de un Proyecto
Mapa conceptual sobre Gerencia de Proyectos y Ciclo de Vida de un ProyectoMapa conceptual sobre Gerencia de Proyectos y Ciclo de Vida de un Proyecto
Mapa conceptual sobre Gerencia de Proyectos y Ciclo de Vida de un Proyecto
 
Clp 4 dby 2012
Clp 4 dby 2012Clp 4 dby 2012
Clp 4 dby 2012
 

Similaire à Yahoo Inc. (YHOO) Initiated with Perform Rating on Equity Research

Stifel Internet Research Overview
Stifel Internet Research OverviewStifel Internet Research Overview
Stifel Internet Research OverviewScott Devitt
 
9 10 Locm 091110 Local Com Corporate Presentation Final8
9 10 Locm 091110 Local Com Corporate Presentation Final89 10 Locm 091110 Local Com Corporate Presentation Final8
9 10 Locm 091110 Local Com Corporate Presentation Final8Ben Allen
 
Goog 1 q11_earnings_preview
Goog 1 q11_earnings_previewGoog 1 q11_earnings_preview
Goog 1 q11_earnings_previewBrian Bolan
 
Quepasa Corporation (NYSE Amex: QPSA) Investor Presentation Winter 2011
Quepasa Corporation (NYSE Amex: QPSA) Investor Presentation Winter 2011Quepasa Corporation (NYSE Amex: QPSA) Investor Presentation Winter 2011
Quepasa Corporation (NYSE Amex: QPSA) Investor Presentation Winter 2011MeetMe, Inc
 
Monthly portfolio (november)
Monthly portfolio (november)Monthly portfolio (november)
Monthly portfolio (november)Haris Memon
 
XWEBSEO Presentation
XWEBSEO PresentationXWEBSEO Presentation
XWEBSEO PresentationAvi Davis
 
Top 10 Marketing Predictions Final
Top 10 Marketing Predictions FinalTop 10 Marketing Predictions Final
Top 10 Marketing Predictions FinalHoward Greenstein
 
Funding in the time of Corona Virus
Funding in the time of Corona VirusFunding in the time of Corona Virus
Funding in the time of Corona VirusMark Suster
 
2015_03_24 Final Research Report - Zynga (FINAL COPY) PDF
2015_03_24 Final Research Report - Zynga (FINAL COPY) PDF2015_03_24 Final Research Report - Zynga (FINAL COPY) PDF
2015_03_24 Final Research Report - Zynga (FINAL COPY) PDFCourtney Fenwick
 
GoFish Network
GoFish NetworkGoFish Network
GoFish NetworkGoFish
 
GoFish Network
GoFish NetworkGoFish Network
GoFish NetworkGoFish
 
Marketing charts-data-q4-2010
Marketing charts-data-q4-2010Marketing charts-data-q4-2010
Marketing charts-data-q4-2010Marketingfacts
 
The "Unproductive Bubble:" Unprofitable startups, small markets for new digit...
The "Unproductive Bubble:" Unprofitable startups, small markets for new digit...The "Unproductive Bubble:" Unprofitable startups, small markets for new digit...
The "Unproductive Bubble:" Unprofitable startups, small markets for new digit...Jeffrey Funk
 
20130723 game industry trend
20130723 game industry trend20130723 game industry trend
20130723 game industry trendChristina Hsu
 
Linda Gridley's 2011 Perspective on Market Leadership in Today’s Market
Linda Gridley's 2011 Perspective on Market Leadership in Today’s MarketLinda Gridley's 2011 Perspective on Market Leadership in Today’s Market
Linda Gridley's 2011 Perspective on Market Leadership in Today’s MarketLinda Gridley
 
State of Venture, Technology
State of Venture, Technology State of Venture, Technology
State of Venture, Technology F-Prime Capital
 

Similaire à Yahoo Inc. (YHOO) Initiated with Perform Rating on Equity Research (20)

Stifel Internet Research Overview
Stifel Internet Research OverviewStifel Internet Research Overview
Stifel Internet Research Overview
 
9 10 Locm 091110 Local Com Corporate Presentation Final8
9 10 Locm 091110 Local Com Corporate Presentation Final89 10 Locm 091110 Local Com Corporate Presentation Final8
9 10 Locm 091110 Local Com Corporate Presentation Final8
 
Goog 1 q11_earnings_preview
Goog 1 q11_earnings_previewGoog 1 q11_earnings_preview
Goog 1 q11_earnings_preview
 
Quepasa Corporation (NYSE Amex: QPSA) Investor Presentation Winter 2011
Quepasa Corporation (NYSE Amex: QPSA) Investor Presentation Winter 2011Quepasa Corporation (NYSE Amex: QPSA) Investor Presentation Winter 2011
Quepasa Corporation (NYSE Amex: QPSA) Investor Presentation Winter 2011
 
Monthly portfolio (november)
Monthly portfolio (november)Monthly portfolio (november)
Monthly portfolio (november)
 
XWEBSEO Presentation
XWEBSEO PresentationXWEBSEO Presentation
XWEBSEO Presentation
 
Top 10 Marketing Predictions Final
Top 10 Marketing Predictions FinalTop 10 Marketing Predictions Final
Top 10 Marketing Predictions Final
 
Funding in the time of Corona Virus
Funding in the time of Corona VirusFunding in the time of Corona Virus
Funding in the time of Corona Virus
 
2015_03_24 Final Research Report - Zynga (FINAL COPY) PDF
2015_03_24 Final Research Report - Zynga (FINAL COPY) PDF2015_03_24 Final Research Report - Zynga (FINAL COPY) PDF
2015_03_24 Final Research Report - Zynga (FINAL COPY) PDF
 
GoFish Network
GoFish NetworkGoFish Network
GoFish Network
 
GoFish Network
GoFish NetworkGoFish Network
GoFish Network
 
Marketing charts-data-q4-2010
Marketing charts-data-q4-2010Marketing charts-data-q4-2010
Marketing charts-data-q4-2010
 
Qihoo
QihooQihoo
Qihoo
 
24485
2448524485
24485
 
The "Unproductive Bubble:" Unprofitable startups, small markets for new digit...
The "Unproductive Bubble:" Unprofitable startups, small markets for new digit...The "Unproductive Bubble:" Unprofitable startups, small markets for new digit...
The "Unproductive Bubble:" Unprofitable startups, small markets for new digit...
 
Facebook Sales 2012: Ads $5B!
Facebook Sales 2012: Ads $5B!Facebook Sales 2012: Ads $5B!
Facebook Sales 2012: Ads $5B!
 
20130723 game industry trend
20130723 game industry trend20130723 game industry trend
20130723 game industry trend
 
Linda Gridley's 2011 Perspective on Market Leadership in Today’s Market
Linda Gridley's 2011 Perspective on Market Leadership in Today’s MarketLinda Gridley's 2011 Perspective on Market Leadership in Today’s Market
Linda Gridley's 2011 Perspective on Market Leadership in Today’s Market
 
State of Venture, Technology
State of Venture, Technology State of Venture, Technology
State of Venture, Technology
 
TREND INVESTMENT
TREND INVESTMENT TREND INVESTMENT
TREND INVESTMENT
 

Dernier

The resilient U.S. late-cycle expansion contributed to a stalling pattern in ...
The resilient U.S. late-cycle expansion contributed to a stalling pattern in ...The resilient U.S. late-cycle expansion contributed to a stalling pattern in ...
The resilient U.S. late-cycle expansion contributed to a stalling pattern in ...Kumaran637735
 
Basic Accountants in|TaxlinkConcept.pdf
Basic  Accountants in|TaxlinkConcept.pdfBasic  Accountants in|TaxlinkConcept.pdf
Basic Accountants in|TaxlinkConcept.pdftaxlinkcpa
 
Corporate Presentation Probe April 2024.pdf
Corporate Presentation Probe April 2024.pdfCorporate Presentation Probe April 2024.pdf
Corporate Presentation Probe April 2024.pdfProbe Gold
 
Collective Mining | Corporate Presentation - April 2024
Collective Mining | Corporate Presentation - April 2024Collective Mining | Corporate Presentation - April 2024
Collective Mining | Corporate Presentation - April 2024CollectiveMining1
 
Corporate Presentation Probe April 2024.pdf
Corporate Presentation Probe April 2024.pdfCorporate Presentation Probe April 2024.pdf
Corporate Presentation Probe April 2024.pdfProbe Gold
 
The Concept of Humanity in Islam and its effects at future of humanity
The Concept of Humanity in Islam and its effects at future of humanityThe Concept of Humanity in Islam and its effects at future of humanity
The Concept of Humanity in Islam and its effects at future of humanityJohanAspro
 
如何办理北卡罗来纳大学教堂山分校毕业证(文凭)UNC学位证书
如何办理北卡罗来纳大学教堂山分校毕业证(文凭)UNC学位证书如何办理北卡罗来纳大学教堂山分校毕业证(文凭)UNC学位证书
如何办理北卡罗来纳大学教堂山分校毕业证(文凭)UNC学位证书Fir La
 
slideshare_2404_presentation materials_en.pdf
slideshare_2404_presentation materials_en.pdfslideshare_2404_presentation materials_en.pdf
slideshare_2404_presentation materials_en.pdfsansanir
 
the 25 most beautiful words for a loving and lasting relationship.pdf
the 25 most beautiful words for a loving and lasting relationship.pdfthe 25 most beautiful words for a loving and lasting relationship.pdf
the 25 most beautiful words for a loving and lasting relationship.pdfFrancenel Paul
 
WheelTug PLC Pitch Deck | Investor Insights | April 2024
WheelTug PLC Pitch Deck | Investor Insights | April 2024WheelTug PLC Pitch Deck | Investor Insights | April 2024
WheelTug PLC Pitch Deck | Investor Insights | April 2024Hector Del Castillo, CPM, CPMM
 
Q1 Quarterly Update - April 16, 2024.pdf
Q1 Quarterly Update - April 16, 2024.pdfQ1 Quarterly Update - April 16, 2024.pdf
Q1 Quarterly Update - April 16, 2024.pdfProbe Gold
 
Osisko Gold Royalties Ltd - Corporate Presentation, April 23, 2024
Osisko Gold Royalties Ltd - Corporate Presentation, April 23, 2024Osisko Gold Royalties Ltd - Corporate Presentation, April 23, 2024
Osisko Gold Royalties Ltd - Corporate Presentation, April 23, 2024Osisko Gold Royalties Ltd
 
如何办理密苏里大学堪萨斯分校毕业证(文凭)UMKC学位证书
如何办理密苏里大学堪萨斯分校毕业证(文凭)UMKC学位证书如何办理密苏里大学堪萨斯分校毕业证(文凭)UMKC学位证书
如何办理密苏里大学堪萨斯分校毕业证(文凭)UMKC学位证书Fir La
 
9654467111 Call Girls In Katwaria Sarai Short 1500 Night 6000
9654467111 Call Girls In Katwaria Sarai Short 1500 Night 60009654467111 Call Girls In Katwaria Sarai Short 1500 Night 6000
9654467111 Call Girls In Katwaria Sarai Short 1500 Night 6000Sapana Sha
 
Nicola Mining Inc. Corporate Presentation April 2024
Nicola Mining Inc. Corporate Presentation April 2024Nicola Mining Inc. Corporate Presentation April 2024
Nicola Mining Inc. Corporate Presentation April 2024nicola_mining
 
9654467111 Low Rate Call Girls In Tughlakabad, Delhi NCR
9654467111 Low Rate Call Girls In Tughlakabad, Delhi NCR9654467111 Low Rate Call Girls In Tughlakabad, Delhi NCR
9654467111 Low Rate Call Girls In Tughlakabad, Delhi NCRSapana Sha
 

Dernier (20)

The resilient U.S. late-cycle expansion contributed to a stalling pattern in ...
The resilient U.S. late-cycle expansion contributed to a stalling pattern in ...The resilient U.S. late-cycle expansion contributed to a stalling pattern in ...
The resilient U.S. late-cycle expansion contributed to a stalling pattern in ...
 
Model Call Girl in Uttam Nagar Delhi reach out to us at 🔝9953056974🔝
Model Call Girl in Uttam Nagar Delhi reach out to us at 🔝9953056974🔝Model Call Girl in Uttam Nagar Delhi reach out to us at 🔝9953056974🔝
Model Call Girl in Uttam Nagar Delhi reach out to us at 🔝9953056974🔝
 
Basic Accountants in|TaxlinkConcept.pdf
Basic  Accountants in|TaxlinkConcept.pdfBasic  Accountants in|TaxlinkConcept.pdf
Basic Accountants in|TaxlinkConcept.pdf
 
Corporate Presentation Probe April 2024.pdf
Corporate Presentation Probe April 2024.pdfCorporate Presentation Probe April 2024.pdf
Corporate Presentation Probe April 2024.pdf
 
Call Girls in South Ex⎝⎝9953056974⎝⎝ Escort Delhi NCR
Call Girls in South Ex⎝⎝9953056974⎝⎝ Escort Delhi NCRCall Girls in South Ex⎝⎝9953056974⎝⎝ Escort Delhi NCR
Call Girls in South Ex⎝⎝9953056974⎝⎝ Escort Delhi NCR
 
Collective Mining | Corporate Presentation - April 2024
Collective Mining | Corporate Presentation - April 2024Collective Mining | Corporate Presentation - April 2024
Collective Mining | Corporate Presentation - April 2024
 
Corporate Presentation Probe April 2024.pdf
Corporate Presentation Probe April 2024.pdfCorporate Presentation Probe April 2024.pdf
Corporate Presentation Probe April 2024.pdf
 
The Concept of Humanity in Islam and its effects at future of humanity
The Concept of Humanity in Islam and its effects at future of humanityThe Concept of Humanity in Islam and its effects at future of humanity
The Concept of Humanity in Islam and its effects at future of humanity
 
young call girls in Yamuna Vihar 🔝 9953056974 🔝 Delhi escort Service
young  call girls in   Yamuna Vihar 🔝 9953056974 🔝 Delhi escort Serviceyoung  call girls in   Yamuna Vihar 🔝 9953056974 🔝 Delhi escort Service
young call girls in Yamuna Vihar 🔝 9953056974 🔝 Delhi escort Service
 
如何办理北卡罗来纳大学教堂山分校毕业证(文凭)UNC学位证书
如何办理北卡罗来纳大学教堂山分校毕业证(文凭)UNC学位证书如何办理北卡罗来纳大学教堂山分校毕业证(文凭)UNC学位证书
如何办理北卡罗来纳大学教堂山分校毕业证(文凭)UNC学位证书
 
young Call girls in Dwarka sector 1🔝 9953056974 🔝 Delhi escort Service
young Call girls in Dwarka sector 1🔝 9953056974 🔝 Delhi escort Serviceyoung Call girls in Dwarka sector 1🔝 9953056974 🔝 Delhi escort Service
young Call girls in Dwarka sector 1🔝 9953056974 🔝 Delhi escort Service
 
slideshare_2404_presentation materials_en.pdf
slideshare_2404_presentation materials_en.pdfslideshare_2404_presentation materials_en.pdf
slideshare_2404_presentation materials_en.pdf
 
the 25 most beautiful words for a loving and lasting relationship.pdf
the 25 most beautiful words for a loving and lasting relationship.pdfthe 25 most beautiful words for a loving and lasting relationship.pdf
the 25 most beautiful words for a loving and lasting relationship.pdf
 
WheelTug PLC Pitch Deck | Investor Insights | April 2024
WheelTug PLC Pitch Deck | Investor Insights | April 2024WheelTug PLC Pitch Deck | Investor Insights | April 2024
WheelTug PLC Pitch Deck | Investor Insights | April 2024
 
Q1 Quarterly Update - April 16, 2024.pdf
Q1 Quarterly Update - April 16, 2024.pdfQ1 Quarterly Update - April 16, 2024.pdf
Q1 Quarterly Update - April 16, 2024.pdf
 
Osisko Gold Royalties Ltd - Corporate Presentation, April 23, 2024
Osisko Gold Royalties Ltd - Corporate Presentation, April 23, 2024Osisko Gold Royalties Ltd - Corporate Presentation, April 23, 2024
Osisko Gold Royalties Ltd - Corporate Presentation, April 23, 2024
 
如何办理密苏里大学堪萨斯分校毕业证(文凭)UMKC学位证书
如何办理密苏里大学堪萨斯分校毕业证(文凭)UMKC学位证书如何办理密苏里大学堪萨斯分校毕业证(文凭)UMKC学位证书
如何办理密苏里大学堪萨斯分校毕业证(文凭)UMKC学位证书
 
9654467111 Call Girls In Katwaria Sarai Short 1500 Night 6000
9654467111 Call Girls In Katwaria Sarai Short 1500 Night 60009654467111 Call Girls In Katwaria Sarai Short 1500 Night 6000
9654467111 Call Girls In Katwaria Sarai Short 1500 Night 6000
 
Nicola Mining Inc. Corporate Presentation April 2024
Nicola Mining Inc. Corporate Presentation April 2024Nicola Mining Inc. Corporate Presentation April 2024
Nicola Mining Inc. Corporate Presentation April 2024
 
9654467111 Low Rate Call Girls In Tughlakabad, Delhi NCR
9654467111 Low Rate Call Girls In Tughlakabad, Delhi NCR9654467111 Low Rate Call Girls In Tughlakabad, Delhi NCR
9654467111 Low Rate Call Girls In Tughlakabad, Delhi NCR
 

Yahoo Inc. (YHOO) Initiated with Perform Rating on Equity Research

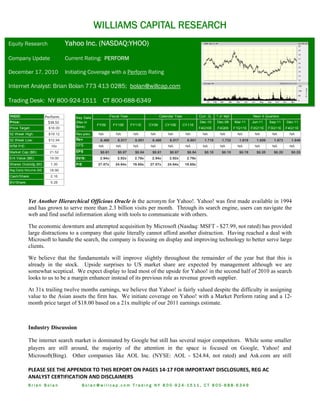
  • 1. WILLIAMS CAPITAL RESEARCH Equity Research Yahoo Inc. (NASDAQ:YHOO) Company Update Current Rating: PERFORM December 17, 2010 Initiating Coverage with a Perform Rating Internet Analyst: Brian Bolan 773 413 0285; bolan@willcap.com Trading Desk: NY 800-924-1511 CT 800-688-6349 YHOO Perform Fiscal Year Calendar Year Curr. Q. 1 yr ago Next 4 Quarters Key Data Price: $16.51 (Rev in Dec-10 Dec-09 Mar-11 Jun-11 Sep-11 Dec-11 FY09 FY10E FY11E CY09 CY10E CY11E Price Target: $18.00 $bns) F4Q10E F4Q09 F1Q11E F2Q11E F3Q11E F4Q11E 52 Week High: $19.12 Rev prev: NA NA NA NA NA NA NA NA NA NA NA NA 52 Week Low: $12.94 Rev 6.460 6.517 6.801 6.460 6.517 6.801 1.718 1.732 1.619 1.659 1.673 1.849 NTM P/E: 16x EPS NA NA NA NA NA NA NA NA NA NA NA NA prev: EPS Market Cap ($B): 21.52 $0.61 $0.67 $0.84 $0.61 $0.67 $0.84 $0.18 $0.15 $0.19 $0.20 $0.20 $0.25 Ent Value ($B): 19.00 EV/S: 2.94x 2.92x 2.79x 2.94x 2.92x 2.79x Shares Outstdg (M): 1.30 P/E 27.07x 24.64x 19.65x 27.07x 24.64x 19.65x Avg Daily Volume (M): 18.90 Cash/Share: 2.16 BV/Share: 9.28 Yet Another Hierarchical Officious Oracle is the acronym for Yahoo!. Yahoo! was first made available in 1994 and has grown to serve more than 2.3 billion visits per month. Through its search engine, users can navigate the web and find useful information along with tools to communicate with others. The economic downturn and attempted acquisition by Microsoft (Nasdaq: MSFT - $27.99, not rated) has provided large distractions to a company that quite literally cannot afford another distraction. Having reached a deal with Microsoft to handle the search, the company is focusing on display and improving technology to better serve large clients. We believe that the fundamentals will improve slightly throughout the remainder of the year but that this is already in the stock. Upside surprises to US market share are expected by management although we are somewhat sceptical. We expect display to lead most of the upside for Yahoo! in the second half of 2010 as search looks to us to be a margin enhancer instead of its previous role as revenue growth supplier. At 31x trailing twelve months earnings, we believe that Yahoo! is fairly valued despite the difficulty in assigning value to the Asian assets the firm has. We initiate coverage on Yahoo! with a Market Perform rating and a 12- month price target of $18.00 based on a 21x multiple of our 2011 earnings estimate. Industry Discussion The internet search market is dominated by Google but still has several major competitors. While some smaller players are still around, the majority of the attention in the space is focused on Google, Yahoo! and Microsoft(Bing). Other companies like AOL Inc. (NYSE: AOL - $24.84, not rated) and Ask.com are still PLEASE SEE THE APPENDIX TO THIS REPORT ON PAGES 14‐17 FOR IMPORTANT DISCLOSURES, REG AC  ANALYST CERTIFICATION AND DISCLAIMERS  Brian Bolan Bolan@willcap.com Trading NY 800-924-1511, CT 800-688-6349
  • 2. WILLIAMS CAPITAL RESEARCH PAGE 2 December 17, 2010 relevant in terms of market share, but few others have been able to make or sustain an impact in the industry. Search sites, unlike popular portals, have maintained their position as starting points for users. Yahoo! made being the starting point for users a key strategic initiative, demonstrating the importance of being first. Whether users prefer content on the starting page or a search box, it is clear that search will continue to be a dominate platform for the internet. Taking the search engine beyond the search home page has been the goal of the major search companies over the last several years. They have utilized the ability to quickly index a page, scan it for keywords or phrases and deliver highly targeted ads that match the content of the specific page. The best example of this was in the social networking space as Google outbid competitors to deliver ads to one of the most trafficked sites, the News Corp- owned MySpace. The deal focused on better monetizing the massive traffic on the site and led its major competitor to enlist the help of Microsoft to serve its ads. The difference in the two deals was a $15 billion valuation that was given to Facebook by Microsoft via a minority stake investment. With the investment, Microsoft became the ad serving agent for Facebook, the popular social networking site. A watershed moment came during the 4Q07 Google earnings conference call. The company noted that it was facing challenges in monetizing the traffic that MySpace was generating. Microsoft sensed weakness and moved to attempt to level the playing field in the search space by making a $46B bid for Yahoo!. An arduous fight ensued as Yahoo! was determined to remain independent and struck an accord with Google in an effort to escape Microsoft’s bear hug. Yahoo! successfully thwarted the takeover attempt; however, it continues to see its market share decrease. Microsoft has abandoned its quest for a complete purchase of Yahoo! and has instead moved to join forces with Yahoo! and combine the search efforts of Bing with Yahoo! to better compete with Google. Yahoo! stayed out of the competition for server ads to the major social networks, with Microsoft investing in and serving ads for Facebook, while Google still delivers ads for MySpace. Display rates came down significantly in the economic downturn as ad buying mainstays of Auto’s and Finance verticals both suffered more than most. Rates have returned as ad budgets for online brand buys have increased in 2010. Where the growth will come from Much has already been said about the shift of ad budgets to online from offline. We believe this trend will continue; but just as that trend continues to accelerate, another segment is at its nascent stage. Mobile phones have become more sophisticated in the last few years, with BlackBerry maker Research in Motion still leading the way in terms of market share. What was a battle between BlackBerry and Palm has turned into a race with several competitors, the most notable of which is Apple’s (Nasdaq: AAPL - $321.25, not rated) iPhone. The rich content of the web has moved from the PC to the smartphone. The potential to target consumers via tracking movement and purchases subsidized via advertising could significantly change how commerce is enacted. As new technology comes to market, we believe that consumers will embrace smartphones and their features. It may be some time before consumers are willing to allow for web-based payments to take share from credit cards, but it is something that makes sense over the long term. This bodes well for the platform that is the most robust which, by definition, will allow for the most applications. We believe that Yahoo! will take an agnostic approach to the two key platforms of Android and Apple and develop applications for both. We would note that the Yahoo Search app for iPhone with its drawing features is a strong competitor in the market. Brian Bolan Bolan@willcap.com Trading NY 800-924-1511, CT 800-688-6349
  • 3. WILLIAMS CAPITAL RESEARCH PAGE 3 December 17, 2010 Market Share Over the last several years, market share has been measured by several companies that purchase the “clickstream” of users from internet service providers (ISP). This raw data is analyzed to determine how many searches were made in a specific time frame (generally one month) and where they were made. This data is not fully endorsed by the search companies, but the trends are usually in agreement with the search companies’ internal logs. Google is the dominant search company with almost 70% of the worldwide market as tabulated by comScore. We believe that Google’s market share of search will continue to grow and will approach the 75% level in the summer of 2011. Yahoo!, on the other hand, has seen its share of the US and worldwide markets continue to fall. We believe that this trend will continue despite the search partnership the company entered into with Bing. With only a year under Bing’s belt it is hard to compare it to Yahoo! and Google, but it is a significant change from the MSN search stats Microsoft used to deliver. Early results for March indicate that Yahoo! gained share from both Google and Bing, and showed some signs of stabilization in what had been a year-long pattern of market share losses for Yahoo!. Going forward, we believe that search market share numbers will focus mostly on worldwide measurements as opposed to domestic vs. international. That being said, Google dominance is unquestioned worldwide, although there are smaller segments of the world where Google is not the leader. Yandex is the leader in Russia, but this market is small compared to the US. Exhibit 1 Source: Company reports and Williams Capital Research Seasonality There is an issue of seasonality that affects internet usage and internet companies. The general consensus is that usage slows during the summer months as the weather draws more people to outdoor activities. The later part of the third quarter is buoyed by back to school when traffic increases from academic sources. The fourth quarter is traditionally the strongest quarter as the combination of the educational segment and the searches that arise from the holiday shopping and travel season increase traffic. Brian Bolan Bolan@willcap.com Trading NY 800-924-1511, CT 800-688-6349
  • 4. WILLIAMS CAPITAL RESEARCH PAGE 4 December 17, 2010 Comparable Companies Yahoo! faces competition from numerous sources, and while it produces its own content, it partners with newspapers and other media partners in attempts to drive traffic. The company relies on both the search engine and its owned media properties for a majority of its revenue. The search deal with Microsoft makes that comparable a moot point in terms of search, as the two search engines will likely begin producing the exact same results. In essence the same search will produce the same results at Bing as well as the Yahoo! search. We believe this will, over time, shift market share from Yahoo! search to Bing. Google (NASDAQ: GOOG - $591.71, rated Outperform) - Google dominates the search market with approximately 65% of US market share and has a sizeable digital footprint. Through its acquisition of DoubleClick, it also participates in the display business placing ads on properties the company owns as well as for Network partners. Google has a substantial balance sheet and the ability to make large acquisitions or develop costly operations from scratch. Aol. (NYSE: AOL - $321.25, not rated) - After a spin out from Time Warner, Aol. is now a primary competitor with Yahoo! in the highly competitive fields of display advertising, email and instant messaging. Aol. search is enhanced by Google and maintains roughly 3-4% of the domestic search market. Lately, the company has focused more on producing localized content on which it runs display advertisements. Microsoft (NASDAQ: MSFT- $27.99, not rated) - Despite being a key partner in search, Microsoft also offers an ad network to publishers to reach mobile, content (display) and search platforms. Although the online division of Microsoft is not a significant portion of total revenue contribution, we believe that the company will continue to compete in the space. Baidu (NASDAQ: BIDU - $98.31, not rated) - The Chinese search engine is a competitor in the international space. Based in China, Baidu has seen its stock soar since its IPO and has dominated the Chinese language search market. Though most of its appeal has been its MP3 search and downloads, Biadu competes with Yahoo!’s Asian properties Yandex (Private Company) – Yandex is a Russian search engine that has 19 million daily users and is growing fast in Eastern Europe. The company’s market share in Russia increased from 56% in January 2009 to 62% by February of 2010 with page-views of 10 billion in December 2009. Google had 21.8% market share in Russia in February 2010. Brian Bolan Bolan@willcap.com Trading NY 800-924-1511, CT 800-688-6349
  • 5. WILLIAMS CAPITAL RESEARCH PAGE 5 December 17, 2010 Exhibit 2 Source: Google Finance, recent prices Company Background Yahoo!, which recently turned 15 years old, has seen a dramatic series of events that most parents of teenagers understand. From birth to bubble to bust to buyout, this company has gone through a lot and continues to be a leader in the internet. To get a better understanding of the company we are looking at each unit and how it has performed over the last few years. Exhibit 3 Source: Company reports & Williams Capital Research Search Owned and Operated (O&O) Search has been a source of disappointment since its revenue peaked back in 3Q08, as the broader economy began to turn. The company struggled the rest of the year but entered 2010 with more disappointments in search. Brian Bolan Bolan@willcap.com Trading NY 800-924-1511, CT 800-688-6349
  • 6. WILLIAMS CAPITAL RESEARCH PAGE 6 December 17, 2010 Exhibit 4 Source: Company reports & Williams Capital Research We believe that the search deal with Microsoft will ultimately improve margins as the company continues to focus of driving more display share. Display The Display business is best characterized by brand-building advertisements. These command lower rates than search-based ad rates as search is more a “point of purchase” style advertisement. With the economy recovering, display rates are likely to move higher off of what are likely artificially low rates over the past few quarters. With more devices coming to market (iPad, Slate, and smartphones) we believe that total impressions will grow in the remainder of the year despite the fact that Yahoo! saw 0% pageview growth in 1Q10. Exhibit 5 Source: Company reports & Williams Capital Research Affiliate Yahoo! noted on its 1Q10 conference call that it is working to deepen its relationship with significant partners, and we believe that its continued focus on better ad serving technology will pay off in the form of higher revenue Brian Bolan Bolan@willcap.com Trading NY 800-924-1511, CT 800-688-6349
  • 7. WILLIAMS CAPITAL RESEARCH PAGE 7 December 17, 2010 from affiliates. With Yahoo!’s reach of 600 million audience members, it remains a high priority for most advertisers. Exhibit 6 Source: Company reports & Williams Capital Research Listings and Services The decrease in revenues in Listings and Services is likely to continue as Yahoo! sold HotJobs to Monster.com in February 2010. This change could have affected the listings at HotJobs in the quarter outside of the pre-existing contracts. Exhibit 7 Source: Company reports & Williams Capital Research Fees Fees revenue declined 11.7% sequentially in 1Q10 as broadband partnership shifted to advertising from a fee- based structure. At the end of CY08, Yahoo! had 19 million fee-paying customers and by the end of the following year that number stood at 9.7 million. We expect to see further decreases in the fee revenue line item over the course of the year. Brian Bolan Bolan@willcap.com Trading NY 800-924-1511, CT 800-688-6349
  • 8. WILLIAMS CAPITAL RESEARCH PAGE 8 December 17, 2010 Exhibit 8 Source: Company reports & Williams Capital Research Acquisitions Yahoo! has a history of acquiring companies, but lately the track record has been less than stellar. The Company proved that it wasn’t afraid of large scale acquisitions when it purchased Overture or the $5 billion price tag it paid for the Mark Cuban Broadcast.com company. Since that time the company continued eating up smaller companies, some of which eventually dissolved and some that failed to reach their pre-acquisition hype. Yahoo! bought a couple of ad exchanges over the last two years including RightMedia and Blue Lithium. The move brought a new model (exchange) to Yahoo! but we have seen little evidence that the marketplace is about to shift the way it purchases ads. We believe the takeaway from the last two acquisitions (Maktoob.com in August 2009 and citizensports.com in March 2010) shows the company will continue to add to its platform despite its currency (stock) being weaker than it has been over the last few years. That said, we do not believe that any significant acquisitions are in the works for Yahoo!. Management Venture Capitalists have a saying about management, ‘the jockey is just as important as the horse.’ This means that management can make or break even the best of ideas. That seemed to be the case over the last several years with Yahoo!. Terry Semel, a former CEO of Yahoo! wanted to position the company as close as he could to Hollywood in order to develop media relations and advertising partnerships. One too many misses of earnings led him to leave the position and he was replaced by co-founder Jerry Yang. Jerry Yang’s tenure as CEO was far shorter, as Microsoft attempted to acquire Yahoo! but Yang did not want to see the company he founded be sold to what many in the technology industry consider to be the new age “Big Brother”. The hiring of Carol Bartz was a surprise move going with more veteran leadership that featured more crass out takes. At the start of her tenure her energy and shakeup were welcome changes, but a brain drain of talent leaving for start-ups and competitors has made us question the decision. A few months ago, Bartz was on a media blitz Brian Bolan Bolan@willcap.com Trading NY 800-924-1511, CT 800-688-6349
  • 9. WILLIAMS CAPITAL RESEARCH PAGE 9 December 17, 2010 after completing a year as CEO but still had troubles in describing what Yahoo! does and what the plan for the future was. Our concerns with top management are that Yahoo! may be trying to be too much to too many instead of focusing on core competencies. Carol Bartz Ms. Bartz has served as Chief Executive Officer and as a member of the Board of Directors since January 2009. Ms. Bartz served as the Executive Chairman of the Board of Autodesk, Inc., a computer-aided design software provider, from May 2006 to February 2009, as Chairman, President and Chief Executive Officer of Autodesk from April 1992 to April 2006 and as a director of Autodesk from April 1992 to February 2009. Tim Morse, Prior to joining Yahoo!, Morse was the CFO of Altera Corporation, a semiconductor company specializing in programmable logic devices for communications, industrial, and consumer applications, where he established scalable, cost-effective processes and controls. He previously served as the CFO and general manager of business development for General Electric Plastics. The recent loss of Hilary Schneider speaks to the continuous turmoil at the top as Yahoo! has struggled with giving its vision clarity. We expect Yahoo! to begin to look at poaching talent from companies like AOL and Google as it continues to tweak its value proposition to the market. Much as being a one stop shop in the financial sector did not work, we do not believe that advertisers or consumers are looking for one place, one site to handle all of their digital needs. The recent layoffs of 600-700 employees will also work against the general morale of the people that remain at Yahoo! Financial Statement Analysis Yahoo!’s Income Statement showed year over year top line growth for consecutive quarters the first time in several quarters with Display increasing 20% year over year in 1Q10 and 19% year over year in 2Q10. Affiliates also contributed to the growth but it was the only other line item to show year over year growth. We anticipate year over year growth of 4% in the remaining quarter of 2010. Yahoo! will have a complex year financially with the Microsoft search deal providing some cost savings for the company and potentially lowering expected R&D costs towards the end of the year. With less of a focus on search, the company will likely be looking to display and affiliates to pick up any revenue shortfall. We expect margins, on a whole to begin to improve over the next several quarters. Balance Sheet At the end of 2Q10, Yahoo! had more than $3.8 billion in cash and equivalents and marketable securities, down from $4.14 billion following the first quarter of 2010. During the most recent quarter, the company repurchased 32 million shares for $496 million. On June 24 a new buyback of $3 billion was authorized, and we expect the company to continue to repurchase shares. Yahoo! does not have any long term debt at this time. We do not expect Yahoo! to take on any long term debt in the foreseeable future. Asian Assets The company holds a significant interest in two Asian internet properties, Yahoo! Japan and Alibaba Group. These investments have caused a great deal of consternation among investors and the press as calls for monetization have not been answered. Given the tax implications, lack of liquidity, and general lack of premium Brian Bolan Bolan@willcap.com Trading NY 800-924-1511, CT 800-688-6349
  • 10. WILLIAMS CAPITAL RESEARCH PAGE 10 December 17, 2010 buyers, we expect Yahoo! to continue to hold these assets for the foreseeable future. Yahoo! holds approximately 35% ownership of Yahoo! Japan and a 44% ownership of the Alibaba Group. Over the last few years there has been a call to monetize these assets and or call attention so that the market will reflect the value of these assets in the Yahoo! share price. We believe that assets hold value, but investors should be more concerned with the day-to-day operations of the company instead of looking for a monetization event. Should the company move to monetize any of the Asian assets, it may be interpreted as sign of weakness and the near term financial gain may be undermined by longer term pressure on the stock. Financial Outlook The company has noted that its current goals are to increase margins, and the Microsoft Search deal will go a long way to helping that happen. We expect that better rates for the display business combined with better audience targeting will result in better performance for Yahoo! in 2010. We are not overly aggressive in terms of our estimates for Yahoo! as we are skeptical that the company will substantially improve its search share. At the same time, we believe that margins should expand as costs move lower and revenue improves slightly. Recommendation and Valuation We are initiating coverage of Yahoo! with a Market Perform rating and a one-year price target of $18. Over the last year, we have seen severe multiple contraction as revenue deceleration has taken its toll on the valuation. We see potential for improvements for the display business and increases in operating margin due to the Microsoft deal to help the financial outlook for 2011. Our price target is derived off of a 21x multiple of our 2011 earnings estimate. Having been a member of the “Nifty-Fifty” (50x forward earnings) in the past, Yahoo! has seen its valuation readjusted after the Microsoft offer and subsequent search deal. We believe that Wall Street discounts the Asian assets slightly more than the approximate $8.3 billion value they have as a sale or greater monetization is unlikely. The weak cash position compared to two of its main rivals is also an aspect that we believe has to factor into overall valuation. Our price target of $18 per share is derived by a multiple of 21x our 2011 earnings estimate of $0.84. Investment Risks If the company experiences any or all of the following risk factors, as well as others, the company’s stock price may be affected.  Advertisers reduce internet budgets. Advertising is the source of the majority of Yahoo!’s revenue. Should advertisers lose faith in the internet as a medium for advertisements Yahoo! would suffer a significant revenue slowdown.  A better advertising platform is developed for internet advertising. Search has been the dominant Brian Bolan Bolan@willcap.com Trading NY 800-924-1511, CT 800-688-6349
  • 11. WILLIAMS CAPITAL RESEARCH PAGE 11 December 17, 2010 application on the internet for the last ten years. Should another application become more acceptable than search, advertisers could move budgets from search to that platform.  Competition is intense and moves quickly. Yahoo! faces intense competition from Google and AOL among others. Should a competitor develop a more efficient and relevant search engine, a better email platform, or a more compelling display platform, Yahoo! would be severely impacted.  Future growth is predicated on success of mobile. Many of our assumptions of growth are based on the future success of all things mobile. Should Yahoo! fail to adapt to a changing environment that focuses on mobile delivery of search and display ads, the company would face significant challenges.  Loss of key management. Turnover at Yahoo! has been significant concern for some time and continues to remain a challenge to top management. Should this trend continue the talent drain will result in an inability to properly serve clients which would put future revenues at risk. Exhibit 9 Source: Company reports & Williams Capital Research Brian Bolan Bolan@willcap.com Trading NY 800-924-1511, CT 800-688-6349
  • 12. WILLIAMS CAPITAL RESEARCH PAGE 12 December 17, 2010 Yahoo! 3Q10 Income Statement Analysis Exhibit 10 Source: Company reports & Williams Capital Research Brian Bolan Bolan@willcap.com Trading NY 800-924-1511, CT 800-688-6349
  • 13. WILLIAMS CAPITAL RESEARCH PAGE 13 December 17, 2010 Yahoo! Income Statement Exhibit 11 Source: Company reports & Williams Capital Research Brian Bolan Bolan@willcap.com Trading NY 800-924-1511, CT 800-688-6349
  • 14. WILLIAMS CAPITAL RESEARCH PAGE 14 December 17, 2010 Appendix - Exhibit 12 Two Year Price Chart Yahoo Inc. (YHOO) Price Perform ance Chart (Rating and Target) 14-Dec-2007 to 15-Dec-2010 (Daily) Ratings: O=Outperform; P=Perform; U=Underperform 35 30 P $18.00 25 20 15 10 5 1/08 4/08 7/08 10/08 1/09 4/09 7/09 10/09 1/10 4/10 7/10 10/10 Yahoo! Inc. Source: FactSet Prices Prices as of December 16th, 2010. ANALYST CERTIFICATION I hereby certify that the views expressed in the foregoing research report accurately reflect my personal any of the subject companies mentioned in this report. I further certify that no part of my compensation was, is, or will be directly, or indirectly, related to the specific recommendations or views contained in this research report. Financial Interests: Neither I, Brian Bolan, nor a member of my household owns securities in any of the subject companies mentioned in this research report. Neither I, nor a member of my household is an officer, director, or advisory board member of the issuer or has another significant affiliation with the subject company. I do not know or have reason to know at the time of this publication of any other material conflict of interest. By: Brian Bolan Williams Capital Research DISCLOSURE INFORMATION ADDITIONAL INFORMATION IS AVAILABLE UPON REQUEST Analyst Compensation: The author's compensation is based upon the value directly or indirectly attributed to the research services by Williams Capital institutional brokerage clients. The author of this report is compensated based on the performance of the firm, and has not received any compensation in the past 12 months from any of the subject companies mentioned in this report. The performance of the firm is driven by its secondary trading revenues, investment banking revenues, and asset management revenues. Brian Bolan Bolan@willcap.com Trading NY 800-924-1511, CT 800-688-6349
  • 15. WILLIAMS CAPITAL RESEARCH PAGE 15 December 17, 2010 Williams Capital Group does not act as a market-maker. Williams Capital Group does act as a block positioner. WILLIAMS CAPITAL RESEARCH STOCK RATING KEY: Outperform: (BUY) In the analyst's opinion, the stock will outperform the sector by 5% over the next 12 months. Perform: (HOLD) In the analyst's opinion, the stock or sector will be in line with the sector over the next 12 months. Underperform: (SELL) In the analyst's opinion, the stock or sector will underperform the sector by 5% over the next 12 months. DISCLAIMER The opinions, forecasts, and recommendations contained in this report are those of the analyst preparing the report and are based upon the information available to them as of the date of the report. The analysts are basing their opinions upon information they have received from sources they believe to be accurate and reliable and the completeness and/or accuracy is neither implied nor guaranteed. The opinions and recommendations are subject to change without notice. Williams Capital Research has no obligation to continue to provide this institutional research product and no such obligation is implied or guaranteed. The report is provided to the Institutional clients of Williams Capital Research for informational purposes only and is not an offer or a solicitation for the purchase or sale of any financial instrument. The firm does not make a market in the security of the subject company(ies) or affiliated securities. The firm or its employees may buy or sell the subject company’s(ies’) securities or derivatives that is/are the subject(s) of this report. And the firm from time to time may buy or sell the subject company’s fixed income securities from customers on a principal basis. Past performance is not an indication of future results. Calculations of price targets are based on a combination of one or more methodologies generally accepted among financial analysts, including but not limited to, analysis of multiples and/or discounted cash flows (whether whole or in part), or any other method which may be applied. Although the statements of fact in this report have been obtained from and are based upon outside sources that the firm believes to be reliable, the firm does not guarantee the accuracy or completeness of material contained in this report. Any such estimates or forecasts contained in this report may not be met. Past performance is not an indication of future results. Calculations Brian Bolan Bolan@willcap.com Trading NY 800-924-1511, CT 800-688-6349
  • 16. WILLIAMS CAPITAL RESEARCH PAGE 16 December 17, 2010 of price targets are based on a combination of one or more methodologies generally accepted among financial analysts, including but not limited to, analysis of multiples and/or discounted cash flows (whether whole or in part), or any other method which may be applied. Rating, target price and price history information on the company in this report is available upon request. ADDITIONAL DISCLOSURE INFORMATION: The Williams Capital Group, L.P. or its Affiliates do and seek compensation for investment banking services from the subject company(ies) within the next 3 months. As a result, investors should be aware that the firm may have a conflict of interest that could affect the objectivity of this report. Investors should consider this report as only a single factor in making their investment decision. Additional information is available upon request. “Investment Banking Clients” is defined as companies in respect of which The Williams Capital Group, L.P. (the “firm”) or its affiliates have received or are entitled to receive compensation for investment banking services in connection with transactions that were publicly announced in the past 12 months. Distribution of Equity Research Ratings as of: December 16, 2010 Outperform Perform Sell All Research Coverage: 75% 25% 0% Universe of IBC: 0% 0% 0% Consumer Staples: 50% 50% 0% Consumer Staples - IBC: 0% 0% 0% Company Ratings History Prior Current Target Company Name Ticker Date Action Rating Rating Price Price Yahoo! YHOO 16-Dec-10 Initiation of Coverage None Perform $16.51 $18.00 Brian Bolan Bolan@willcap.com Trading NY 800-924-1511, CT 800-688-6349
  • 17. WILLIAMS CAPITAL RESEARCH PAGE 17 December 17, 2010 Valuation We are initiating coverage of Yahoo! with a Market Perform rating and a one-year price target of $18. Over the last year, we have seen severe multiple contraction as revenue deceleration has taken its toll on the valuation. We see potential for improvements for the display business and increases in operating margin due to the Microsoft deal to help the financial outlook for 2011. Our price target is derived off of a 21x multiple of our 2011 earnings estimate. Having been a member of the “Nifty-Fifty”(50x forward earnings) in the past, Yahoo! has seen its valuation readjusted after the Microsoft offer and subsequent search deal. We believe that Wall Street discounts the Asian assets slightly more than the approximate $8.3 billion value they have as a sale or greater monetization is unlikely. The weak cash position compared to two of its main rivals is also an aspect that we believe has to factor into overall valuation. Our price target of $18 per share is derived by a multiple of 21x our 2011 earnings estimate of $0.84. Risks If the company experiences any or all of the following risk factors, as well as others, the company’s stock price may be affected. 1. Advertisers reduce internet budgets. Advertising is the source of the majority of Yahoo!’s revenue. Should advertisers lose faith in the internet as a medium for advertisements Yahoo! would suffer a significant revenue slowdown. 2. A better advertising platform is developed for internet advertising. Search has been the dominant application on the internet for the last ten years. Should another application become more acceptable than search, advertisers could move budgets from search to that platform. 3. Competition is intense and moves quickly. Yahoo! faces intense competition from Google and AOL among others. Should a competitor develop a more efficient and relevant search engine, a better email platform, or a more compelling display platform, Yahoo! would be severely impacted. 4. Future growth is predicated on success of mobile. Many of our assumptions of growth are based on the future success of all things mobile. Should Yahoo! fail to adapt to a changing environment that focuses on mobile delivery of search and display ads, the company would face significant challenges. 5. Loss of key management. Turnover at Yahoo! has been significant concern for some time and continues to remain a challenge to top management. Should this trend continue the talent drain will result in an inability to properly serve clients which would put future revenues at risk. To receive any additional information upon which this report is based, please contact the following individuals or write to Research Production Department, Williams Capital Research, 650 Fifth Ave., New York, NY 10019 - Suling Lew, Head of Institutional Sales or Jack Murphy, Director of Research 212-373-4243 203-659-6007 Brian Bolan Bolan@willcap.com Trading NY 800-924-1511, CT 800-688-6349