
Recommandé
Contenu connexe
En vedette
En vedette (17)
Similaire à Before and After Examples of PowerPoint Presentation Slides
Similaire à Before and After Examples of PowerPoint Presentation Slides (20)
Dernier
Dernier (20)
Before and After Examples of PowerPoint Presentation Slides
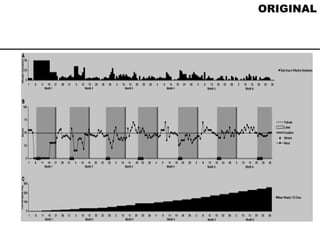
- 1. ORIGINAL
- 2. Title C Month 6 Month 5 Month 4 Month 3 Month 2 Month 1 Lxxxx 300 100 0 1 4 11 16 21 26 31 5 10 15 20 25 30 5 10 15 20 25 30 4 9 14 19 24 29 3 8 13 18 23 28 5 10 15 20 25 30 Mean Weekly LTG Dose 200 B Month 6 Month 5 Month 4 Month 3 Month 2 Month 1 Month 6 Month 5 Month 4 Month 3 Month 2 Month 1 50 25 0 1 4 11 16 21 26 31 5 10 15 20 25 30 5 10 15 20 25 30 4 9 14 19 24 29 3 8 13 18 23 28 5 10 15 20 25 30 100 75 Mood Folicular Lxxx Ovulation Menses Mood Total Area of Symptoms A Mood Dxxx 60 25 0 1 4 11 16 21 26 31 5 10 15 20 25 30 5 10 15 20 25 30 4 9 14 19 24 29 3 8 13 18 23 28 5 10 15 20 25 30
- 6. Studio Production Live Video Option In collaboration with existing programs Video Capture Option Internet Archive • Convenient 24/7 access • Self directed learning DVD • Self directed • Distribution to target audience Podcasts • Advanced technology • Self directed On Demand Marks Lecture Series • “ Lunch in a box” provided to team • Audience identified and secured • Consistent message and top program delivered to target audience and based on local need • Flexible scheduling • Marks can support for teacher if needed OPTION 1
- 7. Studio Production Live Video Option In collaboration with existing programs Video Capture Option Internet Archive • Convenient 24/7 access • Self directed learning DVD • Self directed • Distribution to target audience Podcasts • Advanced technology • Self directed On Demand Marks Lecture Series • “ Lunch in a box” provided to team • Audience identified and secured • Consistent message and top program delivered to target audience and based on local need • Flexible scheduling • Marks can support for teacher if needed OPTION 2