1. WEEKEND INVESTOR DECEMBER 18, 2010
The Return of The Market-Beating Fund Manager
The Stage Is Set for Stock Pickers to Shine. Here's What You Need to Know to Find the Best
Ones
It has been a tough few years for stock-picking mutual fund managers trying to beat the
market—but that's beginning to change.
Stocks' lockstep behavior has been breaking down in recent months, which means active
managers should have more opportunity to shine.
Of course, everyone knows that trying to beat the market can be a fool's game. But there are
new tools that can help investors find managers who have a better chance of outperforming.
The trick is to find stock pickers who actually pick stocks—and are willing to chart their own
course rather than cling to a market index.
Research has shown that the most active managers can beat their benchmarks handily. Yet
according to a new study by Antti Petajisto, visiting assistant finance professor at New York
University's Stern School of Business,
about one-third of U.S. stock fund assets are managed by "closet indexers": fund managers
who claim to be picking and choosing investments but are in fact closely hugging their market
benchmark.
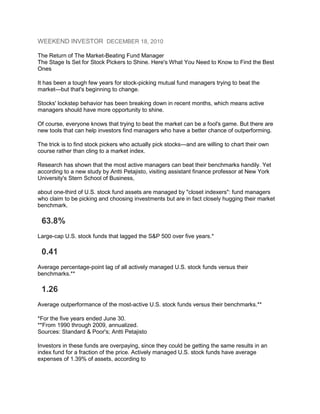
63.8%
Large-cap U.S. stock funds that lagged the S&P 500 over five years.*
0.41
Average percentage-point lag of all actively managed U.S. stock funds versus their
benchmarks.**
1.26
Average outperformance of the most-active U.S. stock funds versus their benchmarks.**
*For the five years ended June 30.
**From 1990 through 2009, annualized.
Sources: Standard & Poor's; Antti Petajisto
Investors in these funds are overpaying, since they could be getting the same results in an
index fund for a fraction of the price. Actively managed U.S. stock funds have average
expenses of 1.39% of assets, according to
2. investment research firm Morningstar Inc., compared with less than 0.1% for some of the
cheapest index funds.
Even the active managers who don't hew closely to an index have had a rough time lately.
That's partly because stocks have moved more or less in sync, making it difficult for managers
to stand apart. In the one-year and
three-year periods ending June 30, 56% of U.S. stock funds lagged the broad market,
according to Standard & Poor's.
But things may be looking up for active managers. More than half of both large-cap value and
large-cap growth managers beat their benchmarks in November, according to Bank of America
Merrill Lynch.
One key is shifting "correlations," which measure whether stocks are moving in sync or if many
zig while others zag. After hitting historically high levels in May and June, stock correlations fell
sharply in October, according to
Matthew Rothman, head of quantitative-equity strategies at Barclays Capital.
The decline, which appeared to coincide with the kickoff of third-quarter earnings season,
suggests fundamental drivers of stock returns are gaining attention—a good sign for stock
pickers, Mr. Rothman says. Though
correlations ticked up again in November, they remained well below the levels seen earlier this
year, according to Barclays.
New Tools
As the outlook brightens for active management, new tools can help investors find stock-picking
funds that are worth the price of admission.
3. One metric to consider is "active share," which measures the percentage of fund assets that are
invested differently from the benchmark. While funds with active share under 20% are likely to
be pure index funds, those
with active share between 20% and 60% generally purport to be "actively managed" but are
actually closet indexing, according to Prof. Petajisto's study.
Active share can have a direct influence on returns. Looking at U.S. stock fund performance in
the 20 years ending 2009, Prof. Petajisto found that the most active stock pickers beat their
benchmarks by 1.26 percentage
points annually after fees. On average, funds with lower active share didn't beat their
benchmarks.
Closet indexing has gained popularity in recent years. Some 31% of U.S. stock fund assets
were in funds with active share between 20% and 60% in 2009, up from roughly 19% in 2006,
according to the study.
High volatility and steep stock declines in recent years may have prompted managers to hug
benchmarks more closely, Prof. Petajisto says. While investors never like their funds to lag
behind market indexes, the underperformance
is especially painful in a down market, and "generates more career risk for managers," he says.
The closet indexers include such well-known names as American Funds' Growth Fund of
America, whose active share was 54% at the end of 2009, according to the study—down from
about 60% in 2008. The roughly $150 billion
fund, which has beaten its benchmark over the past 10 years, has lagged in 2010. Its massive
size may make it more difficult to distinguish itself from the benchmark, analysts say. Some
funds "are forced to be more index-like by
asset growth," says Russel Kinnel, director of fund research at Morningstar.
"We have not seen any correlation between size and returns," nor between active share and
fund performance, says American Funds spokesman Chuck Freadhoff.
The RiverSource Disciplined Equity fund hugged its benchmark even more closely at the end of
2009, posting an active share of just 44%, according to the study. The fund, whose name has
since changed to Columbia Large Core
Quantitative, "is actively managed," Ryan Lund, a spokesman for the fund, said in an email,
adding that portfolio managers strive to keep the tracking error relatively low.
Tomorrow's Stars
Investors looking for star managers would do well to focus on funds making big active bets.
What do such funds look like? Morningstar recently crunched the active-share numbers on more
than 2,000 U.S. stock funds. Managers with
4. the highest active-share rankings in their categories often focus on just a couple of dozen
holdings and are willing to make big moves into cash when they don't see compelling bargains
in the market.
Arthur Moretti, for example, is among the most active of large-cap fund managers, and tends to
limit his Neuberger Berman Guardian and Neuberger Berman Socially Responsive funds'
portfolios to 30 or 40 holdings. "We have a natural
bias to stay away from crowds," which comes in part from a focus on buying stocks with
relatively low valuations, Mr. Moretti says. Both funds have beaten more than 85% of their large-
blend category rivals over the past 10 years, according
to Morningstar.
One of the most active stock pickers among midcap managers is Chuck Akre, who had nearly
60% of his Akre Focus fund's assets in his top 10 stocks as of Sept. 30, and more than 20% in
cash. Given the current economic environment,
"it's prudent to be cautious," Mr. Akre says. As for market indexes, he says, "we pay no
attention to benchmarks. People ask me how we should be benchmarked, and I say, 'I have no
idea.'"
Mr. Akre built his reputation for flouting benchmarks as long-time manager of FBR Focus fund,
which is now run by his former analysts but still has very high active share, according to
Morningstar.
Managers who make lots of active bets, of course, give themselves plenty of leeway to
underperform, as well as outperform, the indexes. John Deysher's Pinnacle Value fund, for
example, has fallen near the bottom of the small-cap value
category so far this year—but it fell only about half as much as the category average in 2008
and has beaten roughly 90% of peers over the past five years, according to Morningstar.
Mr. Deysher now holds roughly 40 stocks in the fund and has nearly half of its assets in cash.
When the fund has made sizable gains on holdings "and the market is clamoring for the stocks,
we're not shy about selling them," he says.
Other Tips
Though active share has gained attention from researchers and money managers, the data can
still be hard to come by for small investors. Morningstar earlier this year added active share data
to its Morningstar Direct research tool, available
to investment advisers and other institutions.
But there is a simple way for small investors to get a rough sense of a fund's active share:
Compare its top holdings to the top holdings of an appropriate index fund. If you see significant
overlap, Prof. Petajisto says, "that's a bad sign."
5. While it is important for investors to select active managers who are actually making active bets,
people also should consider whether the market environment is giving managers much
opportunity to beat the benchmarks, market observers say.
To help investors make such decisions, Russell Investments and Parametric Portfolio
Associates in October launched a lineup of indexes that measure "cross-sectional volatility," or
how differently stocks are behaving within a certain market segment.
The higher the cross-sectional volatility in a particular market sector, the better the opportunities
for active managers to beat—or trail—market indexes, says Paul Bouchey, Parametric's director
of research. Indeed, in a recent study,
Parametric and Russell found that active managers' return dispersions (or gaps between best-
and worst-performing managers) were higher in times of high cross-sectional volatility.
Overall cross-sectional volatility is fairly low right now, but market segments such as U.S. small-
cap growth stocks and emerging-market small caps look like better hunting grounds for active
managers, according to the indexes. Investors can find
monthly cross-sectional volatility data for many market segments at CrossVol.com.
Given overall low levels of cross-sectional volatility now, it is particularly important for investors
to find active managers who are truly active, Mr. Bouchey says.
Investors choosing active stock pickers don't need to abandon index funds, researchers say.
Investors who want a shot at beating the market but also want to reduce their risk of lagging far
behind the indexes could divide their portfolios
between low-cost index funds and true active managers.
But with the bulk of "active" funds trailing the benchmarks after fees, Mr. Petajisto says, "don't
go with anything in the middle."
Write to Eleanor Laise at eleanor.laise@wsj.com
Four Funds Poised to Outshine the Market
Neuberger Berman
Arthur Moretti
Fund: Neuberger Berman Guardian
Manager: Arthur Moretti
Year-to-Date Return: 18.6%
Five-YearAnnualized Return: 2.9%
Fund: Neuberger Berman Socially Responsive
Manager: Arthur Moretti
6. Year-to-Date Return: 21.6%
Five-Year Annualized Return: 3.4%
Chuck Akre
Fund: Akre Focus
Manager: Chuck Akre
Year-to-Date Return: 18.2% Five-YearAnnualized Return: N/A
John Deysher
Fund: Pinnacle Value
Manager: John Deysher
Year-to-Date Return: 12.4%
Five-Year Annualized Return: 6.6%
Data as of Dec. 15, 2010 Source: Morningstar