Gaming Graphs and Charts
•
1 j'aime•1,885 vues

Uses of Graphs in the Computer Gaming Business

Recommandé
Recommandé
Contenu connexe
Similaire à Gaming Graphs and Charts
Similaire à Gaming Graphs and Charts (20)
Plus de Passy World
Plus de Passy World (20)
Dernier
Dernier (20)
Gaming Graphs and Charts
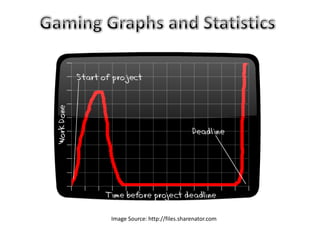
- 2. What was happening during the flat section of the graph? Obviously not any school work! Image Source: http://files.sharenator.com and http://msnbcmedia2.msn.com
- 3. There are lots of graphs on the Internet about Sales and Market Share of Gaming Computers, Consoles, and Software. As shown in this Horizontal Bar Chart, the global game market is worth many billions of dollars and growing rapidly. Image Source: http://origin.arstechnica.com
- 4. The following slides show several different types of Column Graphs: Grouped Columns Stacked Columns Side by Side Comparison Columns These graphs have been used in the real world for representing Sales and Market Share amongst the rival manufacturers of computer gaming equipment. Image Source: http://origin.arstechnica.com
- 7. The Title and Labels on Graphs need to be read very carefully. Many graphs are for “Projected”, “Estimated”, “Forecast”, “Predicted”, “Extrapolated”, or “Expected” values. They are not actual sales or situations which have occurred in the real world, but only things which might possibly happen, (or may not even happen at all). Image Source: http://bulk.destructoid.com
- 10. The Title on any graph always needs to be read very carefully. Many graphs are only for one particular month of successful sales or performance. They do not necessarily indicate longer term reality. The single month of great product performance may in fact not be sustainable. Image Source: http://www.digital-digest.com
- 14. Line Graphs are sometimes used for plotting sales, but they do not seem to be as popular as Column Graphs. Sometimes line graphs are coloured in underneath the lines. This gives the graph stronger impact value, but it can also make the graph difficult to read. Pie Charts are not used very often, and Stem and Leaf Plots are hardly used at all. Image Source: http://cdn4.digitaltrends.com
- 18. Note: In “World of Warcraft”, a Paladin is the symbol of Image Source: http://lh6.ggpht.com ultimate power. He is undefeated, and undefeatable.
- 19. The Nintendo Wii is very popular amongst old people requiring gentle exercise. Image Source: http://3.bp.blogspot.com and http://swongled.com
- 21. Perhaps the reason for the flat section of no work being done on the school project, was not due to time spent distracted on computer gaming after all. See next slide for full screen graph Image Source: http://de.acidcow.com