1. Tech Mahindra
BUY
Target Price `338 CMP `300.4 FY13 PE
7.6x
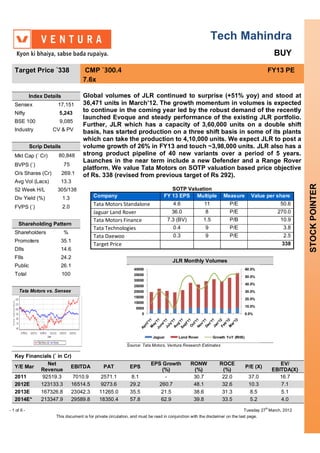
Index Details Global volumes of JLR continued to surprise (+51% yoy) and stood at
Sensex 17,151 36,471 units in March’12. The growth momentum in volumes is expected
Nifty 5,243
to continue in the coming year led by the robust demand of the recently
launched Evoque and steady performance of the existing JLR portfolio.
BSE 100 9,085
Further, JLR which has a capacity of 3,60,000 units on a double shift
Industry CV & PV basis, has started production on a three shift basis in some of its plants
which can take the production to 4,10,000 units. We expect JLR to post a
Scrip Details volume growth of 26% in FY13 and touch ~3,98,000 units. JLR also has a
Mkt Cap (` Cr) 80,848 strong product pipeline of 40 new variants over a period of 5 years.
Launches in the near term include a new Defender and a Range Rover
BVPS (`) 75
platform. We value Tata Motors on SOTP valuation based price objective
O/s Shares (Cr) 269.1 of Rs. 338 (revised from previous target of Rs 292).
Avg Vol (Lacs) 13.3
STOCK POINTER
52 Week H/L 305/138 SOTP Valuation
Div Yield (%) 1.3 Company FY 13 EPS Multiple Measure Value per share
FVPS (`) 2.0 Tata Motors Standalone 4.6 11 P/E 50.6
Jaguar Land Rover 36.0 8 P/E 270.0
Tata Motors Finance 7.3 (BV) 1.5 P/B 10.9
Shareholding Pattern
Tata Technologies 0.4 9 P/E 3.8
Shareholders %
Tata Daewoo 0.3 9 P/E 2.5
Promoters 35.1
Target Price 338
DIIs 14.6
FIIs 24.2
JLR Monthly Volumes
Public 26.1
Total 100
Tata Motors vs. Sensex
Source: Tata Motors, Ventura Research Estimates
Key Financials (` in Cr)
Net EPS Growth RONW ROCE EV/
Y/E Mar EBITDA PAT EPS P/E (X)
Revenue (%) (%) (%) EBITDA(X)
2011 92519.3 7010.9 2571.1 8.1 - 30.7 22.0 37.0 16.7
2012E 123133.3 16514.5 9273.6 29.2 260.7 48.1 32.6 10.3 7.1
2013E 167326.8 23042.3 11265.0 35.5 21.5 38.6 31.3 8.5 5.1
2014E* 213347.9 29589.8 18350.4 57.8 62.9 39.8 33.5 5.2 4.0
th
- 1 of 6 - Tuesday 27 March, 2012
This document is for private circulation, and must be read in conjunction with the disclaimer on the last page.
2. Financials and Projections (Consolidated)
Y/E March, Fig in Rs. Cr FY 2010 FY 2011 FY 2012e FY 2013e Y/E March, Fig in Rs. Cr FY 2010 FY 2011 FY 2012e FY 2013e
Profit & Loss Statement Per Share Data (Rs)
Net Sales 92519.3 123133.3 167326.8 213347.9 EPS 8.1 29.2 35.5 57.8
% Chg. 33.1% 35.9% 27.5% Cash EPS 20.4 43.9 52.3 77.5
Total Expenditure 85508.4 106618.8 144284.5 183758.1 DPS 3.0 4.0 4.0 4.0
% Chg. 24.7% 35.3% 27.4% Book Value 25.9 60.4 91.4 144.6
EBDITA 7010.9 16514.5 23042.3 29589.8 Capital, Liquidity, Returns Ratio
EBDITA Margin % 7.6 13.4 13.8 13.9 Debt / Equity (x) 4.3 1.7 1.5 1.0
Other Income 3123.8 732.4 992.8 1238.7 Current Ratio (x) 1.0 1.1 1.2 1.3
Exceptional Items -259.6 231.0 -660.0 0.0 ROE (%) 30.7 48.1 38.6 39.8
PBDIT 9875.1 17478.0 23375.1 30828.5 ROCE (%) 22.0 32.6 31.3 33.5
Depreciation 3887.1 4655.5 5343.7 6231.7 Dividend Yield (%) 1.0 1.3 1.3 1.3
Interest 2465.3 2385.3 3693.8 3722.0 Valuation Ratio (x)
PBT 3522.6 10437.2 14337.6 20874.7 P/E 37.0 10.3 8.5 5.2
Tax Provisions 1005.8 1216.4 3139.3 2609.3 P/BV 11.6 5.0 3.3 2.1
PAT 2516.9 9220.8 11198.3 18265.4 EV/Sales 1.3 1.0 0.7 0.5
Minority Interest & Others 54.2 52.8 66.7 85.0 EV/EBIDTA 16.7 7.1 5.1 4.0
Consolidated Net Profit 2571.1 9273.6 11265.0 18350.4 Efficiency Ratio (x)
PAT Margin (%) 2.7 7.5 6.7 8.6 Inventory (days) 44.9 41.9 42.0 42.0
Raw Materials / Sales (%) 67.0 64.6 66.5 66.5 Debtors (days) 28.6 20.5 20.0 20.0
Tax Rate (%) 28.6 11.7 12.0 12.5 Creditors (days) 135.4 110.7 110.0 110.0
Balance Sheet Cash Flow statement
Share Capital 570.6 637.7 637.7 637.7 Profit After Tax 2571.1 9273.6 11265.0 18350.4
Reserves & Surplus 7635.9 18533.8 28348.1 45247.8 Depreciation 3887.1 4655.5 5343.7 6231.7
Minority Interest & Others 213.5 246.6 296.6 360.4 Working Capital Changes 4626.0 -1431.8 1692.4 2355.9
Total Loans 35299.5 32791.4 43973.3 44399.2 Others -3391.4 -504.6 45.6 55.9
Deferred Tax Liability 1153.6 1463.8 1463.8 1463.8 Operating Cash Flow 7692.8 11992.7 18346.7 26993.9
Total Liabilities 44873.1 53673.3 74719.5 92108.9 Capital Expenditure -5057.6 -7802.1 -16000.0 -15000.0
Goodwill 0.0 0.0 0.0 0.0 Change in Investment 655.4 -3138.1 -394.2 -32.0
Gross Block 67245.67 75047.7 91047.7 106047.7 Cash Flow from Investing -4402.28 -10940.1 -16394.2 -15032.0
Less: Acc. Depreciation 34232.4 39698.7 45042.4 51274.1 Proceeds from equity issue 1404.8 4703.2 0.0 0.0
Net Block 33013.3 35349.1 46005.3 54773.6 Inc/ Dec in Debt 325.7 -2508.1 11181.9 425.9
Capital Work in Progress 8915.9 11728.9 10500.0 10500.0 Dividend and DDT -344.9 -990.2 -1450.7 -1450.7
Investments 2219.1 2544.3 4167.3 4199.3 Cash Flow from Financing 1385.6 1204.9 9731.2 -1024.8
Net Current Assets 724.8 4051.1 14042.4 22623.6 Net Change in Cash 4676.2 2257.4 11683.7 10937.1
Misc Expenses 0.0 0.0 0.0 0.0 Opening Cash Balance 4121.3 8743.3 10947.9 22631.6
Total Assets 44873.1 53673.3 74719.5 92108.8 Closing Cash Balance 8797.5 11000.8 22631.6 33568.7
Ventura Securities Limited
Corporate Office: C-112/116, Bldg No. 1, Kailash Industrial Complex, Park Site, Vikhroli (W), Mumbai – 400079
This report is neither an offer nor a solicitation to purchase or sell securities. The information and views expressed herein are believed to be reliable, but
no responsibility (or liability) is accepted for errors of fact or opinion. Writers and contributors may be trading in or have positions in the securities
- 2 of 6- Tuesday 27 th March, 2012
This document is for private circulation, and must be read in conjunction with the disclaimer on the last page.
3. mentioned in their articles. Neither Ventura Securities Limited nor any of the contributors accepts any liability arising out of the above information/articles.
Reproduction in whole or in part without written permission is prohibited. This report is for private circulation.
- 3 of 6- Tuesday 27 th March, 2012
This document is for private circulation, and must be read in conjunction with the disclaimer on the last page.