SlideShare une entreprise Scribd logo
1  sur  1
Télécharger pour lire hors ligne
Social Media Scorecard                                                                                                                                                                June 26, 2012

                                   Facebook                         Facebook                         FB %                  Twitter Fans, Twitter Fans, Twitter %                                                            Total Fans,                      Total Fans,
        Industry/Company                                                                                                                                                                                                                                                 % Change
                                   Fans, 4/3                       Fans, 6/26                       Change                     4/3          6/26       Change                                                                  4/3                             6/26
  Airlines                           3,694,524                       4,409,626                         19.4%                 3,823,066     3,978,404         4.1%                                                            7,517,590                        8,388,030      11.6%
  American Airlines                    275,428                         340,567                         23.7%                   349,054       385,735        10.5%                                                              624,482                          726,302      16.3%
  Delta                                303,132                         323,599                          6.8%                   310,172       339,286         9.4%                                                              613,304                          662,885       8.1%
  JetBlue                              583,524                         617,440                          5.8%                 1,672,036     1,676,268         0.3%                                                            2,255,560                        2,293,708       1.7%
  Southwest                          2,159,066                       2,732,526                         26.6%                 1,283,086     1,354,832         5.6%                                                            3,442,152                        4,087,358      18.7%
  United Airlines                      340,896                         357,090                          4.8%                     6,314          8,752       38.6%                                                              347,210                          365,842       5.4%
  US Airways                            32,478
                                        3,694,524
                                                                        38,404
                                                                         4,409,626
                                                                                                       18.2%
                                                                                                           19.4%       -
                                                                                                                               202,404
                                                                                                                                    3,823,066
                                                                                                                                             213,531         5.5%         3,978,404                         4.1%        -
                                                                                                                                                                                                                               234,882
                                                                                                                                                                                                                                  7,517,590
                                                                                                                                                                                                                                                                251,935
                                                                                                                                                                                                                                                                   8,388,030
                                                                                                                                                                                                                                                                              7.3%                 11.6%

TOTAL


  Footwear/Athletic Apparel        55,586,924                      65,974,054                         18.7%                      752,456                              1,006,330                        33.7%                56,339,380                       66,980,384                        18.9%
  Adidas                           13,602,227                      14,754,576                          8.5%                      217,816                                282,788                        29.8%                13,820,043                       15,037,364                         8.8%
  Converse                         24,036,318                      31,542,102                         31.2%                       54,701                                 69,023                        26.2%                24,091,019                       31,611,125                        31.2%
  DC Shoes                          8,348,960                       9,045,341                          8.3%                       96,033                                119,707                        24.7%                 8,444,993                        9,165,048                         8.5%
  Nike                              8,626,685                       9,479,959                          9.9%                      328,124                                470,163                        43.3%                 8,954,809                        9,950,122                        11.1%
  Reebok                              972,734                       1,152,076                         18.4%                       55,782                                 64,649                        15.9%                 1,028,516                        1,216,725                        18.3%
                                        55,586,924                       65,974,054                        18.7%       -             752,456                              1,006,330                         33.7%       -         56,339,380                       66,980,384                      18.9%
TOTAL


  Comics                             4,333,859                      4,922,176                         13.6%                      372,237                               490,195                         31.7%                 4,706,096                        5,412,371                        15.0%
  DC Comics                            610,081                        708,849                         16.2%                      110,017                               134,948                         22.7%                   720,098                          843,797                        17.2%
  Marvel Comics                      3,723,778                      4,213,327                         13.1%                      262,220                               355,247                         35.5%                 3,985,998                        4,568,574                        14.6%
                                        4,333,859                        4,922,176                         13.6%       -             372,237                               490,195                          31.7%       -         4,706,096                        5,412,371                       15.0%
TOTAL


  Fast Food                        45,927,552                      51,518,711                         12.2%                     1,108,138                             1,377,009                        24.3%                47,035,690                       52,895,720                        12.5%
  Burger King                       4,783,022                       5,232,486                          9.4%                        49,020                                57,483                        17.3%                 4,832,042                        5,289,969                         9.5%
  McDonald's                       18,454,549                      20,622,139                         11.7%                       392,910                               515,465                        31.2%                18,847,459                       21,137,604                        12.2%
  Subway                           11,996,695                      14,453,353                         20.5%                       426,048                               524,922                        23.2%                12,422,743                       14,978,275                        20.6%
  Taco Bell                         8,486,600                       8,753,566                          3.1%                       173,480                               197,312                        13.7%                 8,660,080                        8,950,878                         3.4%
  Wendy's                           2,206,686                       2,457,167                         11.4%                        66,680                                81,827                        22.7%                 2,273,366                        2,538,994                        11.7%
                                        45,927,552                       51,518,711                        12.2%       -            1,108,138                             1,377,009                         24.3%       -         47,035,690                       52,895,720                      12.5%
TOTAL


  Beverages                        103,569,365                     109,547,180                         5.8%                     2,045,902                             2,408,965                        17.7%                105,615,267                      111,956,145                        6.0%
  Coca-Cola                         40,989,058                      43,226,782                         5.5%                       515,139                               562,398                         9.2%                 41,504,197                       43,789,180                        5.5%
  Dr. Pepper                        11,725,089                      12,066,031                         2.9%                        93,349                                98,462                          5.5%               11,818,438                       12,164,493                         2.9%
  Monster Energy                    15,233,061                      17,214,909                        13.0%                       212,919                               276,249                         29.7%               15,445,980                       17,491,158                        13.2%
  Pepsi                              7,948,269                       8,374,904                         5.4%                       634,432                               835,187                         31.6%                8,582,701                        9,210,091                         7.3%
  Red Bull                          27,673,888                      28,664,554                         3.6%                       590,063                               636,669                          7.9%               28,263,951                       29,301,223                         3.7%
                                        103,569,365                      109,547,180                       5.8%        -            2,045,902                             2,408,965                         17.7%       -         105,615,267                      111,956,145                     6.0%
TOTAL


  Celebrities (Top 5)              254,814,242                     271,397,713                         6.5%                 64,151,139                            76,406,244                           19.1%                318,965,381                      347,803,957                        9.0%
  Eminem                            55,319,375                      58,880,365                         6.4%                 10,025,651                            11,303,956                           12.8%                 65,345,026                       70,184,321                        7.4%
  Lady Gaga                         49,735,701                      52,282,513                         5.1%                 22,091,047                            26,210,047                           18.6%                 71,826,748                       78,492,560                        9.3%
  Michael Jackson                   47,120,298                      50,191,770                         6.5%                    659,034                               766,713                           16.3%                 47,779,332                       50,958,483                        6.7%
  Rihanna                           54,098,746                      58,010,394                         7.2%                 16,123,461                            21,378,624                           32.6%                 70,222,207                       79,389,018                       13.1%
  Shakira                           48,540,123                      52,032,671                         7.2%                 15,251,946                            16,746,904                            9.8%                 63,792,069                       68,779,575                        7.8%
                                        254,814,242                      271,397,713                       6.5%        -            64,151,139                            76,406,244                        19.1%       -         318,965,381                      347,803,957                     9.0%
TOTAL


  Favorite Foods                   85,858,657                      89,503,548                          4.2%                       80,653                                90,285                          11.9%               85,939,310                       89,593,833                         4.3%
  Oreo                             25,639,920                      26,916,293                          5.0%                       39,437                                41,797                           6.0%               25,679,357                       26,958,090                         5.0%
  Pringles                         18,774,659                      19,714,310                          5.0%                       10,132                                12,273                          21.1%               18,784,791                       19,726,583                         5.0%
  Reese's                           9,119,047                       9,590,760                          5.2%                            -                                     -                           0.0%                9,119,047                        9,590,760                         5.2%
  Skittles                         21,525,516                      22,184,857                          3.1%                       30,097                                33,891                          12.6%               21,555,613                       22,218,748                         3.1%
  Starburst                        10,799,515                      11,097,328                          2.8%                          987                                 2,324                         135.5%               10,800,502                       11,099,652                         2.8%
                                        85,858,657                       89,503,548                        4.2%        -             80,653                                90,285                           11.9%       -         85,939,310                       89,593,833                      4.3%
TOTAL


  Hospitality (Loyalty Programs)      320,678                         340,597                          6.2%                                      -                                     -                                       320,678                          340,597                         6.2%
  Marriott Rewards                    224,246                         226,070                          0.8%                na                                    na                                                            224,246                          226,070                         0.8%
  Starwood Preferred Guest             96,432                         114,527                         18.8%                na                                    na                                                             96,432                          114,527                        18.8%
                                         320,678                          340,597                          6.2%        -              -                                     -                               0.0%        -          320,678                          340,597                        6.2%
TOTAL


  Gaming                           43,895,907                      46,952,842                          7.0%                     1,921,356                             2,111,111                          9.9%               45,817,263                       49,063,953                         7.1%
  Playstation                      22,195,320                      23,446,617                          5.6%                     1,253,780                             1,326,962                          5.8%               23,449,100                       24,773,579                         5.6%
  Nintendo                          5,018,536                       5,481,545                          9.2%                       205,959                               247,173                         20.0%                5,224,495                        5,728,718                         9.7%
  X-Box                            16,682,051                      18,024,680                          8.0%                       461,617                               536,976                         16.3%               17,143,668                       18,561,656                         8.3%
TOTAL                                                 43,895,907                       46,952,842          7.0%    -                                 1,921,356                             2,111,111        9.9%    -                           45,817,263                        49,063,953       7.1%


  TOTAL                            598,001,708                     644,566,445                         7.8%                 74,254,947                            87,868,543                           18.3%                672,256,655                      732,434,988                        9.0%


                                                                      Prepared by Awareness, Inc. All Rights Reserved ©2012

Contenu connexe

Tendances

Social growth 5.15
Social growth 5.15Social growth 5.15
Social growth 5.15Mike Lewis
 
Social growth 5.29
Social growth 5.29Social growth 5.29
Social growth 5.29Mike Lewis
 
omnicom group Q4 2004 Investor Presentation
omnicom group  Q4 2004 Investor Presentationomnicom group  Q4 2004 Investor Presentation
omnicom group Q4 2004 Investor Presentationfinance22
 
3231 2011 01_05_c_tw
3231 2011 01_05_c_tw3231 2011 01_05_c_tw
3231 2011 01_05_c_twyo9889
 
WESCO AR 2007
WESCO AR 2007WESCO AR 2007
WESCO AR 2007finance34
 
Apresentação inglês
Apresentação inglêsApresentação inglês
Apresentação inglêsParaná Banco
 
nordstrom AnnualReport2006
nordstrom AnnualReport2006nordstrom AnnualReport2006
nordstrom AnnualReport2006finance43
 
Apresentação Call 2Q08
Apresentação Call 2Q08Apresentação Call 2Q08
Apresentação Call 2Q08Arteris S.A.
 
omnicom group Q3 2004 Investor Presentation (pdf)
omnicom group  Q3 2004 Investor Presentation (pdf)omnicom group  Q3 2004 Investor Presentation (pdf)
omnicom group Q3 2004 Investor Presentation (pdf)finance22
 
03 31-2011 - 4 q10 and fy2010 conference call presentation
03 31-2011 - 4 q10 and fy2010 conference call presentation03 31-2011 - 4 q10 and fy2010 conference call presentation
03 31-2011 - 4 q10 and fy2010 conference call presentationArezzori
 
4 Q07 Results Presentation
4 Q07 Results Presentation4 Q07 Results Presentation
4 Q07 Results PresentationLocaliza
 
Top 20 social media savvy companies of f100
Top 20 social media savvy companies of f100Top 20 social media savvy companies of f100
Top 20 social media savvy companies of f100Jack Nargundkar
 

Tendances (13)

Social growth 5.15
Social growth 5.15Social growth 5.15
Social growth 5.15
 
Social growth 5.29
Social growth 5.29Social growth 5.29
Social growth 5.29
 
WESCO2006AR
WESCO2006ARWESCO2006AR
WESCO2006AR
 
omnicom group Q4 2004 Investor Presentation
omnicom group  Q4 2004 Investor Presentationomnicom group  Q4 2004 Investor Presentation
omnicom group Q4 2004 Investor Presentation
 
3231 2011 01_05_c_tw
3231 2011 01_05_c_tw3231 2011 01_05_c_tw
3231 2011 01_05_c_tw
 
WESCO AR 2007
WESCO AR 2007WESCO AR 2007
WESCO AR 2007
 
Apresentação inglês
Apresentação inglêsApresentação inglês
Apresentação inglês
 
nordstrom AnnualReport2006
nordstrom AnnualReport2006nordstrom AnnualReport2006
nordstrom AnnualReport2006
 
Apresentação Call 2Q08
Apresentação Call 2Q08Apresentação Call 2Q08
Apresentação Call 2Q08
 
omnicom group Q3 2004 Investor Presentation (pdf)
omnicom group  Q3 2004 Investor Presentation (pdf)omnicom group  Q3 2004 Investor Presentation (pdf)
omnicom group Q3 2004 Investor Presentation (pdf)
 
03 31-2011 - 4 q10 and fy2010 conference call presentation
03 31-2011 - 4 q10 and fy2010 conference call presentation03 31-2011 - 4 q10 and fy2010 conference call presentation
03 31-2011 - 4 q10 and fy2010 conference call presentation
 
4 Q07 Results Presentation
4 Q07 Results Presentation4 Q07 Results Presentation
4 Q07 Results Presentation
 
Top 20 social media savvy companies of f100
Top 20 social media savvy companies of f100Top 20 social media savvy companies of f100
Top 20 social media savvy companies of f100
 

Similaire à Social Media Scorecard Compares Top Airlines, Footwear Brands, Comics Publishers, Fast Food Chains

3 conference call 2 q08
3   conference call 2 q083   conference call 2 q08
3 conference call 2 q08Arteris S.A.
 
3 conference call 2 q08
3   conference call 2 q083   conference call 2 q08
3 conference call 2 q08Arteris S.A.
 
4 Q07 Results Presentation
4 Q07 Results Presentation4 Q07 Results Presentation
4 Q07 Results PresentationLocaliza
 
Apresentação 3 q11 e 9m11 eng
Apresentação 3 q11 e 9m11 engApresentação 3 q11 e 9m11 eng
Apresentação 3 q11 e 9m11 engLocaliza
 
11 10-2011 - 3 q11 conference call presentation
11 10-2011 - 3 q11 conference call presentation11 10-2011 - 3 q11 conference call presentation
11 10-2011 - 3 q11 conference call presentationArezzori
 
3 Q08 Results Presentation
3 Q08 Results Presentation3 Q08 Results Presentation
3 Q08 Results PresentationLocaliza
 
3 Q08 Results Presentation
3 Q08 Results Presentation3 Q08 Results Presentation
3 Q08 Results PresentationLocaliza
 
nordstrom AnnualReport2006
nordstrom AnnualReport2006nordstrom AnnualReport2006
nordstrom AnnualReport2006finance43
 
11/13/2007 - 3Q07 Earnings Call Presentation
11/13/2007  	-   	3Q07 Earnings Call Presentation11/13/2007  	-   	3Q07 Earnings Call Presentation
11/13/2007 - 3Q07 Earnings Call PresentationAES Tietê
 
Social growth 4.5
Social growth 4.5Social growth 4.5
Social growth 4.5Mike Lewis
 
Apresentação 2 t11 e 1s11 eng
Apresentação 2 t11 e 1s11 engApresentação 2 t11 e 1s11 eng
Apresentação 2 t11 e 1s11 engLocaliza
 
Final study of fantasy football landing pages
Final study of fantasy football landing pagesFinal study of fantasy football landing pages
Final study of fantasy football landing pagesRobert Sherron
 
2012 remax vs the industry
2012 remax vs the industry2012 remax vs the industry
2012 remax vs the industryLisa Borders
 
4Q10 Presentation eng
4Q10 Presentation eng4Q10 Presentation eng
4Q10 Presentation engLocaliza
 
Internet Usage
Internet UsageInternet Usage
Internet Usageguest73e9b
 
2 Q07 Results Presentation
2 Q07 Results Presentation2 Q07 Results Presentation
2 Q07 Results PresentationLocaliza
 
2 Q07 Results Presentation
2 Q07 Results Presentation2 Q07 Results Presentation
2 Q07 Results PresentationLocaliza
 

Similaire à Social Media Scorecard Compares Top Airlines, Footwear Brands, Comics Publishers, Fast Food Chains (20)

3 conference call 2 q08
3   conference call 2 q083   conference call 2 q08
3 conference call 2 q08
 
3 conference call 2 q08
3   conference call 2 q083   conference call 2 q08
3 conference call 2 q08
 
4 Q07 Results Presentation
4 Q07 Results Presentation4 Q07 Results Presentation
4 Q07 Results Presentation
 
Apresentação 3 q11 e 9m11 eng
Apresentação 3 q11 e 9m11 engApresentação 3 q11 e 9m11 eng
Apresentação 3 q11 e 9m11 eng
 
11 10-2011 - 3 q11 conference call presentation
11 10-2011 - 3 q11 conference call presentation11 10-2011 - 3 q11 conference call presentation
11 10-2011 - 3 q11 conference call presentation
 
3 Q08 Results Presentation
3 Q08 Results Presentation3 Q08 Results Presentation
3 Q08 Results Presentation
 
3 Q08 Results Presentation
3 Q08 Results Presentation3 Q08 Results Presentation
3 Q08 Results Presentation
 
nordstrom AnnualReport2006
nordstrom AnnualReport2006nordstrom AnnualReport2006
nordstrom AnnualReport2006
 
11/13/2007 - 3Q07 Earnings Call Presentation
11/13/2007  	-   	3Q07 Earnings Call Presentation11/13/2007  	-   	3Q07 Earnings Call Presentation
11/13/2007 - 3Q07 Earnings Call Presentation
 
Social growth 4.5
Social growth 4.5Social growth 4.5
Social growth 4.5
 
Social growth 4.5
Social growth 4.5Social growth 4.5
Social growth 4.5
 
Apresentação 2 t11 e 1s11 eng
Apresentação 2 t11 e 1s11 engApresentação 2 t11 e 1s11 eng
Apresentação 2 t11 e 1s11 eng
 
Final study of fantasy football landing pages
Final study of fantasy football landing pagesFinal study of fantasy football landing pages
Final study of fantasy football landing pages
 
2012 remax vs the industry
2012 remax vs the industry2012 remax vs the industry
2012 remax vs the industry
 
4Q10 Presentation eng
4Q10 Presentation eng4Q10 Presentation eng
4Q10 Presentation eng
 
Internet Usage
Internet UsageInternet Usage
Internet Usage
 
Internet Usage
Internet UsageInternet Usage
Internet Usage
 
Hcs 영문
Hcs 영문Hcs 영문
Hcs 영문
 
2 Q07 Results Presentation
2 Q07 Results Presentation2 Q07 Results Presentation
2 Q07 Results Presentation
 
2 Q07 Results Presentation
2 Q07 Results Presentation2 Q07 Results Presentation
2 Q07 Results Presentation
 

Plus de Mike Lewis

Retail Reality Check [Infographic]
Retail Reality Check [Infographic]Retail Reality Check [Infographic]
Retail Reality Check [Infographic]Mike Lewis
 
Stand Out SOcial Marketing - 4 Steps for a Social Marketing Audit
Stand Out SOcial Marketing - 4 Steps for a Social Marketing AuditStand Out SOcial Marketing - 4 Steps for a Social Marketing Audit
Stand Out SOcial Marketing - 4 Steps for a Social Marketing AuditMike Lewis
 
Keys to Great B2B Facebook Community #mpB2B
Keys to Great B2B Facebook Community #mpB2BKeys to Great B2B Facebook Community #mpB2B
Keys to Great B2B Facebook Community #mpB2BMike Lewis
 
Stand Out Social Marketing - eTraining 2013
Stand Out Social Marketing - eTraining 2013Stand Out Social Marketing - eTraining 2013
Stand Out Social Marketing - eTraining 2013Mike Lewis
 
The Six Keys to Stand Out Social Marketing
The Six Keys to Stand Out Social MarketingThe Six Keys to Stand Out Social Marketing
The Six Keys to Stand Out Social MarketingMike Lewis
 
Stand Out Social Marketing - FTB Evansville
Stand Out Social Marketing - FTB EvansvilleStand Out Social Marketing - FTB Evansville
Stand Out Social Marketing - FTB EvansvilleMike Lewis
 
Stand Out Social Marketing - FTB Atlanta
Stand Out Social Marketing - FTB AtlantaStand Out Social Marketing - FTB Atlanta
Stand Out Social Marketing - FTB AtlantaMike Lewis
 
Stand Out Social Marketing - Monetizing Social - FTB - Toledo
Stand Out Social Marketing - Monetizing Social - FTB - ToledoStand Out Social Marketing - Monetizing Social - FTB - Toledo
Stand Out Social Marketing - Monetizing Social - FTB - ToledoMike Lewis
 
Fusion Marketing - It's What's Next
Fusion Marketing - It's What's NextFusion Marketing - It's What's Next
Fusion Marketing - It's What's NextMike Lewis
 
Social Commerce: Secrets for Turning Social Media into Social Sales
Social Commerce: Secrets for Turning Social Media into Social SalesSocial Commerce: Secrets for Turning Social Media into Social Sales
Social Commerce: Secrets for Turning Social Media into Social SalesMike Lewis
 
Social Scoring: The Missing Link to Social Marketing ROI [Slides]
Social Scoring: The Missing Link to Social Marketing ROI [Slides]Social Scoring: The Missing Link to Social Marketing ROI [Slides]
Social Scoring: The Missing Link to Social Marketing ROI [Slides]Mike Lewis
 
Social growth 6/26
Social growth 6/26Social growth 6/26
Social growth 6/26Mike Lewis
 
A Framework for Social Media Analytics
A Framework for Social Media AnalyticsA Framework for Social Media Analytics
A Framework for Social Media AnalyticsMike Lewis
 
Social growth 4.10
Social growth 4.10Social growth 4.10
Social growth 4.10Mike Lewis
 
Social Marketing Roadmap [INFOGRAPHIC]
Social Marketing Roadmap [INFOGRAPHIC]Social Marketing Roadmap [INFOGRAPHIC]
Social Marketing Roadmap [INFOGRAPHIC]Mike Lewis
 
The Social Marketing Funnel
The Social Marketing FunnelThe Social Marketing Funnel
The Social Marketing FunnelMike Lewis
 
Top 5 Social Marketing Challenges Businesses Face - LikeableU
Top 5 Social Marketing Challenges Businesses Face - LikeableUTop 5 Social Marketing Challenges Businesses Face - LikeableU
Top 5 Social Marketing Challenges Businesses Face - LikeableUMike Lewis
 
Social Media Marketing Software Checklist
Social Media Marketing Software ChecklistSocial Media Marketing Software Checklist
Social Media Marketing Software ChecklistMike Lewis
 
Top 10 Ways Marketers can Use Foursquare from OMS 2011
Top 10 Ways Marketers can Use Foursquare from OMS 2011Top 10 Ways Marketers can Use Foursquare from OMS 2011
Top 10 Ways Marketers can Use Foursquare from OMS 2011Mike Lewis
 

Plus de Mike Lewis (19)

Retail Reality Check [Infographic]
Retail Reality Check [Infographic]Retail Reality Check [Infographic]
Retail Reality Check [Infographic]
 
Stand Out SOcial Marketing - 4 Steps for a Social Marketing Audit
Stand Out SOcial Marketing - 4 Steps for a Social Marketing AuditStand Out SOcial Marketing - 4 Steps for a Social Marketing Audit
Stand Out SOcial Marketing - 4 Steps for a Social Marketing Audit
 
Keys to Great B2B Facebook Community #mpB2B
Keys to Great B2B Facebook Community #mpB2BKeys to Great B2B Facebook Community #mpB2B
Keys to Great B2B Facebook Community #mpB2B
 
Stand Out Social Marketing - eTraining 2013
Stand Out Social Marketing - eTraining 2013Stand Out Social Marketing - eTraining 2013
Stand Out Social Marketing - eTraining 2013
 
The Six Keys to Stand Out Social Marketing
The Six Keys to Stand Out Social MarketingThe Six Keys to Stand Out Social Marketing
The Six Keys to Stand Out Social Marketing
 
Stand Out Social Marketing - FTB Evansville
Stand Out Social Marketing - FTB EvansvilleStand Out Social Marketing - FTB Evansville
Stand Out Social Marketing - FTB Evansville
 
Stand Out Social Marketing - FTB Atlanta
Stand Out Social Marketing - FTB AtlantaStand Out Social Marketing - FTB Atlanta
Stand Out Social Marketing - FTB Atlanta
 
Stand Out Social Marketing - Monetizing Social - FTB - Toledo
Stand Out Social Marketing - Monetizing Social - FTB - ToledoStand Out Social Marketing - Monetizing Social - FTB - Toledo
Stand Out Social Marketing - Monetizing Social - FTB - Toledo
 
Fusion Marketing - It's What's Next
Fusion Marketing - It's What's NextFusion Marketing - It's What's Next
Fusion Marketing - It's What's Next
 
Social Commerce: Secrets for Turning Social Media into Social Sales
Social Commerce: Secrets for Turning Social Media into Social SalesSocial Commerce: Secrets for Turning Social Media into Social Sales
Social Commerce: Secrets for Turning Social Media into Social Sales
 
Social Scoring: The Missing Link to Social Marketing ROI [Slides]
Social Scoring: The Missing Link to Social Marketing ROI [Slides]Social Scoring: The Missing Link to Social Marketing ROI [Slides]
Social Scoring: The Missing Link to Social Marketing ROI [Slides]
 
Social growth 6/26
Social growth 6/26Social growth 6/26
Social growth 6/26
 
A Framework for Social Media Analytics
A Framework for Social Media AnalyticsA Framework for Social Media Analytics
A Framework for Social Media Analytics
 
Social growth 4.10
Social growth 4.10Social growth 4.10
Social growth 4.10
 
Social Marketing Roadmap [INFOGRAPHIC]
Social Marketing Roadmap [INFOGRAPHIC]Social Marketing Roadmap [INFOGRAPHIC]
Social Marketing Roadmap [INFOGRAPHIC]
 
The Social Marketing Funnel
The Social Marketing FunnelThe Social Marketing Funnel
The Social Marketing Funnel
 
Top 5 Social Marketing Challenges Businesses Face - LikeableU
Top 5 Social Marketing Challenges Businesses Face - LikeableUTop 5 Social Marketing Challenges Businesses Face - LikeableU
Top 5 Social Marketing Challenges Businesses Face - LikeableU
 
Social Media Marketing Software Checklist
Social Media Marketing Software ChecklistSocial Media Marketing Software Checklist
Social Media Marketing Software Checklist
 
Top 10 Ways Marketers can Use Foursquare from OMS 2011
Top 10 Ways Marketers can Use Foursquare from OMS 2011Top 10 Ways Marketers can Use Foursquare from OMS 2011
Top 10 Ways Marketers can Use Foursquare from OMS 2011
 

Dernier

Church Building Grants To Assist With New Construction, Additions, And Restor...
Church Building Grants To Assist With New Construction, Additions, And Restor...Church Building Grants To Assist With New Construction, Additions, And Restor...
Church Building Grants To Assist With New Construction, Additions, And Restor...Americas Got Grants
 
1911 Gold Corporate Presentation Apr 2024.pdf
1911 Gold Corporate Presentation Apr 2024.pdf1911 Gold Corporate Presentation Apr 2024.pdf
1911 Gold Corporate Presentation Apr 2024.pdfShaun Heinrichs
 
Effective Strategies for Maximizing Your Profit When Selling Gold Jewelry
Effective Strategies for Maximizing Your Profit When Selling Gold JewelryEffective Strategies for Maximizing Your Profit When Selling Gold Jewelry
Effective Strategies for Maximizing Your Profit When Selling Gold JewelryWhittensFineJewelry1
 
How Generative AI Is Transforming Your Business | Byond Growth Insights | Apr...
How Generative AI Is Transforming Your Business | Byond Growth Insights | Apr...How Generative AI Is Transforming Your Business | Byond Growth Insights | Apr...
How Generative AI Is Transforming Your Business | Byond Growth Insights | Apr...Hector Del Castillo, CPM, CPMM
 
Appkodes Tinder Clone Script with Customisable Solutions.pptx
Appkodes Tinder Clone Script with Customisable Solutions.pptxAppkodes Tinder Clone Script with Customisable Solutions.pptx
Appkodes Tinder Clone Script with Customisable Solutions.pptxappkodes
 
digital marketing , introduction of digital marketing
digital marketing , introduction of digital marketingdigital marketing , introduction of digital marketing
digital marketing , introduction of digital marketingrajputmeenakshi733
 
The-Ethical-issues-ghhhhhhhhjof-Byjus.pptx
The-Ethical-issues-ghhhhhhhhjof-Byjus.pptxThe-Ethical-issues-ghhhhhhhhjof-Byjus.pptx
The-Ethical-issues-ghhhhhhhhjof-Byjus.pptxmbikashkanyari
 
Types of Cyberattacks - ASG I.T. Consulting.pdf
Types of Cyberattacks - ASG I.T. Consulting.pdfTypes of Cyberattacks - ASG I.T. Consulting.pdf
Types of Cyberattacks - ASG I.T. Consulting.pdfASGITConsulting
 
Healthcare Feb. & Mar. Healthcare Newsletter
Healthcare Feb. & Mar. Healthcare NewsletterHealthcare Feb. & Mar. Healthcare Newsletter
Healthcare Feb. & Mar. Healthcare NewsletterJamesConcepcion7
 
PSCC - Capability Statement Presentation
PSCC - Capability Statement PresentationPSCC - Capability Statement Presentation
PSCC - Capability Statement PresentationAnamaria Contreras
 
The McKinsey 7S Framework: A Holistic Approach to Harmonizing All Parts of th...
The McKinsey 7S Framework: A Holistic Approach to Harmonizing All Parts of th...The McKinsey 7S Framework: A Holistic Approach to Harmonizing All Parts of th...
The McKinsey 7S Framework: A Holistic Approach to Harmonizing All Parts of th...Operational Excellence Consulting
 
Welding Electrode Making Machine By Deccan Dynamics
Welding Electrode Making Machine By Deccan DynamicsWelding Electrode Making Machine By Deccan Dynamics
Welding Electrode Making Machine By Deccan DynamicsIndiaMART InterMESH Limited
 
GUIDELINES ON USEFUL FORMS IN FREIGHT FORWARDING (F) Danny Diep Toh MBA.pdf
GUIDELINES ON USEFUL FORMS IN FREIGHT FORWARDING (F) Danny Diep Toh MBA.pdfGUIDELINES ON USEFUL FORMS IN FREIGHT FORWARDING (F) Danny Diep Toh MBA.pdf
GUIDELINES ON USEFUL FORMS IN FREIGHT FORWARDING (F) Danny Diep Toh MBA.pdfDanny Diep To
 
EUDR Info Meeting Ethiopian coffee exporters
EUDR Info Meeting Ethiopian coffee exportersEUDR Info Meeting Ethiopian coffee exporters
EUDR Info Meeting Ethiopian coffee exportersPeter Horsten
 
Unveiling the Soundscape Music for Psychedelic Experiences
Unveiling the Soundscape Music for Psychedelic ExperiencesUnveiling the Soundscape Music for Psychedelic Experiences
Unveiling the Soundscape Music for Psychedelic ExperiencesDoe Paoro
 
WSMM Technology February.March Newsletter_vF.pdf
WSMM Technology February.March Newsletter_vF.pdfWSMM Technology February.March Newsletter_vF.pdf
WSMM Technology February.March Newsletter_vF.pdfJamesConcepcion7
 
Guide Complete Set of Residential Architectural Drawings PDF
Guide Complete Set of Residential Architectural Drawings PDFGuide Complete Set of Residential Architectural Drawings PDF
Guide Complete Set of Residential Architectural Drawings PDFChandresh Chudasama
 
Intermediate Accounting, Volume 2, 13th Canadian Edition by Donald E. Kieso t...
Intermediate Accounting, Volume 2, 13th Canadian Edition by Donald E. Kieso t...Intermediate Accounting, Volume 2, 13th Canadian Edition by Donald E. Kieso t...
Intermediate Accounting, Volume 2, 13th Canadian Edition by Donald E. Kieso t...ssuserf63bd7
 
NAB Show Exhibitor List 2024 - Exhibitors Data
NAB Show Exhibitor List 2024 - Exhibitors DataNAB Show Exhibitor List 2024 - Exhibitors Data
NAB Show Exhibitor List 2024 - Exhibitors DataExhibitors Data
 
Introducing the Analogic framework for business planning applications
Introducing the Analogic framework for business planning applicationsIntroducing the Analogic framework for business planning applications
Introducing the Analogic framework for business planning applicationsKnowledgeSeed
 

Dernier (20)

Church Building Grants To Assist With New Construction, Additions, And Restor...
Church Building Grants To Assist With New Construction, Additions, And Restor...Church Building Grants To Assist With New Construction, Additions, And Restor...
Church Building Grants To Assist With New Construction, Additions, And Restor...
 
1911 Gold Corporate Presentation Apr 2024.pdf
1911 Gold Corporate Presentation Apr 2024.pdf1911 Gold Corporate Presentation Apr 2024.pdf
1911 Gold Corporate Presentation Apr 2024.pdf
 
Effective Strategies for Maximizing Your Profit When Selling Gold Jewelry
Effective Strategies for Maximizing Your Profit When Selling Gold JewelryEffective Strategies for Maximizing Your Profit When Selling Gold Jewelry
Effective Strategies for Maximizing Your Profit When Selling Gold Jewelry
 
How Generative AI Is Transforming Your Business | Byond Growth Insights | Apr...
How Generative AI Is Transforming Your Business | Byond Growth Insights | Apr...How Generative AI Is Transforming Your Business | Byond Growth Insights | Apr...
How Generative AI Is Transforming Your Business | Byond Growth Insights | Apr...
 
Appkodes Tinder Clone Script with Customisable Solutions.pptx
Appkodes Tinder Clone Script with Customisable Solutions.pptxAppkodes Tinder Clone Script with Customisable Solutions.pptx
Appkodes Tinder Clone Script with Customisable Solutions.pptx
 
digital marketing , introduction of digital marketing
digital marketing , introduction of digital marketingdigital marketing , introduction of digital marketing
digital marketing , introduction of digital marketing
 
The-Ethical-issues-ghhhhhhhhjof-Byjus.pptx
The-Ethical-issues-ghhhhhhhhjof-Byjus.pptxThe-Ethical-issues-ghhhhhhhhjof-Byjus.pptx
The-Ethical-issues-ghhhhhhhhjof-Byjus.pptx
 
Types of Cyberattacks - ASG I.T. Consulting.pdf
Types of Cyberattacks - ASG I.T. Consulting.pdfTypes of Cyberattacks - ASG I.T. Consulting.pdf
Types of Cyberattacks - ASG I.T. Consulting.pdf
 
Healthcare Feb. & Mar. Healthcare Newsletter
Healthcare Feb. & Mar. Healthcare NewsletterHealthcare Feb. & Mar. Healthcare Newsletter
Healthcare Feb. & Mar. Healthcare Newsletter
 
PSCC - Capability Statement Presentation
PSCC - Capability Statement PresentationPSCC - Capability Statement Presentation
PSCC - Capability Statement Presentation
 
The McKinsey 7S Framework: A Holistic Approach to Harmonizing All Parts of th...
The McKinsey 7S Framework: A Holistic Approach to Harmonizing All Parts of th...The McKinsey 7S Framework: A Holistic Approach to Harmonizing All Parts of th...
The McKinsey 7S Framework: A Holistic Approach to Harmonizing All Parts of th...
 
Welding Electrode Making Machine By Deccan Dynamics
Welding Electrode Making Machine By Deccan DynamicsWelding Electrode Making Machine By Deccan Dynamics
Welding Electrode Making Machine By Deccan Dynamics
 
GUIDELINES ON USEFUL FORMS IN FREIGHT FORWARDING (F) Danny Diep Toh MBA.pdf
GUIDELINES ON USEFUL FORMS IN FREIGHT FORWARDING (F) Danny Diep Toh MBA.pdfGUIDELINES ON USEFUL FORMS IN FREIGHT FORWARDING (F) Danny Diep Toh MBA.pdf
GUIDELINES ON USEFUL FORMS IN FREIGHT FORWARDING (F) Danny Diep Toh MBA.pdf
 
EUDR Info Meeting Ethiopian coffee exporters
EUDR Info Meeting Ethiopian coffee exportersEUDR Info Meeting Ethiopian coffee exporters
EUDR Info Meeting Ethiopian coffee exporters
 
Unveiling the Soundscape Music for Psychedelic Experiences
Unveiling the Soundscape Music for Psychedelic ExperiencesUnveiling the Soundscape Music for Psychedelic Experiences
Unveiling the Soundscape Music for Psychedelic Experiences
 
WSMM Technology February.March Newsletter_vF.pdf
WSMM Technology February.March Newsletter_vF.pdfWSMM Technology February.March Newsletter_vF.pdf
WSMM Technology February.March Newsletter_vF.pdf
 
Guide Complete Set of Residential Architectural Drawings PDF
Guide Complete Set of Residential Architectural Drawings PDFGuide Complete Set of Residential Architectural Drawings PDF
Guide Complete Set of Residential Architectural Drawings PDF
 
Intermediate Accounting, Volume 2, 13th Canadian Edition by Donald E. Kieso t...
Intermediate Accounting, Volume 2, 13th Canadian Edition by Donald E. Kieso t...Intermediate Accounting, Volume 2, 13th Canadian Edition by Donald E. Kieso t...
Intermediate Accounting, Volume 2, 13th Canadian Edition by Donald E. Kieso t...
 
NAB Show Exhibitor List 2024 - Exhibitors Data
NAB Show Exhibitor List 2024 - Exhibitors DataNAB Show Exhibitor List 2024 - Exhibitors Data
NAB Show Exhibitor List 2024 - Exhibitors Data
 
Introducing the Analogic framework for business planning applications
Introducing the Analogic framework for business planning applicationsIntroducing the Analogic framework for business planning applications
Introducing the Analogic framework for business planning applications
 

Social Media Scorecard Compares Top Airlines, Footwear Brands, Comics Publishers, Fast Food Chains

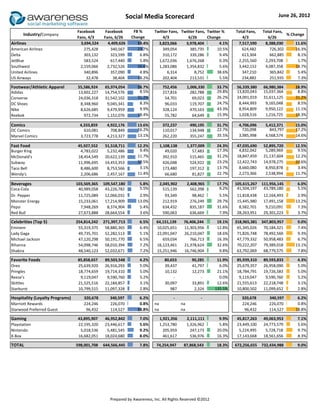
  • 1. Social Media Scorecard June 26, 2012 Facebook Facebook FB % Twitter Fans, Twitter Fans, Twitter % Total Fans, Total Fans, Industry/Company % Change Fans, 4/3 Fans, 6/26 Change 4/3 6/26 Change 4/3 6/26 Airlines 3,694,524 4,409,626 19.4% 3,823,066 3,978,404 4.1% 7,517,590 8,388,030 11.6% American Airlines 275,428 340,567 23.7% 349,054 385,735 10.5% 624,482 726,302 16.3% Delta 303,132 323,599 6.8% 310,172 339,286 9.4% 613,304 662,885 8.1% JetBlue 583,524 617,440 5.8% 1,672,036 1,676,268 0.3% 2,255,560 2,293,708 1.7% Southwest 2,159,066 2,732,526 26.6% 1,283,086 1,354,832 5.6% 3,442,152 4,087,358 18.7% United Airlines 340,896 357,090 4.8% 6,314 8,752 38.6% 347,210 365,842 5.4% US Airways 32,478 3,694,524 38,404 4,409,626 18.2% 19.4% - 202,404 3,823,066 213,531 5.5% 3,978,404 4.1% - 234,882 7,517,590 251,935 8,388,030 7.3% 11.6% TOTAL Footwear/Athletic Apparel 55,586,924 65,974,054 18.7% 752,456 1,006,330 33.7% 56,339,380 66,980,384 18.9% Adidas 13,602,227 14,754,576 8.5% 217,816 282,788 29.8% 13,820,043 15,037,364 8.8% Converse 24,036,318 31,542,102 31.2% 54,701 69,023 26.2% 24,091,019 31,611,125 31.2% DC Shoes 8,348,960 9,045,341 8.3% 96,033 119,707 24.7% 8,444,993 9,165,048 8.5% Nike 8,626,685 9,479,959 9.9% 328,124 470,163 43.3% 8,954,809 9,950,122 11.1% Reebok 972,734 1,152,076 18.4% 55,782 64,649 15.9% 1,028,516 1,216,725 18.3% 55,586,924 65,974,054 18.7% - 752,456 1,006,330 33.7% - 56,339,380 66,980,384 18.9% TOTAL Comics 4,333,859 4,922,176 13.6% 372,237 490,195 31.7% 4,706,096 5,412,371 15.0% DC Comics 610,081 708,849 16.2% 110,017 134,948 22.7% 720,098 843,797 17.2% Marvel Comics 3,723,778 4,213,327 13.1% 262,220 355,247 35.5% 3,985,998 4,568,574 14.6% 4,333,859 4,922,176 13.6% - 372,237 490,195 31.7% - 4,706,096 5,412,371 15.0% TOTAL Fast Food 45,927,552 51,518,711 12.2% 1,108,138 1,377,009 24.3% 47,035,690 52,895,720 12.5% Burger King 4,783,022 5,232,486 9.4% 49,020 57,483 17.3% 4,832,042 5,289,969 9.5% McDonald's 18,454,549 20,622,139 11.7% 392,910 515,465 31.2% 18,847,459 21,137,604 12.2% Subway 11,996,695 14,453,353 20.5% 426,048 524,922 23.2% 12,422,743 14,978,275 20.6% Taco Bell 8,486,600 8,753,566 3.1% 173,480 197,312 13.7% 8,660,080 8,950,878 3.4% Wendy's 2,206,686 2,457,167 11.4% 66,680 81,827 22.7% 2,273,366 2,538,994 11.7% 45,927,552 51,518,711 12.2% - 1,108,138 1,377,009 24.3% - 47,035,690 52,895,720 12.5% TOTAL Beverages 103,569,365 109,547,180 5.8% 2,045,902 2,408,965 17.7% 105,615,267 111,956,145 6.0% Coca-Cola 40,989,058 43,226,782 5.5% 515,139 562,398 9.2% 41,504,197 43,789,180 5.5% Dr. Pepper 11,725,089 12,066,031 2.9% 93,349 98,462 5.5% 11,818,438 12,164,493 2.9% Monster Energy 15,233,061 17,214,909 13.0% 212,919 276,249 29.7% 15,445,980 17,491,158 13.2% Pepsi 7,948,269 8,374,904 5.4% 634,432 835,187 31.6% 8,582,701 9,210,091 7.3% Red Bull 27,673,888 28,664,554 3.6% 590,063 636,669 7.9% 28,263,951 29,301,223 3.7% 103,569,365 109,547,180 5.8% - 2,045,902 2,408,965 17.7% - 105,615,267 111,956,145 6.0% TOTAL Celebrities (Top 5) 254,814,242 271,397,713 6.5% 64,151,139 76,406,244 19.1% 318,965,381 347,803,957 9.0% Eminem 55,319,375 58,880,365 6.4% 10,025,651 11,303,956 12.8% 65,345,026 70,184,321 7.4% Lady Gaga 49,735,701 52,282,513 5.1% 22,091,047 26,210,047 18.6% 71,826,748 78,492,560 9.3% Michael Jackson 47,120,298 50,191,770 6.5% 659,034 766,713 16.3% 47,779,332 50,958,483 6.7% Rihanna 54,098,746 58,010,394 7.2% 16,123,461 21,378,624 32.6% 70,222,207 79,389,018 13.1% Shakira 48,540,123 52,032,671 7.2% 15,251,946 16,746,904 9.8% 63,792,069 68,779,575 7.8% 254,814,242 271,397,713 6.5% - 64,151,139 76,406,244 19.1% - 318,965,381 347,803,957 9.0% TOTAL Favorite Foods 85,858,657 89,503,548 4.2% 80,653 90,285 11.9% 85,939,310 89,593,833 4.3% Oreo 25,639,920 26,916,293 5.0% 39,437 41,797 6.0% 25,679,357 26,958,090 5.0% Pringles 18,774,659 19,714,310 5.0% 10,132 12,273 21.1% 18,784,791 19,726,583 5.0% Reese's 9,119,047 9,590,760 5.2% - - 0.0% 9,119,047 9,590,760 5.2% Skittles 21,525,516 22,184,857 3.1% 30,097 33,891 12.6% 21,555,613 22,218,748 3.1% Starburst 10,799,515 11,097,328 2.8% 987 2,324 135.5% 10,800,502 11,099,652 2.8% 85,858,657 89,503,548 4.2% - 80,653 90,285 11.9% - 85,939,310 89,593,833 4.3% TOTAL Hospitality (Loyalty Programs) 320,678 340,597 6.2% - - 320,678 340,597 6.2% Marriott Rewards 224,246 226,070 0.8% na na 224,246 226,070 0.8% Starwood Preferred Guest 96,432 114,527 18.8% na na 96,432 114,527 18.8% 320,678 340,597 6.2% - - - 0.0% - 320,678 340,597 6.2% TOTAL Gaming 43,895,907 46,952,842 7.0% 1,921,356 2,111,111 9.9% 45,817,263 49,063,953 7.1% Playstation 22,195,320 23,446,617 5.6% 1,253,780 1,326,962 5.8% 23,449,100 24,773,579 5.6% Nintendo 5,018,536 5,481,545 9.2% 205,959 247,173 20.0% 5,224,495 5,728,718 9.7% X-Box 16,682,051 18,024,680 8.0% 461,617 536,976 16.3% 17,143,668 18,561,656 8.3% TOTAL 43,895,907 46,952,842 7.0% - 1,921,356 2,111,111 9.9% - 45,817,263 49,063,953 7.1% TOTAL 598,001,708 644,566,445 7.8% 74,254,947 87,868,543 18.3% 672,256,655 732,434,988 9.0% Prepared by Awareness, Inc. All Rights Reserved ©2012