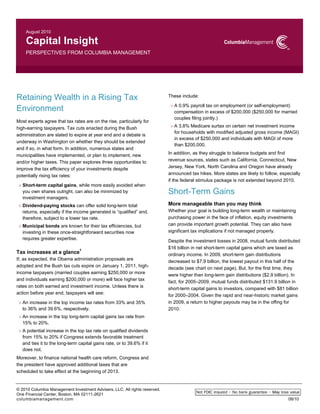
2. 2
Estimated total distributions from open-end mutual
funds (excluding money market funds) 2000-2009
($ millions)
Source: Lipper, a Thomson Reuters Company, December 2009
Tax implications
Like regular income, net short-term capital gains are taxed at
an investor’s ordinary income tax rate. The highest-income
earners should be aware that the proposed maximum tax rate
is 39.6% in 2011 (see table below). When an investment
distributes short-term gains there can be significant tax
implications.
Source: Internal Revenue Service
For example, assume an investor owns 100 shares of the XYZ
Strategy, which is priced at $10 per share. At the close of
business, XYZ distributes a $2 per share short-term capital
gain. If the shareholder chooses to have all income and gains
reinvested, the account value is calculated as follows:
The above example is hypothetical.
Managing short-term gain distributions
Taxes cut into investment returns — whether they are triggered
by short-term gains, long-term gains or ordinary income such
as income from a taxable bond fund. On average over the past
10 years, it is estimated that equity fund investors gave up
nearly a full percentage point of return each year due to taxes
4
(see next page, “Tax drag on equity returns”). In 2009 alone,
investors paid approximately $736.2 million in short-term capital
gains taxes, compared with $148.9 million in long-term capital
gains taxes (for doing nothing more than holding the investment
for a longer period of time).
5
While some taxable events are unavoidable, short-term capital
gain distributions can be quite manageable. These distributions
can be minimized if the investment manager takes certain
deliberate actions:
> Educate portfolio management teams on the significant
value that can be retained by avoiding short-term gain
distributions.
> Incent the investment teams by tying a portion of their
compensation to after-tax returns.
> Invest in technology that helps the investment teams identify
specific lots within position holdings that, when sold, will
result in the best after-tax outcome for shareholders.
$0
$100,000
$200,000
$300,000
$400,000
$500,000
$600,000
Short‐Term Cap Gains Long‐Term Cap Gains
Income Distribution Return of Capital
Total
Initial value 100 shares x$10 per share $1,000
Amount to be reinvested 100 shares x$2 per share capital gain $200
Net asset value (NAV) on ex-
dividend date $10 initial price - $2 distribution $8
Additional shares to the investor $200 reinvestment amount / $8 NAVper share 25 shares
Account value on ex-dividend date 125 shares x$8 per share $1,000
Taxliability
$200 short-term capital gain x0.35 (35% tax
rate) $70
After-taxvalue $1,000 - $70 $930
Tax liability if the distribution were
a long-term gain instead
$200 long-term capital gain x 0.15 (15% tax
rate) $30
After-tax value if the distribution
were a long-term gain instead $1,000 - $30 $970
Distribution type
Current maximum
tax rate
Scheduled
maximum tax rate
for 2011
OrdinaryDividend 35% 39.6%
Qualified Dividend Distribution 15% 20%/39.6%3
Short-Term Capital Gain 35% 39.6%
Long-Term Capital Gain 15% 20%
Return of Capital
Generallynot
taxable
Generallynot
taxable
Tax Rates on Distributions2
3. 3
In today’s rising tax environment, we believe that investors will
be better served by managers who understand the need to
minimize short-term capital gains distributions and have the
incentives and technology in place to help portfolio
management teams achieve the objectives in a tax-efficient
way.
Steps to take:
> Look for strategies that manage short-term capital gain
distributions.
> Seek out investment managers who are incented to be
tax-efficient.
Dividend-Paying Stocks
Opportunity for buy-and-hold investors
Another opportunity for investors to build wealth, in spite of
rising taxes, lies in dividend-paying stocks. However, this
strategy works better if the stocks are held long enough for the
dividend to be considered qualified. Qualified dividends are
currently subject to a maximum 15% tax rate, but will likely be
increasing to a 20% rate in 2011, if Congress extends the
favorable tax treatment for qualified dividends and taxes them
at the scheduled long-term capital gains rate. Nonqualified
dividends are taxed at the investor’s ordinary income tax rate.
In order for dividends to be considered qualified, the stock must
be owned for more than 60 days during the 121-day period
around the ex-dividend date.
Quality counts
Although many dividend-paying companies offer this potential
tax advantage, dividend-paying stocks should be carefully
scrutinized. Companies that consistently pay dividends and
make a habit of raising them have historically outperformed
the market, while companies that cut dividends have
underperformed. A growing, sustainable dividend often means
a company’s management team is wisely using free cash flow
to return value to shareholders. This factors substantially into
return and can act as a stabilizing force in volatile markets.
The tax drag on equity returns
According to Lipper, over the past 10 years,
investors in equity funds have given up an
average of 98 basis points (each basis point is
equal to 1/100 of a percentage point of return)
each year to taxes.
6
How does that translate into
dollars? Consider a hypothetical $1 million
investment in each of two strategies:
> Strategy A earns the same returns as the
S&P 500 but makes no distributions (that
is, incurs no tax consequences for
investors)
> Strategy B makes average equity fund
capital gains and dividend distributions
Over the full 10-year period, investors in Strategy
B would have paid $88,000 in taxes. Over the
latest five-year period, the tax drag would have
been $50,000. Clearly, strategies that carefully
manage their distributions can add significant
value for investors.
60 days 60 daysEx-dividend
Own the stock for more than 60 consecutive days
during this period, so that the dividend payment
may qualify for the lower tax rate.
4. 4
Return of S&P 500 Stocks by Dividend Policy
Source: Ned Davis Research, Inc., June 1985-June 2010
Dividend-paying stocks can be useful in building wealth in both
the accumulation and distribution stages. These stocks can be
a high-quality source of total return, especially when investors
reinvest the dividends so they can compound over time.
Likewise, the stocks can be a reliable source of income for
retirees. Whether tax rates are going up or down, there can be
a benefit to investing in quality, dividend-paying companies.
Steps to take:
> Look for equity strategies that invest in high-quality
dividend-paying stocks.
> Seek out investment managers who distribute qualified
dividends whenever possible.
Municipal Bonds
Value of tax-free income is likely to rise
Investment income that is not subject to taxation has
widespread appeal, especially for retirees who maybe more
dependent on the income provided by their investments. If, as
expected, the maximum federal tax rate reverts to its pre-2002
level of 39.6% in January 2011, investors in the top tax bracket
are likely to find the tax-exempt income provided by municipal
bonds more valuable than in the past. Keep in mind that while
interest income from municipal bonds is exempt from federal
income tax, the interest on certain private activity bonds may be
subject to alternative minimum tax. One way to see the value of
tax-exempt income is to calculate Tax-Equivalent Yield (TEY),
using different tax rates. The TEY compares what a taxable
bond would have to yield in order to provide the same after-tax
income as a tax-free bond. TEY can be readily calculated by
dividing the yield of a municipal bond by one minus the tax rate.
For example:
States generally exempt municipal bond interest from state
income taxes if the bond is issued by that state, its agencies or
political subdivisions but tax the interest from out-of-state
bonds. Special rules apply to bonds held in mutual funds. If the
interest from the bonds is exempt from state taxes, the TEY is
even higher.
Stable asset class
There is more to a municipal bond than its tax-exempt income.
The credit quality of the issuing entity is also a critical factor.
Municipal bonds are issued by cities, states or counties in order
to raise funds, typically for long-term capital projects. In today’s
economy, many municipalities are faced with growing deficits
and demographic constraints. As a result, fears of widespread
municipal bankruptcies have recently made their way into the
media.
$000
$500
$1000
$1500
Dividend Growers and Initiators: Annual Gain = 8.7% ($100 grows to $808) Annualized Standard Deviation =
15.93%
Non Dividend‐Paying Stocks: Annual Gain = 0.5% ($100 grows to $114) Annualized Standard Deviation =
24.60%
S&P 500 Geometric Equal‐Weighted Total Return Index: Annual Gain = 5.7% ($100 Grows To $402) Annualized
Standard Deviation = 18.01%
Tax-free yield
Federal
tax rate7
Taxable equivalent
yield (TEY)
4.00% 35% 6.15%
4.00% 39.6% 6.62%
5. 5
In reality, municipal bankruptcies have been very rare. Only
0.06% annually of all investment-grade municipal entities
defaulted between 1970 and 2009. The municipal bankruptcy
process is complex and differs considerably from corporate
bankruptcy filings. Moreover, municipalities do not want to lose
bond market access, which is viewed as a vital, low-cost
method of funding government projects. When municipalities
get into trouble, certain state mechanisms, such as fiscal
control boards, can be better, less-costly alternatives to
bankruptcy. As a result, municipal bankruptcies are far less
common and damaging than corporate bankruptcies.
Nevertheless, the municipal bond landscape has become more
difficult to navigate. With more than 50,000 municipal bonds
in the marketplace today, active professional management
that includes diligent credit research, issue selection and
monitoring, and stress testing, is more crucial than ever. A
dedicated investment management team that conducts in-depth
due diligence on its municipal securities may help you achieve
better, less-volatile investment outcomes.
Supply and demand in municipals
The supply/demand balance is currently quite favorable for
municipal bond investors. Although municipal supply rose
considerably in 2009, the largest increase came from taxable
municipal securities issued under the Build America Bonds
(BABs) program. The BABs program offers governmental
issuers a federal tax credit on the interest cost associated with
issuing taxable municipals in place of tax-exempt bonds. The
program was designed to lower the capital costs of municipal
issuers by expanding the market for their tax-exempt bonds to
buyers of taxable bonds. Consequently, supply was diverted
from the tax-exempt market into the taxable market, as nearly
$100 billion of $400 billion in total municipal issuance in 2009
was due to BABs.
Overall, the combination of higher demand caused by
increasing tax rates and lower supply resulting from the BABs
program may result in good relative performance for municipal
bonds.
Steps to take:
> Select municipal bond funds that are supported by
diligent credit research.
> Use investment managers who remain current on the
dynamics of today’s municipal market.
Build America Bonds issuance is anticipated to
increase as it replaces a portion of tax-exempt bonds.
6. 6
Tax awareness
Plan ahead for new and higher taxes
A combination of tax-smart strategies can help you retain
wealth despite rising taxes — whether you are building wealth
or drawing it down:
> Short-term capital gains can be virtually eliminated during
normal equity markets.
> Qualified dividends are subject to a lower tax rate through
2010 and potentially beyond.
> Municipal securities can provide attractive tax-exempt
income.
Ask your financial advisor to help you take appropriate action
now to keep you a step ahead of tax hikes and preserve more
of your wealth.
Tax-efficient strategies for life
Accumulation phase investors are focused
primarily on building wealth for later life goals.
> Minimize short-term capital gains
distributions when possible.
> Invest in dividend-paying stocks through
strategies that primarily distribute
qualified dividends. Reinvest the
dividends to benefit from compounding.
> Consider municipal bond funds for assets
that cannot be sheltered in tax-deferred
accounts.
Distribution phase investors are living off of the
assets they have accumulated and typically need
reliable sources of income.
> Place equity assets in strategies that
incent and equip their investment
managers to minimize short-term capital
gains distributions.
> Consider dividend-paying stocks through
strategies that make primarily qualified
dividend distributions.
> Invest in municipal bond funds through
investment managers who conduct
diligent credit research.
7. 7
1
Under current law, the Bush tax cuts are set to expire for all taxpayers. Under the Obama administration’s proposals, the tax cuts would only
be allowed to expire for higher-income taxpayers to the extent they are in the highest two tax brackets (which would start at $250,000 less the
standard deduction and two personal exemptions for married taxpayers filing jointly; $200,000 less the standard deduction and one personal
exemption for single filers).
2
It is expected that the 39.6% rate will apply to individuals or married couples in 2011 with taxable incomes in excess of $373,650.
3
The maximum tax rate could be 20% if Congress extends favorable treatment of qualified dividends and ties it to the scheduled long-term
capital gains rate, or 39.6% if favorable treatment is allowed to expire.
4
Source: Lipper, A Thomson Reuters Company. “Taxes in the Mutual Fund Industry — 2010: Assessing the Impact of Taxes on Shareholders’
Returns.”
5, 6
Ibid, 2009
7
The effective tax rate for individuals in the highest federal income tax bracket may be higher than the rates shown here once other tax factors
are taken into account, for example, state and local income taxes, the phaseouts for personal exemptions and interest deductions (scheduled
to reappear in 2011) and the new 3.8% Medicare surtax (scheduled to appear in 2013), etc.
Investors should consider the investment objectives, risks, charges and expenses of a mutual fund
carefully before investing. For a free prospectus, which contains this and other important information
about the funds, visit columbiamanagement.com. Read the prospectus carefully before investing.
The views expressed are as of the date given, may change as market or other conditions change, and may differ from views expressed by
other Columbia Management Investment Advisers, LLC (CMIA) associates or affiliates. Actual investments or investment decisions made by
CMIA and its affiliates, whether for its own account or on behalf of clients, will not necessarily reflect the views expressed. This information is
not intended to provide investment advice and does not account for individual investor circumstances. Investment decisions should always be
made based on an investor's specific financial needs, objectives, goals, time horizon, and risk tolerance. Asset classes described may not be
suitable for all investors. Past performance does not guarantee future results and no forecast should be considered a guarantee either. Since
economic and market conditions change frequently, there can be no assurance that the trends described here will continue or that the
forecasts are accurate.
Columbia Management Investment Advisers, LLC and its affiliates do not offer tax or legal advice. Consult with your tax advisor or attorney
regarding your specific situation.
On April 30, 2010, Ameriprise Financial, Inc., the parent company of RiverSource Investments, LLC, acquired the long-term asset management
business of Columbia Management Group, LLC, including certain of its affiliates, which were, prior to this acquisition, part of Bank of America.
In connection with the acquisition of the long-term assets, certain clients of Columbia Management Advisors, LLC have a new investment
adviser, RiverSource Investments, LLC, which is now known as Columbia Management Investment Advisers, LLC. For those clients that use
the services of a sub adviser, those arrangements are continuing unless notified otherwise.
Source of chart data on page four: Ned Davis Research, 06/30/10. Based on equal-weighted geometric average of total return of dividend-
paying and non-dividend-paying historical S&P 500 Index stocks, rebalanced annually. Uses annual dividends to identify dividend-paying
stocks and changes on a calendar year basis. The performance shown represents the risk-return characteristics of each of the categories with
annualized standard deviation (measure of risk) measured on the x-axis and average annualized return measured on the y-axis. Risk is
represented by standard deviation, a statistical measure of performance fluctuations. Generally the higher the standard deviation, the greater
the expected volatility of returns.
Investment products are not federally or FDIC-insured, are not deposits or obligations of, or guaranteed by any financial institution, and involve
investment risks including possible loss of principal and fluctuation in value.
Securities products offered through Columbia Management Investment Distributors, Inc. (formerly known as RiverSource Fund Distributors,
Inc.), member FINRA. Advisory services provided by Columbia Management Investment Advisers, LLC (formerly known as RiverSource
Investments, LLC).