1. Unit 2 – Data Analysis & Interpretation
Consumer Mathematics 30S
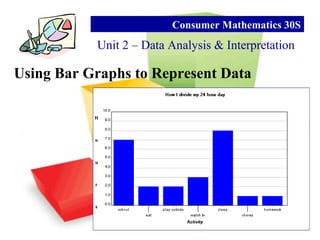
Using Bar Graphs to Represent Data
2. Discussion Questions:
Assume that you are the Chief of
Police for the town of Columbia.
When you were hired in 1993, you
made a commitment to make sure
crime did not “get out of control.”
The town council has asked you to
report on crime trends over the past
five years. Which graph would you
choose to use in your presentation?
Why did you choose this one?
Unit 2 – Data Analysis & Interpretation
Consumer Mathematics 30S
3. Bar Graphs
Data can be displayed in a number of different
ways. One could make a chart, circle graph,
line plot, or perhaps a bar graph. In this section
we will look at how data can be represented
using a bar graph.
Unit 2 – Data Analysis & Interpretation
Consumer Mathematics 30S
4. Biased vs Unbiased Bar Graphs
Unit 2 – Data Analysis & Interpretation
Consumer Mathematics 30S
A bar graph can be constructed in a such a way as
to manipulate the data. A bar graph can be created
to exaggerate the difference among data or it can
minimize the differences in data.
These manipulations could include:
Changing the horizontal scale
Changing the vertical scale
Changing the starting point of the scale.
5. Manipulating Data
Unit 2 – Data Analysis & Interpretation
Consumer Mathematics 30S
The incidence of various types of crimes for the
town of Columbia are shown below.
Year 1997 1998 1999 2000 2001
# of
Crimes
1109 1200 1287 1350 1443
Normal Graph Minimized Graph Exaggerated Graph
6. Normal Graph
Unit 2 – Data Analysis & Interpretation
Consumer Mathematics 30S
9. Discussion Questions:
Assume that you are the Chief of
Police for the town of Columbia.
When you were hired in 1993, you
made a commitment to make sure
crime did not “get out of control.”
The town council has asked you to
report on crime trends over the past
five years. Which graph would you
choose to use in your presentation?
Why did you choose this one?
Unit 2 – Data Analysis & Interpretation
Consumer Mathematics 30S
10. Review
Unit 2 – Data Analysis & Interpretation
Consumer Mathematics 30S
• To Minimize difference you must
make your scale on the y-axis larger.
• To maximize differences you must
make your scale on the y-axis smaller.
• Another way to maximize the
difference is to start your vertical scale
at a number above zero.