SlideShare une entreprise Scribd logo
1  sur  4
Télécharger pour lire hors ligne
APRIL_
2013_
_______
_LOGISTICS
_MARKET SNAPSHOT
1
MULTIMODAL:
Dow Jones Transportation Index Dow Jones Transportation index rose 0.6% during the month of March.
(Stock performance of twenty large, well-known U.S. companies in the transportation industry, average of March 10th
thru April 10th
)
NASDAQ Transportation Index NASDAQ Transportation Index increased 3.2% in March.
(Averaged share weights of NASDAQ-listed companies classified as transportation companies, average of March 10
th
thru April 10
th
)
DOT Freight Transportation Index
The USDOT's freight transportation services index rose 1.2% in February 2013. The index’s reading of 113.9
was up 2.7% from February 2012. (Source: US DOT)
Cass Freight Index
The March shipments index rose 5.8% over the previous month and rose 4.2% year-over-year. The March
expenditures index increased 6.5% for the month, and increased 4.4% year-over-year.
(Source: Cass Information Systems | Cassinfo.com)
(Based upon transportation dollars and shipments of Cass clients comprised of over 400 shipping companies)
Import Volumes
In February, the U.S. imported about $228.9 billion of cargo. February U.S. imports remained the same in
terms of value from January, and rose 1.9% year-over-year. (Source: US Census)
Export Volumes
In February, the U.S. exported more than $186 billion of cargo. February U.S. exports have increased 0.8% in
terms of value over the previous month and grew 3.2% year-over-year. (Source: US Census)
Import & Export Price Index
U.S. import prices fell 0.5% in March. Import prices fell 2.7% over the past year. The price index for U.S.
exports fell 0.4% in March. Export prices increased 0.3% year-over-year. (Source: Bureau of Labor Statistics)
Multimodal News Clips:
• Global steel use will rise an estimated 2.9% in 2013, to 1,454 metric tons. World steel demand is expected
to increase an additional 3.2% in 2014. (Source: World Steel Association)
• Contracts for new nonresidential construction in metro Atlanta jumped 58% to $267 million in February.
Residential contracts for future construction in metro Atlanta rose 48% to $307.5 million during the same
month. Total building contracts in metro Atlanta were up 53% in February.
(Source: McGraw-Hill Construction)
RAIL:
U.S. Freight Rail Traffic
Railroad bulk carload freight in March 2013 fell 1.4% from February 2013. Freight traffic in March fell 0.5%
from March 2012. Carloads excluding coal and grain increased 3.4% over the previous year.
(Source: AAR.org) (Report includes rail car-loadings by 19 different major commodity categories as well as intermodal units)
U.S. Intermodal Rail Traffic
Intermodal rail traffic in March 2013 was 0.5% higher than in March 2012 and 4.9% lower than February
2013 totals. Intermodal loadings have experienced year-over-year gains for 40 straight months.
(Source: AAR.org) (Report includes rail car-loadings by 19 different major commodity categories as well as intermodal units)
Railroad Fuel Price Index
The index of average railroad fuel prices in January was 646.8, up 5.8% from the previous month and 2.1%
higher year-over-year. (Source: AAR.org)
(Average monthly price for gallons purchased by freight railroads; Includes federal excise taxes, transportation, and handling expenses)
Freight Cars in Storage
The number of freight cars in storage has decreased to 311,449 (20.3% of the fleet) on April 1, down 290
cars from a month earlier. (Source: AAR.org)
(A freight car is "in storage" if it has had a loaded revenue move since 2005, but not in the past 60 days. Decrease here = more demand)
Class 1 Railroad Employment
Railroad employment in February 2013 increased by 185 employees to 162,228 employees. Total Class 1 rail
employment in February was 0.9% higher than it was in February 2012. (Source: U.S. STB)
Short Line Rail Traffic
In March 2013, short line railroad shipments across North America rose 7.7% compared to the same month
last year. A sampling of about 429 small railroads in the U.S. and Canada loaded 566,124 railcars and
intermodal units during the month of March. (Source: RMI RailConnect Index | rmiondemand.com)
Railroad News Clips:
• Norfolk Southern reported its second-best year ever for revenue, operating income, net income, and
earnings per share in 2012. The company reported profit in 2012 was $1.75 billion, down 8.7% from 2011,
but 16.9% higher than 2010. Annual railway operating revenue totaled $11.04 billion, down 1.2% from
2011 and 16% above 2010. Intermodal volume increased 5% year-over-year and general merchandise
volume was up 2%.
• Greenbrier Companies reported its net earnings in the second quarter of FY2013 were $13.8 million,
increasing 33% from the 1Q of FY2013. New railcar deliveries totaled 2,700 units in the second quarter.
The new railcar manufacturing backlog in the second quarter was 11,700 units with an estimated value of
$1.3 billion.
APRIL_
2013_
_______
_LOGISTICS
_MARKET SNAPSHOT
2
TRUCKING:
Trucking Volume
The ATA’s seasonally adjusted cargo index rose 0.6% in February after rising 1% in January. The for-hire truck
tonnage index rose 4.2% year-over-year. (Source: American Trucking Association | Trucking.org)
Truckload Freight
The spot market for truckload freight in March rose 37% compared to the previous month, and was 4.1%
lower year-over-year. Truck capacity fell 1.3% for the month, and was up 19% year-over-year.
(Source: TransCore Freight Index | www.transcorefreightsolutions.com)
Diesel Prices
U.S. average diesel prices fell to $3.98 per gallon, down 1.6¢ since last week. The U.S. average diesel price
was 17¢ lower than the same week last year. The average price of diesel in the lower Atlantic states was
$3.95 per gallon. (Source: U.S. DOE) (Reflects the costs and profits of the entire production and distribution chain.)
Trucking Employment
The trucking industry lost 6,900 jobs in March. The trucking workforce decreased 0.5% over the previous
month and increased 2.6% over the previous year. (Source: U.S. Bureau of Labor Statistics)
Truck Orders
Orders for heavy-duty Class 8 trucks in North America are expected to total 21,817 units in March 2013.
March orders were 4% lower than the previous month, and 11% higher year-over-year.
(Source: FTR Associates | ftrassociates.com)
NAFTA Trade
Surface transport-related trade between the U.S. and its NAFTA partners, Canada and Mexico,
increased3.6% in 2012 compared to the previous year, totaling $556.2 billion. (Source: US DOT)
Trucking News Clips:
• Class 8 Truck manufacturing is expected to grow in 2014. Truck production will rise from about 263,000
units in 2013 to more than 300,000 units in 2014. Truck production for 2012 totaled 278,000 vehicles.
Fueling the predicted increase is the high number of trucks being replaced in the current fleet.
• The U.S. Energy Department predicts diesel fuel prices, which averaged $3.95 per gallon last summer, to
fall slightly to an average of $3.94 per gallon this summer. For the entire year, the EIA is forecasting diesel
will average $3.90 per gallon, and in 2014 it’s expected to average $3.80 per gallon. (Source: U.S. DOE)
AIR FREIGHT:
Air Cargo Traffic Global air freight traffic in February decreased 6.2% from one year ago. North American air freight in
February fell 3.1% year-over-year. (Source: IATA.org)
(Global air freight covers international and domestic scheduled air traffic. North American traffic includes only domestic freight traffic.)
Atlanta Air Cargo Traffic
In February, Hartsfield-Jackson Atlanta International Airport transported 48,073 metric tons of cargo, a 4.5%
decrease from the previous month and a 7.4% decrease year-over-year. (Source: HJIA)
Air Freight Price Index
In February, the index of average international air cargo rates rose 1.9 points from January. The average
price of air cargo leaving the United States in February stood at $3.32 per kilogram. (Source: Drewry)
(The Drewry Air Freight Price Index is based on the average of rates ($US per kg) for cargoes of 100+kg to 1,000+kg cargoes from Shanghai
to London, Moscow, Prague, New York, and Los Angeles.)
Jet Fuel Prices As of April 5, 2013, the global average jet fuel price was $121.30 per barrel; down 5.4% from the previous
month, and 11.4% lower year-over-year. (Source: IATA.org, platts.com)
(The weekly index and price data shows the global average price paid at the refinery for aviation jet fuel)
Air Freight News Clips:
• Worldwide semiconductor sales rose 1.4% year-over-year in February, the fourth consecutive month of
rising sales after a 12 month run of declines. Sales of semiconductors totaled $23.25 billion.
(Source: Semiconductor Industry Association)
• Boeing has completed the final certification test for its new 787 battery system, successfully finishing a
demonstration flight on a production plane. The demonstration, according to Boeing, proved that the
battery system performs as expected during both normal and abnormal stress. The data from the flight
will now be analyzed and will be delivered to the FAA. The manufacturer has redesigned internal battery
components, and added a new venting system and better cell insulation.
OCEAN FREIGHT:
Import Volumes
Import shipment volume, in TEUs, at U.S. ports decreased 15% in March from the previous month and fell
12.5% year-over-year. Imports in March were the lowest since 2009 due to the Chinese New Year falling
later this year compared to last year. (Source: Zepol Corporation | zepol.com)
Shanghai Containerized
Freight Index
The April 3
rd
SCFI comprehensive reading was $1,141 per FEU; down 17% year-over-year. The spot rate for
shipments to the U.S. East Coast was $3,454 per FEU, up 7.7% over the previous year. (Source: Shanghai
Shipping Exchange | www1.chineseshipping.com.cn/en)
(The Shanghai Containerized Freight Index is a weekly reported average export spot rate from Shanghai for 15 different trade lanes.)
APRIL_
2013_
_______
_LOGISTICS
_MARKET SNAPSHOT
3
Ocean Bulk Freight Rates
The Baltic Dry Index rose 20.2% in March, ending at 910. The BDI has decreased 3.8% during the first half of
April. (Source: www.bloomberg.com/quote/BDIY:IND)
(The Baltic Dry Index is an index that tracks and averages worldwide international shipping prices of various dry bulk cargoes.)
TSA Bunker Surcharges
Between April 1 and June 30, 2013, the bunker fuel surcharge will total $536 per FEU for shipments to the
West coast ocean ports and $1,015 per FEU for shipments to the East coast and Gulf ports.
(Source: Transpacific Stabilization Agreement) (The Transpacific Stabilization Agreement is a research and discussion forum of major
ocean container shipping lines that carry cargo from Asia to ports in the U.S.)
Port of Savannah
The Port of Savannah moved 2 million tons of cargo in February 2013, a 2.3% increase year-over-year.
February performance was up 4.9% compared to January 2013. (Source: GPA)
Port of Brunswick
The Port of Brunswick moved 50,622 auto/machinery units in February, a 30.4% increase year-over-year.
The port also moved 124,028 tons of bulk cargo during the month, an increase of 282% over the same
month last year. For FY2013, Brunswick has experienced 21% growth in auto/machinery units and 550%
growth in bulk tonnage. (Source: GPA)
Ocean Freight Business News:
• Import volume through major U.S. container ports is expected to increase 2.7% in April. In February, the
latest month for which numbers are available, U.S. container ports handled 1.29 million TEUs, a 17.5%
increase over the same month last year. Total U.S. containerized imports are expected to increase 4.7%
during the first half of 2013. (Source: NRF/Hackett Associates)
• The $50 million in additional port deepening funds proposed by Georgia Governor Nathan Deal has been
approved by the state legislature. Georgia has allocated $231.1 million toward the state’s portion of the
Savannah Harbor Expansion Project. Overall coast of the deepening project is anticipated to be $652
million.
• The cost of Somali piracy to the global economy in 2012 fell 13% year-over-year to about $6 billion.
Hijackings dropped 50% and attempted attacks decreased more than 70%. Private security proved to be
the biggest source of costs, accounting for 29%. About half of ships in the region used armed guards in
2012, up from 30% in 2011. (Source: One Earth Future Foundation)
WAREHOUSING & DISTRIBUTION:
Industrial Vacancy
The U.S. average industrial vacancy rate was 8.7% during Q4 2012, down from 9% in the previous quarter.
Overall vacancy was 9.6% in the Atlanta and 11.7% in Savannah during the fourth quarter.
(Source: Cushman & Wakefield)
Warehouse Rent Rates
In Q4 2012, warehouse and distribution rental rates in the US averaged $4.30 per square foot. Rental rates
for warehouse space averaged $3.33/square foot in the South and $3.57/square foot in Savannah.
(Source: Cushman & Wakefield)
Industrial Absorption
Net absorption in the US during Q4 2012 totaled more than +53.7 million square feet. Absorption during the
4Q totaled +1.3 million square feet in Atlanta and +390,000 square feet in Savannah.
(Source: Cushman & Wakefield) (Absorption is the net change in occupied space between two points in time. Positive absorption means
that previously unoccupied space is being occupied.)
Purchasing Managers Index
The National PMI fell 2.9 points to 51.3 in March 2013. New orders fell 6.4 points to 51.4 and production
decreased 5.4 points to 52.2. (Source: Institute for Supply Management)
(The PMI combines data on new orders, inventory, production, supplier deliveries, and employment. A reading above 50 indicates that the
manufacturing economy is generally expanding.)
Purchasing Managers Index
in Georgia
Georgia’s PMI rose 6.6 points to 61.8 in March. New orders in Georgia rose 15.7 points to 70.5 and
production fell 0.4 of a point to 59.1. Georgia’s PMI is 10.5 points higher than the national PMI.
(Source: Kennesaw State University) (The PMI combines data on new orders, inventory, production, supplier deliveries, and
employment. A reading above 50 indicates that the manufacturing economy is generally expanding.)
W&D Business News:
• Kubota Corp. has opened its new $73 million manufacturing facility in Jefferson, Georgia. The 522,000
square-foot plant will add hundreds of new jobs to support the production capacity of 22,000 tractor units
annually. The recent expansion brings Kubota’s total footprint of manufacturing and assembly space in
Georgia to 2.2 million square feet.
• Koch Foods will expand its poultry processing facility in Hamilton, Georgia, creating 750 new jobs and
investing $49 million. Koch purchased an existing Cagle’s facility in 2012, retaining 350 jobs. During a two-
phase expansion, the company added 350 jobs last year. This second phase, incorporating two new
processing lines, will create an additional 750 new jobs.
• Investment real estate volume in the Atlanta industrial market topped $1 billion in 2012. Compared to last
year, overall volume is up 59%, the third consecutive year with an increase in volume. The amount of
industrial square feet sold increased 65% to 26.7 million square feet. (Source: Colliers International)
APRIL_
2013_
_______
_LOGISTICS
_MARKET SNAPSHOT
4
U.S. MARKET:
Gross Domestic Product
The U.S. GDP increased 0.4% in the fourth quarter of 2012 according to the final estimate released by the
Bureau of Economic Analysis. (Source: US BEA)
U.S. Trade Deficit
The U.S. trade deficit decreased by 3.4% in February to $43 billion. Exports rose 0.8% to $186 billion and
imports remained the same at $228.9 billion. (Source: US DOC & Census Bureau)
Consumer Confidence
The Consumer Confidence Index decreased to 59.7 in March 2013 from 68.0 in February 2013.
(Source: The Conference Board) (The consumer confidence index is based on a monthly survey of 5,000 U.S. households. It is designed
to gauge the financial health, spending power, and confidence of the average U.S. consumer.)
Unemployment Rate
The unemployment rate in America decreased to 7.6% in March 2013 as there were 88,000 net new jobs.
(Source: US DOL)
Leading Economic Index
The Leading Economic Index for the U.S. increased 0.5% in February to 94.8 (2004=100), following a 0.5%
increase in January and a 0.4% increase in December. (Source: Conference Board)
(The LEI is a composite of 10 economic indicators that together create an analytic system designed to signal peaks and troughs in the
business cycle. The LEI reveals patterns in economic data in a clearer and more convincing manner than any individual component alone.)
Retail Sales
Retail and food service sales rose in March to $418.3 billion, down 0.4% from the previous month, and up
2.8% above March 2012. Non-store retailer sales were up 13.5% from last year. (Source: US Census)
Manufacturing & Trade Sales
Total combined sales and manufacturing shipments totaled nearly $1.29 Trillion in February 2013, up 1.2%
from January and up 3.7% from the previous year. (Source: US Census)
Manufacturing & Trade Inventory
Total value of inventory on hand is estimated at $1.64 Trillion in February 2013, up 0.1% from January and
up 4.9% from February 2012. (Source: US Census)
Housing Starts
In February, housing starts rose 0.8% to an annual rate of 917,000 units. Building permits (an indicator of
future housing starts) rose 4.6% to an annual rate of 946,000. Year-over-year, housing starts and building
permits in February have increased 27.7% and 33.8%, respectively. (Source: U.S. DOC)
Consumer & Producer Price Index
The consumer price index for all urban consumers increased 0.7 in February from the previous month. Over
the last 12 months, the all items index increased 2%. The producer price index for finished goods decreased
0.6% in March from the previous month. Prices for finished goods rose 1.1% over the previous year.
(Source: US Bureau of Labor Statistics)
To sign-up to receive these free monthly snapshots, visit: www.GeorgiaLogistics.com
For more information about the Logistics Market Snapshot or the many other
resources and activities of the Georgia Center of Innovation for Logistics please contact:
Page Siplon, Executive Director | psiplon@georgia.org | 912.966.7867

Contenu connexe

En vedette (20)

Las maravillas del mundo
Las maravillas del mundoLas maravillas del mundo
Las maravillas del mundo
 
Individual focus
Individual focusIndividual focus
Individual focus
 
этнография
этнографияэтнография
этнография
 
Migration
MigrationMigration
Migration
 
Arte sacro
Arte sacroArte sacro
Arte sacro
 
Imagens da chapada do araripe
Imagens da chapada do araripeImagens da chapada do araripe
Imagens da chapada do araripe
 
Manual ocs
Manual ocsManual ocs
Manual ocs
 
Cientificos
CientificosCientificos
Cientificos
 
O pixel-da-voz
O pixel-da-vozO pixel-da-voz
O pixel-da-voz
 
Liturgy of St Basil
Liturgy of St BasilLiturgy of St Basil
Liturgy of St Basil
 
Gestion empresarial1
Gestion empresarial1Gestion empresarial1
Gestion empresarial1
 
Reaktiosarja
ReaktiosarjaReaktiosarja
Reaktiosarja
 
Evolucion del comercio electronico
Evolucion  del  comercio  electronicoEvolucion  del  comercio  electronico
Evolucion del comercio electronico
 
Tema7 procesos pdf bueno
Tema7 procesos pdf buenoTema7 procesos pdf bueno
Tema7 procesos pdf bueno
 
Medios y elementos de Comunicacion en Educacion
Medios y elementos de Comunicacion en EducacionMedios y elementos de Comunicacion en Educacion
Medios y elementos de Comunicacion en Educacion
 
α παγκόσμιος πόλεμος2003a
α παγκόσμιος πόλεμος2003aα παγκόσμιος πόλεμος2003a
α παγκόσμιος πόλεμος2003a
 
Bigcamp in sxs_wedu
Bigcamp in sxs_weduBigcamp in sxs_wedu
Bigcamp in sxs_wedu
 
Linked Data Efforts at the Bibliotheque Nationale de France
Linked Data Efforts at the Bibliotheque Nationale de FranceLinked Data Efforts at the Bibliotheque Nationale de France
Linked Data Efforts at the Bibliotheque Nationale de France
 
Turismo ecológico
Turismo ecológicoTurismo ecológico
Turismo ecológico
 
Armature & field coil inspection
Armature & field coil inspectionArmature & field coil inspection
Armature & field coil inspection
 

Similaire à April 2013 Logisics Snapshot 2013

Logistics Market Snapshot Feb 2013
Logistics Market Snapshot Feb 2013Logistics Market Snapshot Feb 2013
Logistics Market Snapshot Feb 2013Brian Schoenbaechler
 
Logistics Market Snapshot November 2011
Logistics Market Snapshot November 2011Logistics Market Snapshot November 2011
Logistics Market Snapshot November 2011Brian Schoenbaechler
 
Logistics Market Snapshot May 2011
Logistics Market Snapshot May 2011Logistics Market Snapshot May 2011
Logistics Market Snapshot May 2011Brian Schoenbaechler
 
Logistics Market SnapShot August 2011
Logistics Market SnapShot August 2011Logistics Market SnapShot August 2011
Logistics Market SnapShot August 2011Brian Schoenbaechler
 
U.S. Infrastructure
U.S. InfrastructureU.S. Infrastructure
U.S. InfrastructureManoj Dimri
 
Distribution and logistics - Analysis and Commentary - North America
Distribution and logistics - Analysis and Commentary - North AmericaDistribution and logistics - Analysis and Commentary - North America
Distribution and logistics - Analysis and Commentary - North Americapaul young cpa, cga
 
Colliers North American Industrial Highlights Q2 2013
Colliers North American Industrial Highlights Q2 2013Colliers North American Industrial Highlights Q2 2013
Colliers North American Industrial Highlights Q2 2013Coy Davidson
 
Manufacturing Analysis and Trends for North america - June 28, 2016
Manufacturing Analysis and Trends for North america - June 28, 2016Manufacturing Analysis and Trends for North america - June 28, 2016
Manufacturing Analysis and Trends for North america - June 28, 2016paul young cpa, cga
 
The Short Tail: Near-Sourcing Trends Create New Winners and Losers in the Sup...
The Short Tail: Near-Sourcing Trends Create New Winners and Losers in the Sup...The Short Tail: Near-Sourcing Trends Create New Winners and Losers in the Sup...
The Short Tail: Near-Sourcing Trends Create New Winners and Losers in the Sup...Benjamin Gordon
 
Mercer Capital's Value Focus: Transportation & Logistics | Q3 2021 | Feature...
Mercer Capital's Value Focus: Transportation & Logistics  | Q3 2021 | Feature...Mercer Capital's Value Focus: Transportation & Logistics  | Q3 2021 | Feature...
Mercer Capital's Value Focus: Transportation & Logistics | Q3 2021 | Feature...Mercer Capital
 
HDL Executive Briefing
HDL Executive BriefingHDL Executive Briefing
HDL Executive BriefingMike Tellez
 
\ACT Research: NA Medium and Heavy-Duty Volumes Rise Incrementally in June
\ACT Research: NA Medium and Heavy-Duty Volumes Rise Incrementally in June\ACT Research: NA Medium and Heavy-Duty Volumes Rise Incrementally in June
\ACT Research: NA Medium and Heavy-Duty Volumes Rise Incrementally in JuneIan McGriff
 
ACT Research: NA Medium and Heavy-Duty Volumes Softened in May
ACT Research: NA Medium and Heavy-Duty Volumes Softened in MayACT Research: NA Medium and Heavy-Duty Volumes Softened in May
ACT Research: NA Medium and Heavy-Duty Volumes Softened in MayIan McGriff
 
Finding transportationstatisticsbts webinar
Finding transportationstatisticsbts webinarFinding transportationstatisticsbts webinar
Finding transportationstatisticsbts webinarRosalyn Alleman
 
Finding transportationstatisticsbts webinar
Finding transportationstatisticsbts webinarFinding transportationstatisticsbts webinar
Finding transportationstatisticsbts webinarRosalyn Alleman
 
Metal fabrication Analysis - North america - June 23, 2016
Metal fabrication Analysis -  North america - June 23, 2016Metal fabrication Analysis -  North america - June 23, 2016
Metal fabrication Analysis - North america - June 23, 2016paul young cpa, cga
 

Similaire à April 2013 Logisics Snapshot 2013 (20)

Logistics Market Snapshot Feb 2013
Logistics Market Snapshot Feb 2013Logistics Market Snapshot Feb 2013
Logistics Market Snapshot Feb 2013
 
Logistics Market Snapshot November 2011
Logistics Market Snapshot November 2011Logistics Market Snapshot November 2011
Logistics Market Snapshot November 2011
 
Logistics Market Snapshot May 2011
Logistics Market Snapshot May 2011Logistics Market Snapshot May 2011
Logistics Market Snapshot May 2011
 
Logistics Market SnapShot August 2011
Logistics Market SnapShot August 2011Logistics Market SnapShot August 2011
Logistics Market SnapShot August 2011
 
U.S. Infrastructure
U.S. InfrastructureU.S. Infrastructure
U.S. Infrastructure
 
Benjamin Teitelbaum: Profile of Trade and Transportation in North America
Benjamin Teitelbaum: Profile of Trade and Transportation in North AmericaBenjamin Teitelbaum: Profile of Trade and Transportation in North America
Benjamin Teitelbaum: Profile of Trade and Transportation in North America
 
C.D.Howe _Institute_e-brief
C.D.Howe _Institute_e-briefC.D.Howe _Institute_e-brief
C.D.Howe _Institute_e-brief
 
Distribution and logistics - Analysis and Commentary - North America
Distribution and logistics - Analysis and Commentary - North AmericaDistribution and logistics - Analysis and Commentary - North America
Distribution and logistics - Analysis and Commentary - North America
 
Colliers North American Industrial Highlights Q2 2013
Colliers North American Industrial Highlights Q2 2013Colliers North American Industrial Highlights Q2 2013
Colliers North American Industrial Highlights Q2 2013
 
Manufacturing Analysis and Trends for North america - June 28, 2016
Manufacturing Analysis and Trends for North america - June 28, 2016Manufacturing Analysis and Trends for North america - June 28, 2016
Manufacturing Analysis and Trends for North america - June 28, 2016
 
The Short Tail: Near-Sourcing Trends Create New Winners and Losers in the Sup...
The Short Tail: Near-Sourcing Trends Create New Winners and Losers in the Sup...The Short Tail: Near-Sourcing Trends Create New Winners and Losers in the Sup...
The Short Tail: Near-Sourcing Trends Create New Winners and Losers in the Sup...
 
Mercer Capital's Value Focus: Transportation & Logistics | Q3 2021 | Feature...
Mercer Capital's Value Focus: Transportation & Logistics  | Q3 2021 | Feature...Mercer Capital's Value Focus: Transportation & Logistics  | Q3 2021 | Feature...
Mercer Capital's Value Focus: Transportation & Logistics | Q3 2021 | Feature...
 
HDL Executive Briefing
HDL Executive BriefingHDL Executive Briefing
HDL Executive Briefing
 
UK accident analysis
UK accident analysisUK accident analysis
UK accident analysis
 
\ACT Research: NA Medium and Heavy-Duty Volumes Rise Incrementally in June
\ACT Research: NA Medium and Heavy-Duty Volumes Rise Incrementally in June\ACT Research: NA Medium and Heavy-Duty Volumes Rise Incrementally in June
\ACT Research: NA Medium and Heavy-Duty Volumes Rise Incrementally in June
 
ACT Research: NA Medium and Heavy-Duty Volumes Softened in May
ACT Research: NA Medium and Heavy-Duty Volumes Softened in MayACT Research: NA Medium and Heavy-Duty Volumes Softened in May
ACT Research: NA Medium and Heavy-Duty Volumes Softened in May
 
Finding transportationstatisticsbts webinar
Finding transportationstatisticsbts webinarFinding transportationstatisticsbts webinar
Finding transportationstatisticsbts webinar
 
Finding transportationstatisticsbts webinar
Finding transportationstatisticsbts webinarFinding transportationstatisticsbts webinar
Finding transportationstatisticsbts webinar
 
A4A Industry Review and Outlook
A4A Industry Review and OutlookA4A Industry Review and Outlook
A4A Industry Review and Outlook
 
Metal fabrication Analysis - North america - June 23, 2016
Metal fabrication Analysis -  North america - June 23, 2016Metal fabrication Analysis -  North america - June 23, 2016
Metal fabrication Analysis - North america - June 23, 2016
 

Dernier

Russian Faridabad Call Girls(Badarpur) : ☎ 8168257667, @4999
Russian Faridabad Call Girls(Badarpur) : ☎ 8168257667, @4999Russian Faridabad Call Girls(Badarpur) : ☎ 8168257667, @4999
Russian Faridabad Call Girls(Badarpur) : ☎ 8168257667, @4999Tina Ji
 
Ensure the security of your HCL environment by applying the Zero Trust princi...
Ensure the security of your HCL environment by applying the Zero Trust princi...Ensure the security of your HCL environment by applying the Zero Trust princi...
Ensure the security of your HCL environment by applying the Zero Trust princi...Roland Driesen
 
DEPED Work From Home WORKWEEK-PLAN.docx
DEPED Work From Home  WORKWEEK-PLAN.docxDEPED Work From Home  WORKWEEK-PLAN.docx
DEPED Work From Home WORKWEEK-PLAN.docxRodelinaLaud
 
Yaroslav Rozhankivskyy: Три складові і три передумови максимальної продуктивн...
Yaroslav Rozhankivskyy: Три складові і три передумови максимальної продуктивн...Yaroslav Rozhankivskyy: Три складові і три передумови максимальної продуктивн...
Yaroslav Rozhankivskyy: Три складові і три передумови максимальної продуктивн...Lviv Startup Club
 
Progress Report - Oracle Database Analyst Summit
Progress  Report - Oracle Database Analyst SummitProgress  Report - Oracle Database Analyst Summit
Progress Report - Oracle Database Analyst SummitHolger Mueller
 
MONA 98765-12871 CALL GIRLS IN LUDHIANA LUDHIANA CALL GIRL
MONA 98765-12871 CALL GIRLS IN LUDHIANA LUDHIANA CALL GIRLMONA 98765-12871 CALL GIRLS IN LUDHIANA LUDHIANA CALL GIRL
MONA 98765-12871 CALL GIRLS IN LUDHIANA LUDHIANA CALL GIRLSeo
 
Catalogue ONG NƯỚC uPVC - HDPE DE NHAT.pdf
Catalogue ONG NƯỚC uPVC - HDPE DE NHAT.pdfCatalogue ONG NƯỚC uPVC - HDPE DE NHAT.pdf
Catalogue ONG NƯỚC uPVC - HDPE DE NHAT.pdfOrient Homes
 
Socio-economic-Impact-of-business-consumers-suppliers-and.pptx
Socio-economic-Impact-of-business-consumers-suppliers-and.pptxSocio-economic-Impact-of-business-consumers-suppliers-and.pptx
Socio-economic-Impact-of-business-consumers-suppliers-and.pptxtrishalcan8
 
Mysore Call Girls 8617370543 WhatsApp Number 24x7 Best Services
Mysore Call Girls 8617370543 WhatsApp Number 24x7 Best ServicesMysore Call Girls 8617370543 WhatsApp Number 24x7 Best Services
Mysore Call Girls 8617370543 WhatsApp Number 24x7 Best ServicesDipal Arora
 
A DAY IN THE LIFE OF A SALESMAN / WOMAN
A DAY IN THE LIFE OF A  SALESMAN / WOMANA DAY IN THE LIFE OF A  SALESMAN / WOMAN
A DAY IN THE LIFE OF A SALESMAN / WOMANIlamathiKannappan
 
RE Capital's Visionary Leadership under Newman Leech
RE Capital's Visionary Leadership under Newman LeechRE Capital's Visionary Leadership under Newman Leech
RE Capital's Visionary Leadership under Newman LeechNewman George Leech
 
Insurers' journeys to build a mastery in the IoT usage
Insurers' journeys to build a mastery in the IoT usageInsurers' journeys to build a mastery in the IoT usage
Insurers' journeys to build a mastery in the IoT usageMatteo Carbone
 
Call Girls In Panjim North Goa 9971646499 Genuine Service
Call Girls In Panjim North Goa 9971646499 Genuine ServiceCall Girls In Panjim North Goa 9971646499 Genuine Service
Call Girls In Panjim North Goa 9971646499 Genuine Serviceritikaroy0888
 
The Coffee Bean & Tea Leaf(CBTL), Business strategy case study
The Coffee Bean & Tea Leaf(CBTL), Business strategy case studyThe Coffee Bean & Tea Leaf(CBTL), Business strategy case study
The Coffee Bean & Tea Leaf(CBTL), Business strategy case studyEthan lee
 
Call Girls Navi Mumbai Just Call 9907093804 Top Class Call Girl Service Avail...
Call Girls Navi Mumbai Just Call 9907093804 Top Class Call Girl Service Avail...Call Girls Navi Mumbai Just Call 9907093804 Top Class Call Girl Service Avail...
Call Girls Navi Mumbai Just Call 9907093804 Top Class Call Girl Service Avail...Dipal Arora
 
Call Girls Pune Just Call 9907093804 Top Class Call Girl Service Available
Call Girls Pune Just Call 9907093804 Top Class Call Girl Service AvailableCall Girls Pune Just Call 9907093804 Top Class Call Girl Service Available
Call Girls Pune Just Call 9907093804 Top Class Call Girl Service AvailableDipal Arora
 
VIP Call Girl Jamshedpur Aashi 8250192130 Independent Escort Service Jamshedpur
VIP Call Girl Jamshedpur Aashi 8250192130 Independent Escort Service JamshedpurVIP Call Girl Jamshedpur Aashi 8250192130 Independent Escort Service Jamshedpur
VIP Call Girl Jamshedpur Aashi 8250192130 Independent Escort Service JamshedpurSuhani Kapoor
 
Lucknow 💋 Escorts in Lucknow - 450+ Call Girl Cash Payment 8923113531 Neha Th...
Lucknow 💋 Escorts in Lucknow - 450+ Call Girl Cash Payment 8923113531 Neha Th...Lucknow 💋 Escorts in Lucknow - 450+ Call Girl Cash Payment 8923113531 Neha Th...
Lucknow 💋 Escorts in Lucknow - 450+ Call Girl Cash Payment 8923113531 Neha Th...anilsa9823
 

Dernier (20)

Russian Faridabad Call Girls(Badarpur) : ☎ 8168257667, @4999
Russian Faridabad Call Girls(Badarpur) : ☎ 8168257667, @4999Russian Faridabad Call Girls(Badarpur) : ☎ 8168257667, @4999
Russian Faridabad Call Girls(Badarpur) : ☎ 8168257667, @4999
 
Ensure the security of your HCL environment by applying the Zero Trust princi...
Ensure the security of your HCL environment by applying the Zero Trust princi...Ensure the security of your HCL environment by applying the Zero Trust princi...
Ensure the security of your HCL environment by applying the Zero Trust princi...
 
DEPED Work From Home WORKWEEK-PLAN.docx
DEPED Work From Home  WORKWEEK-PLAN.docxDEPED Work From Home  WORKWEEK-PLAN.docx
DEPED Work From Home WORKWEEK-PLAN.docx
 
Yaroslav Rozhankivskyy: Три складові і три передумови максимальної продуктивн...
Yaroslav Rozhankivskyy: Три складові і три передумови максимальної продуктивн...Yaroslav Rozhankivskyy: Три складові і три передумови максимальної продуктивн...
Yaroslav Rozhankivskyy: Три складові і три передумови максимальної продуктивн...
 
Progress Report - Oracle Database Analyst Summit
Progress  Report - Oracle Database Analyst SummitProgress  Report - Oracle Database Analyst Summit
Progress Report - Oracle Database Analyst Summit
 
MONA 98765-12871 CALL GIRLS IN LUDHIANA LUDHIANA CALL GIRL
MONA 98765-12871 CALL GIRLS IN LUDHIANA LUDHIANA CALL GIRLMONA 98765-12871 CALL GIRLS IN LUDHIANA LUDHIANA CALL GIRL
MONA 98765-12871 CALL GIRLS IN LUDHIANA LUDHIANA CALL GIRL
 
Catalogue ONG NƯỚC uPVC - HDPE DE NHAT.pdf
Catalogue ONG NƯỚC uPVC - HDPE DE NHAT.pdfCatalogue ONG NƯỚC uPVC - HDPE DE NHAT.pdf
Catalogue ONG NƯỚC uPVC - HDPE DE NHAT.pdf
 
Socio-economic-Impact-of-business-consumers-suppliers-and.pptx
Socio-economic-Impact-of-business-consumers-suppliers-and.pptxSocio-economic-Impact-of-business-consumers-suppliers-and.pptx
Socio-economic-Impact-of-business-consumers-suppliers-and.pptx
 
Mysore Call Girls 8617370543 WhatsApp Number 24x7 Best Services
Mysore Call Girls 8617370543 WhatsApp Number 24x7 Best ServicesMysore Call Girls 8617370543 WhatsApp Number 24x7 Best Services
Mysore Call Girls 8617370543 WhatsApp Number 24x7 Best Services
 
A DAY IN THE LIFE OF A SALESMAN / WOMAN
A DAY IN THE LIFE OF A  SALESMAN / WOMANA DAY IN THE LIFE OF A  SALESMAN / WOMAN
A DAY IN THE LIFE OF A SALESMAN / WOMAN
 
RE Capital's Visionary Leadership under Newman Leech
RE Capital's Visionary Leadership under Newman LeechRE Capital's Visionary Leadership under Newman Leech
RE Capital's Visionary Leadership under Newman Leech
 
Insurers' journeys to build a mastery in the IoT usage
Insurers' journeys to build a mastery in the IoT usageInsurers' journeys to build a mastery in the IoT usage
Insurers' journeys to build a mastery in the IoT usage
 
Call Girls In Panjim North Goa 9971646499 Genuine Service
Call Girls In Panjim North Goa 9971646499 Genuine ServiceCall Girls In Panjim North Goa 9971646499 Genuine Service
Call Girls In Panjim North Goa 9971646499 Genuine Service
 
The Coffee Bean & Tea Leaf(CBTL), Business strategy case study
The Coffee Bean & Tea Leaf(CBTL), Business strategy case studyThe Coffee Bean & Tea Leaf(CBTL), Business strategy case study
The Coffee Bean & Tea Leaf(CBTL), Business strategy case study
 
Call Girls Navi Mumbai Just Call 9907093804 Top Class Call Girl Service Avail...
Call Girls Navi Mumbai Just Call 9907093804 Top Class Call Girl Service Avail...Call Girls Navi Mumbai Just Call 9907093804 Top Class Call Girl Service Avail...
Call Girls Navi Mumbai Just Call 9907093804 Top Class Call Girl Service Avail...
 
Call Girls Pune Just Call 9907093804 Top Class Call Girl Service Available
Call Girls Pune Just Call 9907093804 Top Class Call Girl Service AvailableCall Girls Pune Just Call 9907093804 Top Class Call Girl Service Available
Call Girls Pune Just Call 9907093804 Top Class Call Girl Service Available
 
Best Practices for Implementing an External Recruiting Partnership
Best Practices for Implementing an External Recruiting PartnershipBest Practices for Implementing an External Recruiting Partnership
Best Practices for Implementing an External Recruiting Partnership
 
VIP Call Girl Jamshedpur Aashi 8250192130 Independent Escort Service Jamshedpur
VIP Call Girl Jamshedpur Aashi 8250192130 Independent Escort Service JamshedpurVIP Call Girl Jamshedpur Aashi 8250192130 Independent Escort Service Jamshedpur
VIP Call Girl Jamshedpur Aashi 8250192130 Independent Escort Service Jamshedpur
 
Nepali Escort Girl Kakori \ 9548273370 Indian Call Girls Service Lucknow ₹,9517
Nepali Escort Girl Kakori \ 9548273370 Indian Call Girls Service Lucknow ₹,9517Nepali Escort Girl Kakori \ 9548273370 Indian Call Girls Service Lucknow ₹,9517
Nepali Escort Girl Kakori \ 9548273370 Indian Call Girls Service Lucknow ₹,9517
 
Lucknow 💋 Escorts in Lucknow - 450+ Call Girl Cash Payment 8923113531 Neha Th...
Lucknow 💋 Escorts in Lucknow - 450+ Call Girl Cash Payment 8923113531 Neha Th...Lucknow 💋 Escorts in Lucknow - 450+ Call Girl Cash Payment 8923113531 Neha Th...
Lucknow 💋 Escorts in Lucknow - 450+ Call Girl Cash Payment 8923113531 Neha Th...
 

April 2013 Logisics Snapshot 2013

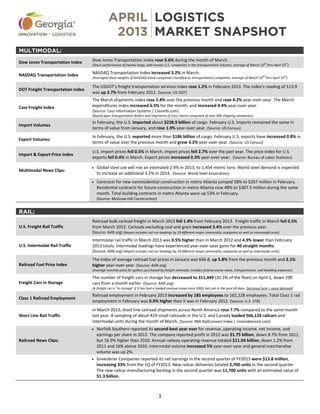
  • 1. APRIL_ 2013_ _______ _LOGISTICS _MARKET SNAPSHOT 1 MULTIMODAL: Dow Jones Transportation Index Dow Jones Transportation index rose 0.6% during the month of March. (Stock performance of twenty large, well-known U.S. companies in the transportation industry, average of March 10th thru April 10th ) NASDAQ Transportation Index NASDAQ Transportation Index increased 3.2% in March. (Averaged share weights of NASDAQ-listed companies classified as transportation companies, average of March 10 th thru April 10 th ) DOT Freight Transportation Index The USDOT's freight transportation services index rose 1.2% in February 2013. The index’s reading of 113.9 was up 2.7% from February 2012. (Source: US DOT) Cass Freight Index The March shipments index rose 5.8% over the previous month and rose 4.2% year-over-year. The March expenditures index increased 6.5% for the month, and increased 4.4% year-over-year. (Source: Cass Information Systems | Cassinfo.com) (Based upon transportation dollars and shipments of Cass clients comprised of over 400 shipping companies) Import Volumes In February, the U.S. imported about $228.9 billion of cargo. February U.S. imports remained the same in terms of value from January, and rose 1.9% year-over-year. (Source: US Census) Export Volumes In February, the U.S. exported more than $186 billion of cargo. February U.S. exports have increased 0.8% in terms of value over the previous month and grew 3.2% year-over-year. (Source: US Census) Import & Export Price Index U.S. import prices fell 0.5% in March. Import prices fell 2.7% over the past year. The price index for U.S. exports fell 0.4% in March. Export prices increased 0.3% year-over-year. (Source: Bureau of Labor Statistics) Multimodal News Clips: • Global steel use will rise an estimated 2.9% in 2013, to 1,454 metric tons. World steel demand is expected to increase an additional 3.2% in 2014. (Source: World Steel Association) • Contracts for new nonresidential construction in metro Atlanta jumped 58% to $267 million in February. Residential contracts for future construction in metro Atlanta rose 48% to $307.5 million during the same month. Total building contracts in metro Atlanta were up 53% in February. (Source: McGraw-Hill Construction) RAIL: U.S. Freight Rail Traffic Railroad bulk carload freight in March 2013 fell 1.4% from February 2013. Freight traffic in March fell 0.5% from March 2012. Carloads excluding coal and grain increased 3.4% over the previous year. (Source: AAR.org) (Report includes rail car-loadings by 19 different major commodity categories as well as intermodal units) U.S. Intermodal Rail Traffic Intermodal rail traffic in March 2013 was 0.5% higher than in March 2012 and 4.9% lower than February 2013 totals. Intermodal loadings have experienced year-over-year gains for 40 straight months. (Source: AAR.org) (Report includes rail car-loadings by 19 different major commodity categories as well as intermodal units) Railroad Fuel Price Index The index of average railroad fuel prices in January was 646.8, up 5.8% from the previous month and 2.1% higher year-over-year. (Source: AAR.org) (Average monthly price for gallons purchased by freight railroads; Includes federal excise taxes, transportation, and handling expenses) Freight Cars in Storage The number of freight cars in storage has decreased to 311,449 (20.3% of the fleet) on April 1, down 290 cars from a month earlier. (Source: AAR.org) (A freight car is "in storage" if it has had a loaded revenue move since 2005, but not in the past 60 days. Decrease here = more demand) Class 1 Railroad Employment Railroad employment in February 2013 increased by 185 employees to 162,228 employees. Total Class 1 rail employment in February was 0.9% higher than it was in February 2012. (Source: U.S. STB) Short Line Rail Traffic In March 2013, short line railroad shipments across North America rose 7.7% compared to the same month last year. A sampling of about 429 small railroads in the U.S. and Canada loaded 566,124 railcars and intermodal units during the month of March. (Source: RMI RailConnect Index | rmiondemand.com) Railroad News Clips: • Norfolk Southern reported its second-best year ever for revenue, operating income, net income, and earnings per share in 2012. The company reported profit in 2012 was $1.75 billion, down 8.7% from 2011, but 16.9% higher than 2010. Annual railway operating revenue totaled $11.04 billion, down 1.2% from 2011 and 16% above 2010. Intermodal volume increased 5% year-over-year and general merchandise volume was up 2%. • Greenbrier Companies reported its net earnings in the second quarter of FY2013 were $13.8 million, increasing 33% from the 1Q of FY2013. New railcar deliveries totaled 2,700 units in the second quarter. The new railcar manufacturing backlog in the second quarter was 11,700 units with an estimated value of $1.3 billion.
  • 2. APRIL_ 2013_ _______ _LOGISTICS _MARKET SNAPSHOT 2 TRUCKING: Trucking Volume The ATA’s seasonally adjusted cargo index rose 0.6% in February after rising 1% in January. The for-hire truck tonnage index rose 4.2% year-over-year. (Source: American Trucking Association | Trucking.org) Truckload Freight The spot market for truckload freight in March rose 37% compared to the previous month, and was 4.1% lower year-over-year. Truck capacity fell 1.3% for the month, and was up 19% year-over-year. (Source: TransCore Freight Index | www.transcorefreightsolutions.com) Diesel Prices U.S. average diesel prices fell to $3.98 per gallon, down 1.6¢ since last week. The U.S. average diesel price was 17¢ lower than the same week last year. The average price of diesel in the lower Atlantic states was $3.95 per gallon. (Source: U.S. DOE) (Reflects the costs and profits of the entire production and distribution chain.) Trucking Employment The trucking industry lost 6,900 jobs in March. The trucking workforce decreased 0.5% over the previous month and increased 2.6% over the previous year. (Source: U.S. Bureau of Labor Statistics) Truck Orders Orders for heavy-duty Class 8 trucks in North America are expected to total 21,817 units in March 2013. March orders were 4% lower than the previous month, and 11% higher year-over-year. (Source: FTR Associates | ftrassociates.com) NAFTA Trade Surface transport-related trade between the U.S. and its NAFTA partners, Canada and Mexico, increased3.6% in 2012 compared to the previous year, totaling $556.2 billion. (Source: US DOT) Trucking News Clips: • Class 8 Truck manufacturing is expected to grow in 2014. Truck production will rise from about 263,000 units in 2013 to more than 300,000 units in 2014. Truck production for 2012 totaled 278,000 vehicles. Fueling the predicted increase is the high number of trucks being replaced in the current fleet. • The U.S. Energy Department predicts diesel fuel prices, which averaged $3.95 per gallon last summer, to fall slightly to an average of $3.94 per gallon this summer. For the entire year, the EIA is forecasting diesel will average $3.90 per gallon, and in 2014 it’s expected to average $3.80 per gallon. (Source: U.S. DOE) AIR FREIGHT: Air Cargo Traffic Global air freight traffic in February decreased 6.2% from one year ago. North American air freight in February fell 3.1% year-over-year. (Source: IATA.org) (Global air freight covers international and domestic scheduled air traffic. North American traffic includes only domestic freight traffic.) Atlanta Air Cargo Traffic In February, Hartsfield-Jackson Atlanta International Airport transported 48,073 metric tons of cargo, a 4.5% decrease from the previous month and a 7.4% decrease year-over-year. (Source: HJIA) Air Freight Price Index In February, the index of average international air cargo rates rose 1.9 points from January. The average price of air cargo leaving the United States in February stood at $3.32 per kilogram. (Source: Drewry) (The Drewry Air Freight Price Index is based on the average of rates ($US per kg) for cargoes of 100+kg to 1,000+kg cargoes from Shanghai to London, Moscow, Prague, New York, and Los Angeles.) Jet Fuel Prices As of April 5, 2013, the global average jet fuel price was $121.30 per barrel; down 5.4% from the previous month, and 11.4% lower year-over-year. (Source: IATA.org, platts.com) (The weekly index and price data shows the global average price paid at the refinery for aviation jet fuel) Air Freight News Clips: • Worldwide semiconductor sales rose 1.4% year-over-year in February, the fourth consecutive month of rising sales after a 12 month run of declines. Sales of semiconductors totaled $23.25 billion. (Source: Semiconductor Industry Association) • Boeing has completed the final certification test for its new 787 battery system, successfully finishing a demonstration flight on a production plane. The demonstration, according to Boeing, proved that the battery system performs as expected during both normal and abnormal stress. The data from the flight will now be analyzed and will be delivered to the FAA. The manufacturer has redesigned internal battery components, and added a new venting system and better cell insulation. OCEAN FREIGHT: Import Volumes Import shipment volume, in TEUs, at U.S. ports decreased 15% in March from the previous month and fell 12.5% year-over-year. Imports in March were the lowest since 2009 due to the Chinese New Year falling later this year compared to last year. (Source: Zepol Corporation | zepol.com) Shanghai Containerized Freight Index The April 3 rd SCFI comprehensive reading was $1,141 per FEU; down 17% year-over-year. The spot rate for shipments to the U.S. East Coast was $3,454 per FEU, up 7.7% over the previous year. (Source: Shanghai Shipping Exchange | www1.chineseshipping.com.cn/en) (The Shanghai Containerized Freight Index is a weekly reported average export spot rate from Shanghai for 15 different trade lanes.)
  • 3. APRIL_ 2013_ _______ _LOGISTICS _MARKET SNAPSHOT 3 Ocean Bulk Freight Rates The Baltic Dry Index rose 20.2% in March, ending at 910. The BDI has decreased 3.8% during the first half of April. (Source: www.bloomberg.com/quote/BDIY:IND) (The Baltic Dry Index is an index that tracks and averages worldwide international shipping prices of various dry bulk cargoes.) TSA Bunker Surcharges Between April 1 and June 30, 2013, the bunker fuel surcharge will total $536 per FEU for shipments to the West coast ocean ports and $1,015 per FEU for shipments to the East coast and Gulf ports. (Source: Transpacific Stabilization Agreement) (The Transpacific Stabilization Agreement is a research and discussion forum of major ocean container shipping lines that carry cargo from Asia to ports in the U.S.) Port of Savannah The Port of Savannah moved 2 million tons of cargo in February 2013, a 2.3% increase year-over-year. February performance was up 4.9% compared to January 2013. (Source: GPA) Port of Brunswick The Port of Brunswick moved 50,622 auto/machinery units in February, a 30.4% increase year-over-year. The port also moved 124,028 tons of bulk cargo during the month, an increase of 282% over the same month last year. For FY2013, Brunswick has experienced 21% growth in auto/machinery units and 550% growth in bulk tonnage. (Source: GPA) Ocean Freight Business News: • Import volume through major U.S. container ports is expected to increase 2.7% in April. In February, the latest month for which numbers are available, U.S. container ports handled 1.29 million TEUs, a 17.5% increase over the same month last year. Total U.S. containerized imports are expected to increase 4.7% during the first half of 2013. (Source: NRF/Hackett Associates) • The $50 million in additional port deepening funds proposed by Georgia Governor Nathan Deal has been approved by the state legislature. Georgia has allocated $231.1 million toward the state’s portion of the Savannah Harbor Expansion Project. Overall coast of the deepening project is anticipated to be $652 million. • The cost of Somali piracy to the global economy in 2012 fell 13% year-over-year to about $6 billion. Hijackings dropped 50% and attempted attacks decreased more than 70%. Private security proved to be the biggest source of costs, accounting for 29%. About half of ships in the region used armed guards in 2012, up from 30% in 2011. (Source: One Earth Future Foundation) WAREHOUSING & DISTRIBUTION: Industrial Vacancy The U.S. average industrial vacancy rate was 8.7% during Q4 2012, down from 9% in the previous quarter. Overall vacancy was 9.6% in the Atlanta and 11.7% in Savannah during the fourth quarter. (Source: Cushman & Wakefield) Warehouse Rent Rates In Q4 2012, warehouse and distribution rental rates in the US averaged $4.30 per square foot. Rental rates for warehouse space averaged $3.33/square foot in the South and $3.57/square foot in Savannah. (Source: Cushman & Wakefield) Industrial Absorption Net absorption in the US during Q4 2012 totaled more than +53.7 million square feet. Absorption during the 4Q totaled +1.3 million square feet in Atlanta and +390,000 square feet in Savannah. (Source: Cushman & Wakefield) (Absorption is the net change in occupied space between two points in time. Positive absorption means that previously unoccupied space is being occupied.) Purchasing Managers Index The National PMI fell 2.9 points to 51.3 in March 2013. New orders fell 6.4 points to 51.4 and production decreased 5.4 points to 52.2. (Source: Institute for Supply Management) (The PMI combines data on new orders, inventory, production, supplier deliveries, and employment. A reading above 50 indicates that the manufacturing economy is generally expanding.) Purchasing Managers Index in Georgia Georgia’s PMI rose 6.6 points to 61.8 in March. New orders in Georgia rose 15.7 points to 70.5 and production fell 0.4 of a point to 59.1. Georgia’s PMI is 10.5 points higher than the national PMI. (Source: Kennesaw State University) (The PMI combines data on new orders, inventory, production, supplier deliveries, and employment. A reading above 50 indicates that the manufacturing economy is generally expanding.) W&D Business News: • Kubota Corp. has opened its new $73 million manufacturing facility in Jefferson, Georgia. The 522,000 square-foot plant will add hundreds of new jobs to support the production capacity of 22,000 tractor units annually. The recent expansion brings Kubota’s total footprint of manufacturing and assembly space in Georgia to 2.2 million square feet. • Koch Foods will expand its poultry processing facility in Hamilton, Georgia, creating 750 new jobs and investing $49 million. Koch purchased an existing Cagle’s facility in 2012, retaining 350 jobs. During a two- phase expansion, the company added 350 jobs last year. This second phase, incorporating two new processing lines, will create an additional 750 new jobs. • Investment real estate volume in the Atlanta industrial market topped $1 billion in 2012. Compared to last year, overall volume is up 59%, the third consecutive year with an increase in volume. The amount of industrial square feet sold increased 65% to 26.7 million square feet. (Source: Colliers International)
  • 4. APRIL_ 2013_ _______ _LOGISTICS _MARKET SNAPSHOT 4 U.S. MARKET: Gross Domestic Product The U.S. GDP increased 0.4% in the fourth quarter of 2012 according to the final estimate released by the Bureau of Economic Analysis. (Source: US BEA) U.S. Trade Deficit The U.S. trade deficit decreased by 3.4% in February to $43 billion. Exports rose 0.8% to $186 billion and imports remained the same at $228.9 billion. (Source: US DOC & Census Bureau) Consumer Confidence The Consumer Confidence Index decreased to 59.7 in March 2013 from 68.0 in February 2013. (Source: The Conference Board) (The consumer confidence index is based on a monthly survey of 5,000 U.S. households. It is designed to gauge the financial health, spending power, and confidence of the average U.S. consumer.) Unemployment Rate The unemployment rate in America decreased to 7.6% in March 2013 as there were 88,000 net new jobs. (Source: US DOL) Leading Economic Index The Leading Economic Index for the U.S. increased 0.5% in February to 94.8 (2004=100), following a 0.5% increase in January and a 0.4% increase in December. (Source: Conference Board) (The LEI is a composite of 10 economic indicators that together create an analytic system designed to signal peaks and troughs in the business cycle. The LEI reveals patterns in economic data in a clearer and more convincing manner than any individual component alone.) Retail Sales Retail and food service sales rose in March to $418.3 billion, down 0.4% from the previous month, and up 2.8% above March 2012. Non-store retailer sales were up 13.5% from last year. (Source: US Census) Manufacturing & Trade Sales Total combined sales and manufacturing shipments totaled nearly $1.29 Trillion in February 2013, up 1.2% from January and up 3.7% from the previous year. (Source: US Census) Manufacturing & Trade Inventory Total value of inventory on hand is estimated at $1.64 Trillion in February 2013, up 0.1% from January and up 4.9% from February 2012. (Source: US Census) Housing Starts In February, housing starts rose 0.8% to an annual rate of 917,000 units. Building permits (an indicator of future housing starts) rose 4.6% to an annual rate of 946,000. Year-over-year, housing starts and building permits in February have increased 27.7% and 33.8%, respectively. (Source: U.S. DOC) Consumer & Producer Price Index The consumer price index for all urban consumers increased 0.7 in February from the previous month. Over the last 12 months, the all items index increased 2%. The producer price index for finished goods decreased 0.6% in March from the previous month. Prices for finished goods rose 1.1% over the previous year. (Source: US Bureau of Labor Statistics) To sign-up to receive these free monthly snapshots, visit: www.GeorgiaLogistics.com For more information about the Logistics Market Snapshot or the many other resources and activities of the Georgia Center of Innovation for Logistics please contact: Page Siplon, Executive Director | psiplon@georgia.org | 912.966.7867