SlideShare une entreprise Scribd logo
1  sur  4
Télécharger pour lire hors ligne
FEBRUARY 2013
                                              LOGISTICS MARKET SNAPSHOT
  Fueling Logistics Competitiveness                                                          Prepared: February 18, 2013


MULTIMODAL:
Dow Jones Transportation Index     Dow Jones Transportation index rose 6.1% during the month of January.
                                   (Stock performance of twenty large, well-known U.S. companies in the transportation industry, average of January 10th thru February 10th)

NASDAQ Transportation Index        NASDAQ Transportation Index increased 1.9% in January.
                                                                                                                                                        th                    th
                                   (Averaged share weights of NASDAQ-listed companies classified as transportation companies, average of January 10 thru February 10 )

                                   The USDOT's freight transportation services rose 1% in December 2012. The index’s reading of 109.9 was
DOT Freight Transportation Index
                                   down 3.5% from December 2011. (Source: US DOT)
                                   The January shipments index fell 4.8% over the previous month and fell 2.5% year-over-year. The January
Cass Freight Index                 expenditures index decreased 5.5% for the month, and decreased 1.6% year-over-year.
                                   (Source: Cass Information Systems | Cassinfo.com)
                                   (Based upon transportation dollars and shipments of Cass clients comprised of over 400 shipping companies)
                                   In December, the U.S. imported about $224.9 billion of cargo. December U.S. imports have decreased 2.7%
Import Volumes
                                   in terms of value from November, and fell 2% year-over-year. (Source: US Census)
                                   In December, the U.S. exported more than $186.4 billion of cargo. December U.S. exports have increased
Export Volumes
                                   2.1% in terms of value over the previous month and grew 4.9% year-over-year. (Source: US Census)
                                   U.S. import prices rose 0.6% in December. Import prices fell 1.3% over the past year. The price index for U.S.
Import & Export Price Index        exports rose 0.3% in December. Export prices increased 1.1% year-over-year.
                                   (Source: Bureau of Labor Statistics)
                                   •   Amazon is the most reputable company in America according to the annual Harris Poll RQ study.
                                       Amazon.com upset last year’s most reputable company, Apple, which ranks second in 2013. The Harris
Multimodal News Clips:
                                       Poll Reputation Quotient surveys 14,000 members of the general public to measure the reputations of the
                                       sixty most visible companies in the country. (Source: Harris Interactive)

                                   •   U.S. exports of goods and services reached a record $2.2 trillion in 2012. Exports in 2012 outpaced the
                                       growth in imports for the first time since 2007. Exports as a share of U.S. GDP were 13.9% in 2012,
                                       matching the record set in 2011. (Source: US Department of Commerce)


RAIL:
                                   Railroad bulk carload freight in January 2013 fell 3.9% from December 2012. Freight traffic in January fell
U.S. Freight Rail Traffic          6.3% from January 2012. Carloads excluding coal and grain increased 1.8% over the previous year.
                                   (Source: AAR.org) (Report includes rail car-loadings by 19 different major commodity categories as well as intermodal units)
                                   Intermodal rail traffic in January 2013 was 5.3% higher than in January 2012 and 2.4% higher than December
U.S. Intermodal Rail Traffic       2012 totals. Intermodal loadings have experienced year-over-year gains for 38 straight months.
                                   (Source: AAR.org) (Report includes rail car-loadings by 19 different major commodity categories as well as intermodal units)

                                   The index of average railroad fuel prices in December was 612.8, down 1.4% from the previous month and
Railroad Fuel Price Index          4.4% higher year-over-year. (Source: AAR.org)
                                   (Average monthly price for gallons purchased by freight railroads; Includes federal excise taxes, transportation, and handling expenses)

                                   The number of freight cars in storage has decreased to 315,514 (20.6% of the fleet) on February 1, down
Freight Cars in Storage            1,709 cars from a month earlier. (Source: AAR.org)
                                   (A freight car is "in storage" if it has had a loaded revenue move since 2005, but not in the past 60 days. Decrease here = more demand)

                                   Railroad employment in December 2012 decreased by 114 employees to 162,652 employees. Total Class 1
Class 1 Railroad Employment
                                   rail employment in December 2012 was 0.07% lower than it was in December 2011. (Source: U.S. STB)
                                   In January 2013, short line railroad shipments across North America rose 5.6% compared to the same month
Short Line Rail Traffic            last year. A sampling of about 427 small railroads in the U.S. and Canada loaded 676,818 railcars and
                                   intermodal units during the month of January. (Source: RMI RailConnect Index | rmiondemand.com)

                                   •   Intermodal container volumes hit a record high in 2012 with 13.1 million moves, a 5.9% increase year-
                                       over-year. Total intermodal shipments in 2012 grew 4%. Domestic container shipments topped 5 million
Railroad News Clips:
                                       for the first time, reflecting a growth rate of 12.2% over 2011 activity. International containers had the
                                       largest share of intermodal loadings, accounting for 52% of the total. (Source: IANA | intermodal.org)
                                   •   Major freight railroads in the U.S. plan to invest an estimated $24.5 billion in 2013 to build, maintain and
                                       upgrade America’s rail network. This investment includes $13 billion in projected capital expenditures,
                                       which go toward upgrading or enhancing rail network capacity in the year ahead. Freight railroads also
                                       expect to hire more than 11,000 employees this year. (Source: AAR.org)

                                                                                1
FEBRUARY 2013
                                            LOGISTICS MARKET SNAPSHOT
  Fueling Logistics Competitiveness                                                          Prepared: February 18, 2013


TRUCKING:
                                 The ATA’s seasonally adjusted cargo index rose 2.8% in December after rising 3.9% in November. The for-
Trucking Volume
                                 hire truck tonnage index fell 2.3% year-over-year. (Source: American Trucking Association | Trucking.org)
                                 The spot market for truckload freight in January rose 18% compared to the previous month, and was 28%
Truckload Freight                higher year-over-year. Truck capacity rose 19% for the month, and was up 21% year-over-year.
                                 (Source: TransCore Freight Index | www.transcorefreightsolutions.com)

                                 U.S. average diesel prices rose to $4.10 per gallon, up 8.2¢ since last week. The U.S. average diesel price was
Diesel Prices                    16¢ higher than the same week last year. The average price of diesel in the lower Atlantic states was $4.08
                                 per gallon. (Source: U.S. DOE) (Reflects the costs and profits of the entire production and distribution chain.)

                                 The trucking industry added 5,000 jobs in January. The trucking workforce increased 0.36% over the
Trucking Employment
                                 previous month and rose 3.6% over the previous year. (Source: U.S. Bureau of Labor Statistics)
                                 Orders for heavy-duty Class 8 trucks in North America are expected to total 22,235 units in January 2012.
Truck Orders                     January orders were 7% higher than the previous month, and 11% lower year-over-year.
                                 (Source: FTR Associates | ftrassociates.com)
                                 Surface transport-related trade between the U.S. and its NAFTA partners, Canada and Mexico, was up 6.2%
NAFTA Trade
                                 in November compared to the same month in 2011, totaling $81.5 billion. (Source: US DOT)

                                 •    Saia, the Georgia-based carrier, reported a 2012 profit of $32 million, jumping 181.8% from the $11.4
Trucking News Clips:
                                      million in 2011. Yearly revenue was $1.1 billion, up 6.7% from $1 billion the previous year.

                                 •    C.H. Robinson’s net income rose 38% to $593.8 million in 2012. Revenue in 2012 totaled $11.36 billion, an
                                      increase of 10% over the previous year.


AIR FREIGHT:
Air Cargo Traffic                Global air freight traffic in December decreased 0.3% from one year ago and rose 0.8% from the previous
                                 month. North American air freight in December fell 0.7% year-over-year. (Source: IATA.org)
                                 (Global air freight covers international and domestic scheduled air traffic. North American traffic includes only domestic freight traffic.)

                                 In December, Hartsfield-Jackson Atlanta International Airport transported 54,212 metric tons of cargo, a 3%
Atlanta Air Cargo Traffic
                                 decrease from the previous month and a 5% decrease year-over-year. (Source: HJIA)

                                 Drewry’s recently launched East-West Air Freight Price Index fell by 1.4 points from November to reach
Air Freight Price Index          110.8 in December. This brought to an end four consecutive months of gains in the index in which its value
                                 had risen by over 20 points since the low of July. (Source: Drewry - www.drewry.co.uk) (The Drewry Air East-West Air
                                 Freight Price Index is a weighted average of airfreight rates across 21 East-West trades.)

Jet Fuel Prices                  As of February 8, 2013, the global average jet fuel price was $140 per barrel; up 6.9% from the previous
                                 month, and 4.1% higher year-over-year. (Source: IATA.org, platts.com)
                                 (The weekly index and price data shows the global average price paid at the refinery for aviation jet fuel)

                                 •    American Airlines and US Airways announced a merger that will create one of the world’s largest airlines.
Air Freight News Clips:               The two carriers are collectively worth about $11 billion. The combined airline will operate under the
                                      American Airlines name.
                                 •    Atlas Air Worldwide’s net income surged 56% to a record $52.4 million in 4Q 2012. For the full year of
                                      2012, profit was $129.9 million, a 35% increase over 2011. Annual revenue rose 18% year-over-year to
                                      $1.7 billion.


                                                                               2
FEBRUARY 2013
                                            LOGISTICS MARKET SNAPSHOT
  Fueling Logistics Competitiveness                                                         Prepared: February 18, 2013


OCEAN FREIGHT:
                                 Import shipment volume, in TEUs, at U.S. ports increased 6.9% in January from the previous month and rose
Import Volumes                   0.1% year-over-year. Over 1.5 million TEUs were imported in January, and shipments were over 750,000.
                                 (Source: Zepol Corporation | zepol.com)
                                                    th
                                 The February 8 SCFI comprehensive reading was $1,208 per FEU; down 11% from the previous week, and
Shanghai Containerized           24.5% higher year-over-year. The spot rate for shipments to the U.S. East Coast was $3,606 per FEU, up
Freight Index                    21.9% over the previous year. (Source: Shanghai Shipping Exchange | www1.chineseshipping.com.cn/en)
                                 (The Shanghai Containerized Freight Index is a weekly reported average export spot rate from Shanghai for 15 different trade lanes.)

                                 The Baltic Dry Index rose 8.9% in January, ending at 760. The BDI has remained steady during the first half of
Ocean Bulk Freight Rates         February. (Source: www.bloomberg.com/quote/BDIY:IND)
                                 (The Baltic Dry Index is an index that tracks and averages worldwide international shipping prices of various dry bulk cargoes.)
                                 Between January 1 and March 31, 2013, the bunker fuel surcharge will total $553 per FEU for shipments to
TSA Bunker Surcharges            the West coast ocean ports and $1,050 per FEU for shipments to the East coast and Gulf ports.
                                 (Source: Transpacific Stabilization Agreement) (The Transpacific Stabilization Agreement is a research and discussion forum of major
                                 ocean container shipping lines that carry cargo from Asia to ports in the U.S.)
                                 The Georgia Ports Authority moved 2.27 million tons of cargo in December 2012, an 11.7% increase year-
Port of Savannah                 over-year. December’s container tonnage increased by 4.2% to reach 1.76 million tons and 219,128 TEUs.
                                 (Source: GPA)
                                 The Port of Brunswick combined with the Port of Savannah to move a total of 54,884 auto and machinery
Port of Brunswick                units, an increase of 18.2%, making December the fifth-busiest month on record for Roll-on/Roll-off cargo.
                                 (Source: GPA)

                                 •    Import volume through major U.S. container ports is expected to increase 8.5% in February. Total U.S.
Ocean Freight Business News:          containerized imports in 2013 are expected to increase 3.4%, slightly less than the preliminary 4.2%
                                      growth seen in 2012. (Source: NRF/Hackett Associates)
                                 •    Liquefied natural gas will soon be exported from Savannah’s Elba Island. Shell US Gas & Power LLC and
                                      Southern Liquefaction Co. will invest in pipelines to move natural gas to the terminal and will make
                                      modifications enabling the liquefied gas to be pumped onto outbound ships. The project has received U.S.
                                      Department of Energy clearance to export up to 4 million tons per year to countries with which the US has
                                      free trade agreements.
                                 •    UPS expanded its direct Less-than-container load offering to more than 300 additional lanes in 2012 to
                                      meet growing global market demands. UPS now operates more than 1,700 direct LCL lanes servicing 116
                                      countries. In Asia alone, UPS added 139 outbound lanes to connect retailers and suppliers in the global
                                      market.

WAREHOUSING & DISTRIBUTION:
                                 The U.S. average industrial vacancy rate was 8.9% during Q4 2012, down from 9.1% in the previous quarter.
Industrial Vacancy
                                 Overall vacancy was 10.1% in the South and 13.4% in Atlanta during the fourth quarter. (Source: Cassidy Turley)
                                 In Q4 2012, warehouse and distribution rental rates in the US averaged $5.00 per square foot. Rental rates
Warehouse Rent Rates             for warehouse space averaged $4.52/square foot in the South and $3.42/square foot in Atlanta.
                                 (Source: Cassidy Turley)
                                 Net absorption in the US during Q4 2012 totaled nearly +40.9 million square feet, a 44% increase over the
                                 same quarter in 2011. The South led all regions with +20.4 million square feet. Absorption totaled more
Industrial Absorption            than +1.8 million square feet in Atlanta. (Source: Cassidy Turley)
                                 (Absorption is the net change in occupied space between two points in time. Positive absorption means that previously unoccupied space is
                                 being occupied.)
                                 The National PMI rose 2.9 points to 53.1 in January 2013. New orders rose 3.6 points to 53.3 and production
Purchasing Managers Index        increased 1 point to 53.6. (Source: Institute for Supply Management)
                                 (The PMI combines data on new orders, inventory, production, supplier deliveries, and employment. A reading above 50 indicates that the
                                 manufacturing economy is generally expanding.)

                                 Georgia’s PMI rose 9.8 points to 55 in January. New orders in Georgia surged 21.6 points to 59.6 and
Purchasing Managers Index        production spiked 19.8 points to 55.8. Georgia’s PMI is 2.7 points higher than the national PMI.
in Georgia                       (Source: Kennesaw State University) (The PMI combines data on new orders, inventory, production, supplier deliveries, and
                                 employment. A reading above 50 indicates that the manufacturing economy is generally expanding.)


                                                                              3
FEBRUARY 2013
                                             LOGISTICS MARKET SNAPSHOT
  Fueling Logistics Competitiveness                                                        Prepared: February 18, 2013


                                  •   Norton Packaging is creating 90 new jobs and investing $12 million in a new manufacturing facility in
W&D Business News:                    Jasper County, Georgia. The 76,000 square-foot facility will service the southeast region of the United
                                      States as well as Puerto Rico and Europe.

                                  •   Haier America has chosen Georgia as its logistics hub for the Southeast U.S. The company will move its
                                      home appliances and air conditioners through its 230,000 square-foot distribution center near Savannah.
                                      Haier has cited the approved port deepening project and the number of shipping services calling on
                                      Savannah as factors in the selection of its newest facility.


U.S. MARKET:
                                  The U.S. GDP decreased 0.1% in the fourth quarter of 2012 according to the first preliminary estimate
Gross Domestic Product
                                  released by the Bureau of Economic Analysis. (Source: US BEA)
                                  The U.S. trade deficit decreased by 20.7% in December to $38.5 billion, the lowest deficit since January
U.S. Trade Deficit                2010. Exports rose 2.1% to $186.4 billion and imports fell 2.7% to $224.9 billion.
                                  (Source: US DOC & Census Bureau)
                                  The Consumer Confidence Index decreased to 58.6 in January 2013 from 66.7 in December 2012.
Consumer Confidence               (Source: The Conference Board) (The consumer confidence index is based on a monthly survey of 5,000 U.S. households. It is designed
                                  to gauge the financial health, spending power, and confidence of the average U.S. consumer.)
                                  The unemployment rate in America increased to 7.9% in January 2013 as there were 157,000 net new jobs.
Unemployment Rate
                                  (Source: US DOL)

                                  The Leading Economic Index for the U.S. increased 0.5% in December to 93.9 (2004=100), following no change
Leading Economic Index            in November and a 0.3% increase in October. (Source: Conference Board)
                                  (The LEI is a composite of 10 economic indicators that together create an analytic system designed to signal peaks and troughs in the
                                  business cycle. The LEI reveals patterns in economic data in a clearer and more convincing manner than any individual component alone.)

                                  Retail and food service sales rose in January to $416.6 billion, up 0.1% from the previous month, and up
Retail Sales
                                  4.4% above January 2012. Non-store retailer sales were up 15.7% from last year. (Source: US Census)
                                  Total combined sales and manufacturing shipments totaled $1.27 Trillion in December 2012, up 0.3% from
Manufacturing & Trade Sales
                                  November and up 3.6% from the previous year. (Source: US Census)
                                  Total value of inventory on hand is estimated at $1.62 Trillion in December 2012, up 0.1% from November
Manufacturing & Trade Inventory
                                  and up 5.1% from December 2011. (Source: US Census)
                                  In December, housing starts rose 12.1% to an annual rate of 954,000 units. December’s pace of residential
                                  groundbreaking was the fastest since June 2008. An estimated 780,000 housing units were started in 2012; a
Housing Starts
                                  28.1% increase over housing starts in 2011. Building permits (an indicator of future housing starts) rose 0.3%
                                  to an annual rate of 903,000. (Source: U.S. DOC)
                                  The consumer price index for all urban consumers decreased 0.3% in November from the previous month.
                                  Over the last 12 months, the all items index increased 1.8%. The producer price index for finished goods
Consumer & Producer Price Index
                                  decreased 0.2% in December from the previous month. Prices for finished goods rose 1.3% over the
                                  previous year. (Source: US Bureau of Labor Statistics)


      To sign-up to receive these free monthly snapshots, visit: www.GeorgiaLogistics.com
          For more information about the Logistics Market Snapshot or the many other
     resources and activities of the Georgia Center of Innovation for Logistics please contact:
             Page Siplon, Executive Director – psiplon@georgia.org – 912.966.7867


                                                                             4

Contenu connexe

Dernier

Understanding the Pakistan Budgeting Process: Basics and Key Insights
Understanding the Pakistan Budgeting Process: Basics and Key InsightsUnderstanding the Pakistan Budgeting Process: Basics and Key Insights
Understanding the Pakistan Budgeting Process: Basics and Key Insightsseribangash
 
Event mailer assignment progress report .pdf
Event mailer assignment progress report .pdfEvent mailer assignment progress report .pdf
Event mailer assignment progress report .pdftbatkhuu1
 
M.C Lodges -- Guest House in Jhang.
M.C Lodges --  Guest House in Jhang.M.C Lodges --  Guest House in Jhang.
M.C Lodges -- Guest House in Jhang.Aaiza Hassan
 
VIP Kolkata Call Girl Howrah 👉 8250192130 Available With Room
VIP Kolkata Call Girl Howrah 👉 8250192130  Available With RoomVIP Kolkata Call Girl Howrah 👉 8250192130  Available With Room
VIP Kolkata Call Girl Howrah 👉 8250192130 Available With Roomdivyansh0kumar0
 
Cash Payment 9602870969 Escort Service in Udaipur Call Girls
Cash Payment 9602870969 Escort Service in Udaipur Call GirlsCash Payment 9602870969 Escort Service in Udaipur Call Girls
Cash Payment 9602870969 Escort Service in Udaipur Call GirlsApsara Of India
 
VIP Call Girls In Saharaganj ( Lucknow ) 🔝 8923113531 🔝 Cash Payment (COD) 👒
VIP Call Girls In Saharaganj ( Lucknow  ) 🔝 8923113531 🔝  Cash Payment (COD) 👒VIP Call Girls In Saharaganj ( Lucknow  ) 🔝 8923113531 🔝  Cash Payment (COD) 👒
VIP Call Girls In Saharaganj ( Lucknow ) 🔝 8923113531 🔝 Cash Payment (COD) 👒anilsa9823
 
Call Girls In DLf Gurgaon ➥99902@11544 ( Best price)100% Genuine Escort In 24...
Call Girls In DLf Gurgaon ➥99902@11544 ( Best price)100% Genuine Escort In 24...Call Girls In DLf Gurgaon ➥99902@11544 ( Best price)100% Genuine Escort In 24...
Call Girls In DLf Gurgaon ➥99902@11544 ( Best price)100% Genuine Escort In 24...lizamodels9
 
Lucknow 💋 Escorts in Lucknow - 450+ Call Girl Cash Payment 8923113531 Neha Th...
Lucknow 💋 Escorts in Lucknow - 450+ Call Girl Cash Payment 8923113531 Neha Th...Lucknow 💋 Escorts in Lucknow - 450+ Call Girl Cash Payment 8923113531 Neha Th...
Lucknow 💋 Escorts in Lucknow - 450+ Call Girl Cash Payment 8923113531 Neha Th...anilsa9823
 
Yaroslav Rozhankivskyy: Три складові і три передумови максимальної продуктивн...
Yaroslav Rozhankivskyy: Три складові і три передумови максимальної продуктивн...Yaroslav Rozhankivskyy: Три складові і три передумови максимальної продуктивн...
Yaroslav Rozhankivskyy: Три складові і три передумови максимальної продуктивн...Lviv Startup Club
 
Regression analysis: Simple Linear Regression Multiple Linear Regression
Regression analysis:  Simple Linear Regression Multiple Linear RegressionRegression analysis:  Simple Linear Regression Multiple Linear Regression
Regression analysis: Simple Linear Regression Multiple Linear RegressionRavindra Nath Shukla
 
Value Proposition canvas- Customer needs and pains
Value Proposition canvas- Customer needs and painsValue Proposition canvas- Customer needs and pains
Value Proposition canvas- Customer needs and painsP&CO
 
Creating Low-Code Loan Applications using the Trisotech Mortgage Feature Set
Creating Low-Code Loan Applications using the Trisotech Mortgage Feature SetCreating Low-Code Loan Applications using the Trisotech Mortgage Feature Set
Creating Low-Code Loan Applications using the Trisotech Mortgage Feature SetDenis Gagné
 
0183760ssssssssssssssssssssssssssss00101011 (27).pdf
0183760ssssssssssssssssssssssssssss00101011 (27).pdf0183760ssssssssssssssssssssssssssss00101011 (27).pdf
0183760ssssssssssssssssssssssssssss00101011 (27).pdfRenandantas16
 
Unlocking the Secrets of Affiliate Marketing.pdf
Unlocking the Secrets of Affiliate Marketing.pdfUnlocking the Secrets of Affiliate Marketing.pdf
Unlocking the Secrets of Affiliate Marketing.pdfOnline Income Engine
 
The Coffee Bean & Tea Leaf(CBTL), Business strategy case study
The Coffee Bean & Tea Leaf(CBTL), Business strategy case studyThe Coffee Bean & Tea Leaf(CBTL), Business strategy case study
The Coffee Bean & Tea Leaf(CBTL), Business strategy case studyEthan lee
 
Monthly Social Media Update April 2024 pptx.pptx
Monthly Social Media Update April 2024 pptx.pptxMonthly Social Media Update April 2024 pptx.pptx
Monthly Social Media Update April 2024 pptx.pptxAndy Lambert
 
7.pdf This presentation captures many uses and the significance of the number...
7.pdf This presentation captures many uses and the significance of the number...7.pdf This presentation captures many uses and the significance of the number...
7.pdf This presentation captures many uses and the significance of the number...Paul Menig
 
Call Girls Pune Just Call 9907093804 Top Class Call Girl Service Available
Call Girls Pune Just Call 9907093804 Top Class Call Girl Service AvailableCall Girls Pune Just Call 9907093804 Top Class Call Girl Service Available
Call Girls Pune Just Call 9907093804 Top Class Call Girl Service AvailableDipal Arora
 

Dernier (20)

Understanding the Pakistan Budgeting Process: Basics and Key Insights
Understanding the Pakistan Budgeting Process: Basics and Key InsightsUnderstanding the Pakistan Budgeting Process: Basics and Key Insights
Understanding the Pakistan Budgeting Process: Basics and Key Insights
 
Event mailer assignment progress report .pdf
Event mailer assignment progress report .pdfEvent mailer assignment progress report .pdf
Event mailer assignment progress report .pdf
 
M.C Lodges -- Guest House in Jhang.
M.C Lodges --  Guest House in Jhang.M.C Lodges --  Guest House in Jhang.
M.C Lodges -- Guest House in Jhang.
 
VIP Kolkata Call Girl Howrah 👉 8250192130 Available With Room
VIP Kolkata Call Girl Howrah 👉 8250192130  Available With RoomVIP Kolkata Call Girl Howrah 👉 8250192130  Available With Room
VIP Kolkata Call Girl Howrah 👉 8250192130 Available With Room
 
Cash Payment 9602870969 Escort Service in Udaipur Call Girls
Cash Payment 9602870969 Escort Service in Udaipur Call GirlsCash Payment 9602870969 Escort Service in Udaipur Call Girls
Cash Payment 9602870969 Escort Service in Udaipur Call Girls
 
VIP Call Girls In Saharaganj ( Lucknow ) 🔝 8923113531 🔝 Cash Payment (COD) 👒
VIP Call Girls In Saharaganj ( Lucknow  ) 🔝 8923113531 🔝  Cash Payment (COD) 👒VIP Call Girls In Saharaganj ( Lucknow  ) 🔝 8923113531 🔝  Cash Payment (COD) 👒
VIP Call Girls In Saharaganj ( Lucknow ) 🔝 8923113531 🔝 Cash Payment (COD) 👒
 
Call Girls In DLf Gurgaon ➥99902@11544 ( Best price)100% Genuine Escort In 24...
Call Girls In DLf Gurgaon ➥99902@11544 ( Best price)100% Genuine Escort In 24...Call Girls In DLf Gurgaon ➥99902@11544 ( Best price)100% Genuine Escort In 24...
Call Girls In DLf Gurgaon ➥99902@11544 ( Best price)100% Genuine Escort In 24...
 
Lucknow 💋 Escorts in Lucknow - 450+ Call Girl Cash Payment 8923113531 Neha Th...
Lucknow 💋 Escorts in Lucknow - 450+ Call Girl Cash Payment 8923113531 Neha Th...Lucknow 💋 Escorts in Lucknow - 450+ Call Girl Cash Payment 8923113531 Neha Th...
Lucknow 💋 Escorts in Lucknow - 450+ Call Girl Cash Payment 8923113531 Neha Th...
 
Yaroslav Rozhankivskyy: Три складові і три передумови максимальної продуктивн...
Yaroslav Rozhankivskyy: Три складові і три передумови максимальної продуктивн...Yaroslav Rozhankivskyy: Три складові і три передумови максимальної продуктивн...
Yaroslav Rozhankivskyy: Три складові і три передумови максимальної продуктивн...
 
Regression analysis: Simple Linear Regression Multiple Linear Regression
Regression analysis:  Simple Linear Regression Multiple Linear RegressionRegression analysis:  Simple Linear Regression Multiple Linear Regression
Regression analysis: Simple Linear Regression Multiple Linear Regression
 
Value Proposition canvas- Customer needs and pains
Value Proposition canvas- Customer needs and painsValue Proposition canvas- Customer needs and pains
Value Proposition canvas- Customer needs and pains
 
Creating Low-Code Loan Applications using the Trisotech Mortgage Feature Set
Creating Low-Code Loan Applications using the Trisotech Mortgage Feature SetCreating Low-Code Loan Applications using the Trisotech Mortgage Feature Set
Creating Low-Code Loan Applications using the Trisotech Mortgage Feature Set
 
0183760ssssssssssssssssssssssssssss00101011 (27).pdf
0183760ssssssssssssssssssssssssssss00101011 (27).pdf0183760ssssssssssssssssssssssssssss00101011 (27).pdf
0183760ssssssssssssssssssssssssssss00101011 (27).pdf
 
Unlocking the Secrets of Affiliate Marketing.pdf
Unlocking the Secrets of Affiliate Marketing.pdfUnlocking the Secrets of Affiliate Marketing.pdf
Unlocking the Secrets of Affiliate Marketing.pdf
 
Forklift Operations: Safety through Cartoons
Forklift Operations: Safety through CartoonsForklift Operations: Safety through Cartoons
Forklift Operations: Safety through Cartoons
 
The Coffee Bean & Tea Leaf(CBTL), Business strategy case study
The Coffee Bean & Tea Leaf(CBTL), Business strategy case studyThe Coffee Bean & Tea Leaf(CBTL), Business strategy case study
The Coffee Bean & Tea Leaf(CBTL), Business strategy case study
 
Monthly Social Media Update April 2024 pptx.pptx
Monthly Social Media Update April 2024 pptx.pptxMonthly Social Media Update April 2024 pptx.pptx
Monthly Social Media Update April 2024 pptx.pptx
 
Nepali Escort Girl Kakori \ 9548273370 Indian Call Girls Service Lucknow ₹,9517
Nepali Escort Girl Kakori \ 9548273370 Indian Call Girls Service Lucknow ₹,9517Nepali Escort Girl Kakori \ 9548273370 Indian Call Girls Service Lucknow ₹,9517
Nepali Escort Girl Kakori \ 9548273370 Indian Call Girls Service Lucknow ₹,9517
 
7.pdf This presentation captures many uses and the significance of the number...
7.pdf This presentation captures many uses and the significance of the number...7.pdf This presentation captures many uses and the significance of the number...
7.pdf This presentation captures many uses and the significance of the number...
 
Call Girls Pune Just Call 9907093804 Top Class Call Girl Service Available
Call Girls Pune Just Call 9907093804 Top Class Call Girl Service AvailableCall Girls Pune Just Call 9907093804 Top Class Call Girl Service Available
Call Girls Pune Just Call 9907093804 Top Class Call Girl Service Available
 

En vedette

2024 State of Marketing Report – by Hubspot
2024 State of Marketing Report – by Hubspot2024 State of Marketing Report – by Hubspot
2024 State of Marketing Report – by HubspotMarius Sescu
 
Everything You Need To Know About ChatGPT
Everything You Need To Know About ChatGPTEverything You Need To Know About ChatGPT
Everything You Need To Know About ChatGPTExpeed Software
 
Product Design Trends in 2024 | Teenage Engineerings
Product Design Trends in 2024 | Teenage EngineeringsProduct Design Trends in 2024 | Teenage Engineerings
Product Design Trends in 2024 | Teenage EngineeringsPixeldarts
 
How Race, Age and Gender Shape Attitudes Towards Mental Health
How Race, Age and Gender Shape Attitudes Towards Mental HealthHow Race, Age and Gender Shape Attitudes Towards Mental Health
How Race, Age and Gender Shape Attitudes Towards Mental HealthThinkNow
 
AI Trends in Creative Operations 2024 by Artwork Flow.pdf
AI Trends in Creative Operations 2024 by Artwork Flow.pdfAI Trends in Creative Operations 2024 by Artwork Flow.pdf
AI Trends in Creative Operations 2024 by Artwork Flow.pdfmarketingartwork
 
PEPSICO Presentation to CAGNY Conference Feb 2024
PEPSICO Presentation to CAGNY Conference Feb 2024PEPSICO Presentation to CAGNY Conference Feb 2024
PEPSICO Presentation to CAGNY Conference Feb 2024Neil Kimberley
 
Content Methodology: A Best Practices Report (Webinar)
Content Methodology: A Best Practices Report (Webinar)Content Methodology: A Best Practices Report (Webinar)
Content Methodology: A Best Practices Report (Webinar)contently
 
How to Prepare For a Successful Job Search for 2024
How to Prepare For a Successful Job Search for 2024How to Prepare For a Successful Job Search for 2024
How to Prepare For a Successful Job Search for 2024Albert Qian
 
Social Media Marketing Trends 2024 // The Global Indie Insights
Social Media Marketing Trends 2024 // The Global Indie InsightsSocial Media Marketing Trends 2024 // The Global Indie Insights
Social Media Marketing Trends 2024 // The Global Indie InsightsKurio // The Social Media Age(ncy)
 
Trends In Paid Search: Navigating The Digital Landscape In 2024
Trends In Paid Search: Navigating The Digital Landscape In 2024Trends In Paid Search: Navigating The Digital Landscape In 2024
Trends In Paid Search: Navigating The Digital Landscape In 2024Search Engine Journal
 
5 Public speaking tips from TED - Visualized summary
5 Public speaking tips from TED - Visualized summary5 Public speaking tips from TED - Visualized summary
5 Public speaking tips from TED - Visualized summarySpeakerHub
 
ChatGPT and the Future of Work - Clark Boyd
ChatGPT and the Future of Work - Clark Boyd ChatGPT and the Future of Work - Clark Boyd
ChatGPT and the Future of Work - Clark Boyd Clark Boyd
 
Getting into the tech field. what next
Getting into the tech field. what next Getting into the tech field. what next
Getting into the tech field. what next Tessa Mero
 
Google's Just Not That Into You: Understanding Core Updates & Search Intent
Google's Just Not That Into You: Understanding Core Updates & Search IntentGoogle's Just Not That Into You: Understanding Core Updates & Search Intent
Google's Just Not That Into You: Understanding Core Updates & Search IntentLily Ray
 
Time Management & Productivity - Best Practices
Time Management & Productivity -  Best PracticesTime Management & Productivity -  Best Practices
Time Management & Productivity - Best PracticesVit Horky
 
The six step guide to practical project management
The six step guide to practical project managementThe six step guide to practical project management
The six step guide to practical project managementMindGenius
 
Beginners Guide to TikTok for Search - Rachel Pearson - We are Tilt __ Bright...
Beginners Guide to TikTok for Search - Rachel Pearson - We are Tilt __ Bright...Beginners Guide to TikTok for Search - Rachel Pearson - We are Tilt __ Bright...
Beginners Guide to TikTok for Search - Rachel Pearson - We are Tilt __ Bright...RachelPearson36
 

En vedette (20)

2024 State of Marketing Report – by Hubspot
2024 State of Marketing Report – by Hubspot2024 State of Marketing Report – by Hubspot
2024 State of Marketing Report – by Hubspot
 
Everything You Need To Know About ChatGPT
Everything You Need To Know About ChatGPTEverything You Need To Know About ChatGPT
Everything You Need To Know About ChatGPT
 
Product Design Trends in 2024 | Teenage Engineerings
Product Design Trends in 2024 | Teenage EngineeringsProduct Design Trends in 2024 | Teenage Engineerings
Product Design Trends in 2024 | Teenage Engineerings
 
How Race, Age and Gender Shape Attitudes Towards Mental Health
How Race, Age and Gender Shape Attitudes Towards Mental HealthHow Race, Age and Gender Shape Attitudes Towards Mental Health
How Race, Age and Gender Shape Attitudes Towards Mental Health
 
AI Trends in Creative Operations 2024 by Artwork Flow.pdf
AI Trends in Creative Operations 2024 by Artwork Flow.pdfAI Trends in Creative Operations 2024 by Artwork Flow.pdf
AI Trends in Creative Operations 2024 by Artwork Flow.pdf
 
Skeleton Culture Code
Skeleton Culture CodeSkeleton Culture Code
Skeleton Culture Code
 
PEPSICO Presentation to CAGNY Conference Feb 2024
PEPSICO Presentation to CAGNY Conference Feb 2024PEPSICO Presentation to CAGNY Conference Feb 2024
PEPSICO Presentation to CAGNY Conference Feb 2024
 
Content Methodology: A Best Practices Report (Webinar)
Content Methodology: A Best Practices Report (Webinar)Content Methodology: A Best Practices Report (Webinar)
Content Methodology: A Best Practices Report (Webinar)
 
How to Prepare For a Successful Job Search for 2024
How to Prepare For a Successful Job Search for 2024How to Prepare For a Successful Job Search for 2024
How to Prepare For a Successful Job Search for 2024
 
Social Media Marketing Trends 2024 // The Global Indie Insights
Social Media Marketing Trends 2024 // The Global Indie InsightsSocial Media Marketing Trends 2024 // The Global Indie Insights
Social Media Marketing Trends 2024 // The Global Indie Insights
 
Trends In Paid Search: Navigating The Digital Landscape In 2024
Trends In Paid Search: Navigating The Digital Landscape In 2024Trends In Paid Search: Navigating The Digital Landscape In 2024
Trends In Paid Search: Navigating The Digital Landscape In 2024
 
5 Public speaking tips from TED - Visualized summary
5 Public speaking tips from TED - Visualized summary5 Public speaking tips from TED - Visualized summary
5 Public speaking tips from TED - Visualized summary
 
ChatGPT and the Future of Work - Clark Boyd
ChatGPT and the Future of Work - Clark Boyd ChatGPT and the Future of Work - Clark Boyd
ChatGPT and the Future of Work - Clark Boyd
 
Getting into the tech field. what next
Getting into the tech field. what next Getting into the tech field. what next
Getting into the tech field. what next
 
Google's Just Not That Into You: Understanding Core Updates & Search Intent
Google's Just Not That Into You: Understanding Core Updates & Search IntentGoogle's Just Not That Into You: Understanding Core Updates & Search Intent
Google's Just Not That Into You: Understanding Core Updates & Search Intent
 
How to have difficult conversations
How to have difficult conversations How to have difficult conversations
How to have difficult conversations
 
Introduction to Data Science
Introduction to Data ScienceIntroduction to Data Science
Introduction to Data Science
 
Time Management & Productivity - Best Practices
Time Management & Productivity -  Best PracticesTime Management & Productivity -  Best Practices
Time Management & Productivity - Best Practices
 
The six step guide to practical project management
The six step guide to practical project managementThe six step guide to practical project management
The six step guide to practical project management
 
Beginners Guide to TikTok for Search - Rachel Pearson - We are Tilt __ Bright...
Beginners Guide to TikTok for Search - Rachel Pearson - We are Tilt __ Bright...Beginners Guide to TikTok for Search - Rachel Pearson - We are Tilt __ Bright...
Beginners Guide to TikTok for Search - Rachel Pearson - We are Tilt __ Bright...
 

Logistics Market Snapshot Feb 2013

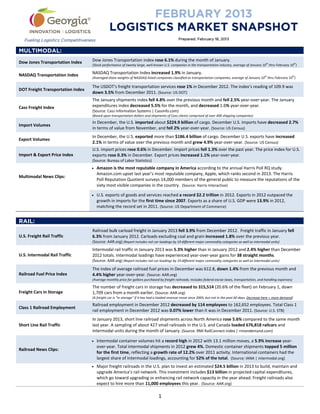
  • 1. FEBRUARY 2013 LOGISTICS MARKET SNAPSHOT Fueling Logistics Competitiveness Prepared: February 18, 2013 MULTIMODAL: Dow Jones Transportation Index Dow Jones Transportation index rose 6.1% during the month of January. (Stock performance of twenty large, well-known U.S. companies in the transportation industry, average of January 10th thru February 10th) NASDAQ Transportation Index NASDAQ Transportation Index increased 1.9% in January. th th (Averaged share weights of NASDAQ-listed companies classified as transportation companies, average of January 10 thru February 10 ) The USDOT's freight transportation services rose 1% in December 2012. The index’s reading of 109.9 was DOT Freight Transportation Index down 3.5% from December 2011. (Source: US DOT) The January shipments index fell 4.8% over the previous month and fell 2.5% year-over-year. The January Cass Freight Index expenditures index decreased 5.5% for the month, and decreased 1.6% year-over-year. (Source: Cass Information Systems | Cassinfo.com) (Based upon transportation dollars and shipments of Cass clients comprised of over 400 shipping companies) In December, the U.S. imported about $224.9 billion of cargo. December U.S. imports have decreased 2.7% Import Volumes in terms of value from November, and fell 2% year-over-year. (Source: US Census) In December, the U.S. exported more than $186.4 billion of cargo. December U.S. exports have increased Export Volumes 2.1% in terms of value over the previous month and grew 4.9% year-over-year. (Source: US Census) U.S. import prices rose 0.6% in December. Import prices fell 1.3% over the past year. The price index for U.S. Import & Export Price Index exports rose 0.3% in December. Export prices increased 1.1% year-over-year. (Source: Bureau of Labor Statistics) • Amazon is the most reputable company in America according to the annual Harris Poll RQ study. Amazon.com upset last year’s most reputable company, Apple, which ranks second in 2013. The Harris Multimodal News Clips: Poll Reputation Quotient surveys 14,000 members of the general public to measure the reputations of the sixty most visible companies in the country. (Source: Harris Interactive) • U.S. exports of goods and services reached a record $2.2 trillion in 2012. Exports in 2012 outpaced the growth in imports for the first time since 2007. Exports as a share of U.S. GDP were 13.9% in 2012, matching the record set in 2011. (Source: US Department of Commerce) RAIL: Railroad bulk carload freight in January 2013 fell 3.9% from December 2012. Freight traffic in January fell U.S. Freight Rail Traffic 6.3% from January 2012. Carloads excluding coal and grain increased 1.8% over the previous year. (Source: AAR.org) (Report includes rail car-loadings by 19 different major commodity categories as well as intermodal units) Intermodal rail traffic in January 2013 was 5.3% higher than in January 2012 and 2.4% higher than December U.S. Intermodal Rail Traffic 2012 totals. Intermodal loadings have experienced year-over-year gains for 38 straight months. (Source: AAR.org) (Report includes rail car-loadings by 19 different major commodity categories as well as intermodal units) The index of average railroad fuel prices in December was 612.8, down 1.4% from the previous month and Railroad Fuel Price Index 4.4% higher year-over-year. (Source: AAR.org) (Average monthly price for gallons purchased by freight railroads; Includes federal excise taxes, transportation, and handling expenses) The number of freight cars in storage has decreased to 315,514 (20.6% of the fleet) on February 1, down Freight Cars in Storage 1,709 cars from a month earlier. (Source: AAR.org) (A freight car is "in storage" if it has had a loaded revenue move since 2005, but not in the past 60 days. Decrease here = more demand) Railroad employment in December 2012 decreased by 114 employees to 162,652 employees. Total Class 1 Class 1 Railroad Employment rail employment in December 2012 was 0.07% lower than it was in December 2011. (Source: U.S. STB) In January 2013, short line railroad shipments across North America rose 5.6% compared to the same month Short Line Rail Traffic last year. A sampling of about 427 small railroads in the U.S. and Canada loaded 676,818 railcars and intermodal units during the month of January. (Source: RMI RailConnect Index | rmiondemand.com) • Intermodal container volumes hit a record high in 2012 with 13.1 million moves, a 5.9% increase year- over-year. Total intermodal shipments in 2012 grew 4%. Domestic container shipments topped 5 million Railroad News Clips: for the first time, reflecting a growth rate of 12.2% over 2011 activity. International containers had the largest share of intermodal loadings, accounting for 52% of the total. (Source: IANA | intermodal.org) • Major freight railroads in the U.S. plan to invest an estimated $24.5 billion in 2013 to build, maintain and upgrade America’s rail network. This investment includes $13 billion in projected capital expenditures, which go toward upgrading or enhancing rail network capacity in the year ahead. Freight railroads also expect to hire more than 11,000 employees this year. (Source: AAR.org) 1
  • 2. FEBRUARY 2013 LOGISTICS MARKET SNAPSHOT Fueling Logistics Competitiveness Prepared: February 18, 2013 TRUCKING: The ATA’s seasonally adjusted cargo index rose 2.8% in December after rising 3.9% in November. The for- Trucking Volume hire truck tonnage index fell 2.3% year-over-year. (Source: American Trucking Association | Trucking.org) The spot market for truckload freight in January rose 18% compared to the previous month, and was 28% Truckload Freight higher year-over-year. Truck capacity rose 19% for the month, and was up 21% year-over-year. (Source: TransCore Freight Index | www.transcorefreightsolutions.com) U.S. average diesel prices rose to $4.10 per gallon, up 8.2¢ since last week. The U.S. average diesel price was Diesel Prices 16¢ higher than the same week last year. The average price of diesel in the lower Atlantic states was $4.08 per gallon. (Source: U.S. DOE) (Reflects the costs and profits of the entire production and distribution chain.) The trucking industry added 5,000 jobs in January. The trucking workforce increased 0.36% over the Trucking Employment previous month and rose 3.6% over the previous year. (Source: U.S. Bureau of Labor Statistics) Orders for heavy-duty Class 8 trucks in North America are expected to total 22,235 units in January 2012. Truck Orders January orders were 7% higher than the previous month, and 11% lower year-over-year. (Source: FTR Associates | ftrassociates.com) Surface transport-related trade between the U.S. and its NAFTA partners, Canada and Mexico, was up 6.2% NAFTA Trade in November compared to the same month in 2011, totaling $81.5 billion. (Source: US DOT) • Saia, the Georgia-based carrier, reported a 2012 profit of $32 million, jumping 181.8% from the $11.4 Trucking News Clips: million in 2011. Yearly revenue was $1.1 billion, up 6.7% from $1 billion the previous year. • C.H. Robinson’s net income rose 38% to $593.8 million in 2012. Revenue in 2012 totaled $11.36 billion, an increase of 10% over the previous year. AIR FREIGHT: Air Cargo Traffic Global air freight traffic in December decreased 0.3% from one year ago and rose 0.8% from the previous month. North American air freight in December fell 0.7% year-over-year. (Source: IATA.org) (Global air freight covers international and domestic scheduled air traffic. North American traffic includes only domestic freight traffic.) In December, Hartsfield-Jackson Atlanta International Airport transported 54,212 metric tons of cargo, a 3% Atlanta Air Cargo Traffic decrease from the previous month and a 5% decrease year-over-year. (Source: HJIA) Drewry’s recently launched East-West Air Freight Price Index fell by 1.4 points from November to reach Air Freight Price Index 110.8 in December. This brought to an end four consecutive months of gains in the index in which its value had risen by over 20 points since the low of July. (Source: Drewry - www.drewry.co.uk) (The Drewry Air East-West Air Freight Price Index is a weighted average of airfreight rates across 21 East-West trades.) Jet Fuel Prices As of February 8, 2013, the global average jet fuel price was $140 per barrel; up 6.9% from the previous month, and 4.1% higher year-over-year. (Source: IATA.org, platts.com) (The weekly index and price data shows the global average price paid at the refinery for aviation jet fuel) • American Airlines and US Airways announced a merger that will create one of the world’s largest airlines. Air Freight News Clips: The two carriers are collectively worth about $11 billion. The combined airline will operate under the American Airlines name. • Atlas Air Worldwide’s net income surged 56% to a record $52.4 million in 4Q 2012. For the full year of 2012, profit was $129.9 million, a 35% increase over 2011. Annual revenue rose 18% year-over-year to $1.7 billion. 2
  • 3. FEBRUARY 2013 LOGISTICS MARKET SNAPSHOT Fueling Logistics Competitiveness Prepared: February 18, 2013 OCEAN FREIGHT: Import shipment volume, in TEUs, at U.S. ports increased 6.9% in January from the previous month and rose Import Volumes 0.1% year-over-year. Over 1.5 million TEUs were imported in January, and shipments were over 750,000. (Source: Zepol Corporation | zepol.com) th The February 8 SCFI comprehensive reading was $1,208 per FEU; down 11% from the previous week, and Shanghai Containerized 24.5% higher year-over-year. The spot rate for shipments to the U.S. East Coast was $3,606 per FEU, up Freight Index 21.9% over the previous year. (Source: Shanghai Shipping Exchange | www1.chineseshipping.com.cn/en) (The Shanghai Containerized Freight Index is a weekly reported average export spot rate from Shanghai for 15 different trade lanes.) The Baltic Dry Index rose 8.9% in January, ending at 760. The BDI has remained steady during the first half of Ocean Bulk Freight Rates February. (Source: www.bloomberg.com/quote/BDIY:IND) (The Baltic Dry Index is an index that tracks and averages worldwide international shipping prices of various dry bulk cargoes.) Between January 1 and March 31, 2013, the bunker fuel surcharge will total $553 per FEU for shipments to TSA Bunker Surcharges the West coast ocean ports and $1,050 per FEU for shipments to the East coast and Gulf ports. (Source: Transpacific Stabilization Agreement) (The Transpacific Stabilization Agreement is a research and discussion forum of major ocean container shipping lines that carry cargo from Asia to ports in the U.S.) The Georgia Ports Authority moved 2.27 million tons of cargo in December 2012, an 11.7% increase year- Port of Savannah over-year. December’s container tonnage increased by 4.2% to reach 1.76 million tons and 219,128 TEUs. (Source: GPA) The Port of Brunswick combined with the Port of Savannah to move a total of 54,884 auto and machinery Port of Brunswick units, an increase of 18.2%, making December the fifth-busiest month on record for Roll-on/Roll-off cargo. (Source: GPA) • Import volume through major U.S. container ports is expected to increase 8.5% in February. Total U.S. Ocean Freight Business News: containerized imports in 2013 are expected to increase 3.4%, slightly less than the preliminary 4.2% growth seen in 2012. (Source: NRF/Hackett Associates) • Liquefied natural gas will soon be exported from Savannah’s Elba Island. Shell US Gas & Power LLC and Southern Liquefaction Co. will invest in pipelines to move natural gas to the terminal and will make modifications enabling the liquefied gas to be pumped onto outbound ships. The project has received U.S. Department of Energy clearance to export up to 4 million tons per year to countries with which the US has free trade agreements. • UPS expanded its direct Less-than-container load offering to more than 300 additional lanes in 2012 to meet growing global market demands. UPS now operates more than 1,700 direct LCL lanes servicing 116 countries. In Asia alone, UPS added 139 outbound lanes to connect retailers and suppliers in the global market. WAREHOUSING & DISTRIBUTION: The U.S. average industrial vacancy rate was 8.9% during Q4 2012, down from 9.1% in the previous quarter. Industrial Vacancy Overall vacancy was 10.1% in the South and 13.4% in Atlanta during the fourth quarter. (Source: Cassidy Turley) In Q4 2012, warehouse and distribution rental rates in the US averaged $5.00 per square foot. Rental rates Warehouse Rent Rates for warehouse space averaged $4.52/square foot in the South and $3.42/square foot in Atlanta. (Source: Cassidy Turley) Net absorption in the US during Q4 2012 totaled nearly +40.9 million square feet, a 44% increase over the same quarter in 2011. The South led all regions with +20.4 million square feet. Absorption totaled more Industrial Absorption than +1.8 million square feet in Atlanta. (Source: Cassidy Turley) (Absorption is the net change in occupied space between two points in time. Positive absorption means that previously unoccupied space is being occupied.) The National PMI rose 2.9 points to 53.1 in January 2013. New orders rose 3.6 points to 53.3 and production Purchasing Managers Index increased 1 point to 53.6. (Source: Institute for Supply Management) (The PMI combines data on new orders, inventory, production, supplier deliveries, and employment. A reading above 50 indicates that the manufacturing economy is generally expanding.) Georgia’s PMI rose 9.8 points to 55 in January. New orders in Georgia surged 21.6 points to 59.6 and Purchasing Managers Index production spiked 19.8 points to 55.8. Georgia’s PMI is 2.7 points higher than the national PMI. in Georgia (Source: Kennesaw State University) (The PMI combines data on new orders, inventory, production, supplier deliveries, and employment. A reading above 50 indicates that the manufacturing economy is generally expanding.) 3
  • 4. FEBRUARY 2013 LOGISTICS MARKET SNAPSHOT Fueling Logistics Competitiveness Prepared: February 18, 2013 • Norton Packaging is creating 90 new jobs and investing $12 million in a new manufacturing facility in W&D Business News: Jasper County, Georgia. The 76,000 square-foot facility will service the southeast region of the United States as well as Puerto Rico and Europe. • Haier America has chosen Georgia as its logistics hub for the Southeast U.S. The company will move its home appliances and air conditioners through its 230,000 square-foot distribution center near Savannah. Haier has cited the approved port deepening project and the number of shipping services calling on Savannah as factors in the selection of its newest facility. U.S. MARKET: The U.S. GDP decreased 0.1% in the fourth quarter of 2012 according to the first preliminary estimate Gross Domestic Product released by the Bureau of Economic Analysis. (Source: US BEA) The U.S. trade deficit decreased by 20.7% in December to $38.5 billion, the lowest deficit since January U.S. Trade Deficit 2010. Exports rose 2.1% to $186.4 billion and imports fell 2.7% to $224.9 billion. (Source: US DOC & Census Bureau) The Consumer Confidence Index decreased to 58.6 in January 2013 from 66.7 in December 2012. Consumer Confidence (Source: The Conference Board) (The consumer confidence index is based on a monthly survey of 5,000 U.S. households. It is designed to gauge the financial health, spending power, and confidence of the average U.S. consumer.) The unemployment rate in America increased to 7.9% in January 2013 as there were 157,000 net new jobs. Unemployment Rate (Source: US DOL) The Leading Economic Index for the U.S. increased 0.5% in December to 93.9 (2004=100), following no change Leading Economic Index in November and a 0.3% increase in October. (Source: Conference Board) (The LEI is a composite of 10 economic indicators that together create an analytic system designed to signal peaks and troughs in the business cycle. The LEI reveals patterns in economic data in a clearer and more convincing manner than any individual component alone.) Retail and food service sales rose in January to $416.6 billion, up 0.1% from the previous month, and up Retail Sales 4.4% above January 2012. Non-store retailer sales were up 15.7% from last year. (Source: US Census) Total combined sales and manufacturing shipments totaled $1.27 Trillion in December 2012, up 0.3% from Manufacturing & Trade Sales November and up 3.6% from the previous year. (Source: US Census) Total value of inventory on hand is estimated at $1.62 Trillion in December 2012, up 0.1% from November Manufacturing & Trade Inventory and up 5.1% from December 2011. (Source: US Census) In December, housing starts rose 12.1% to an annual rate of 954,000 units. December’s pace of residential groundbreaking was the fastest since June 2008. An estimated 780,000 housing units were started in 2012; a Housing Starts 28.1% increase over housing starts in 2011. Building permits (an indicator of future housing starts) rose 0.3% to an annual rate of 903,000. (Source: U.S. DOC) The consumer price index for all urban consumers decreased 0.3% in November from the previous month. Over the last 12 months, the all items index increased 1.8%. The producer price index for finished goods Consumer & Producer Price Index decreased 0.2% in December from the previous month. Prices for finished goods rose 1.3% over the previous year. (Source: US Bureau of Labor Statistics) To sign-up to receive these free monthly snapshots, visit: www.GeorgiaLogistics.com For more information about the Logistics Market Snapshot or the many other resources and activities of the Georgia Center of Innovation for Logistics please contact: Page Siplon, Executive Director – psiplon@georgia.org – 912.966.7867 4