2. TABLE OF CONTENTS
Executive Summary 1
Academic R&D The Value of Academic Research in Wisconsin 3
What Is a Research University or Institution? 5
The Bayh-Dole Act and Expansion of Economic R&D 8
Measuring the Economic Impact of Academic R&D 10
How Does Wisconsinʼs Academic R&D Compare to Other States? 18
What Are Other States Doing to Support Technology and Academic R&D? 22
Public Support for the UW System Compared to Other States 25
Conclusions and Recommendations 26
State-by-State Overview 29
Stem Cell Research: A Case Study 41
What are Stem Cells and Why Are They Important? 42
Pros and Cons of Human Embryonic Stem Cell Research 44
What is the Extent of Stem Cell Research in Wisconsin? 46
Whatʼs Happening in Other States and Nations? 48
Summary 50
2
3. EXECUTIVE SUMMARY
Without a vibrant foundation in academic research UW-Madison is growing in terms of the number
and development, Wisconsin will find it difficult, if of students, and when demand for access to the
not impossible, to grow a high-tech, “knowledge- university remains high.
based” economy in the 21st century. Thanks to
decades of investment in people and facilities, It is also happening at a time when Wisconsin
Wisconsin has a strong base for academic R&D is striving to produce globally competitive goods
today. However, there are forces at work that could and services, and to attract and retain knowledge-
quickly erode Wisconsinʼs academic research based workers.
advantage – and threaten the stateʼs ability to pro-
duce high-wage, private-sector jobs. If the slide in higher education funding effort con-
tinues, the academic R&D infrastructure in Wis-
Prominent among those corrosive forces is the consin could deteriorate – and that would mean
25-year trend toward weaker public support for less ability to compete for merit-based federal
higher education in Wisconsin. The stateʼs higher research grants. Such grants typically go to states
education “effort,” as measured by per capita with state-of-the-art laboratories, well-compen-
public spending, has declined faster than the U.S. sated researchers and a healthy environment for
average and more sharply than all but one of the scientific research.
eight Big Ten Conference states.
In this study, the Wisconsin Technology Council
Wisconsin has reduced its higher education effort has examined the extent of academic R&D in
by 47.8 percent since 1978. That is 40th among Wisconsin, how much is being spent on such re-
the 50 states – with 50th representing the weak- search, the sources of the funds, and the effect of
est effort. That state is Colorado, which passed academic R&D spending on the general economy.
a Taxpayer Bill of Rights amendment to its state Some highlights:
constitution.
n Academic and other research institutions in
The decline in public support is chipping away at Wisconsin spent about $883 million on direct
the infrastructure that supports academic research research activities in the latest fiscal year for which
in Wisconsin. For example, the UW-Madison is complete records are available. That spending
now experiencing actual reductions in the number translated to 31,788 jobs, using generally accept-
of faculty, academic staff, course sections, group ed multiplier estimates of the U.S. Department of
instruction sections, lecture sections and labora- Commerce, Bureau of Economic Analysis (36 jobs
tory sessions. This is happening at a time when the for every $1 million in R&D spending).
1
4. n If the jobs created by academic research spend- n Wisconsin fell just outside the top 20 states (22nd
ing in Wisconsin were reported as a separate overall) with total R&D expenditures of $2.7 billion.
category within the labor market statistics of the This was primarily because Wisconsin lags the
state Department of Workforce Development, it nation in state-based and industrial R&D (40th per
would represent a significant sector in its own right. capita). If not for Wisconsinʼs relatively high ranking
For example, paper manufacturing employs 39,100 in academic R&D, the state would slip out of the
people in Wisconsin, printing 34,700, plastics and top half of all U.S. states in overall research and
rubber products 34,600, and construction of build- development spending. It is important to note that
ings 31,600. the nationʼs fastest-growing states also rank among
the highest in overall R&D spending.
n Wisconsin ranks 15th among the 50 states
with total academic R&D spending of $805.8 The study recommends that the governor and Leg-
million from federal, state and private sources, islature continue to invest in capital improvement
according to the State Science and Technology programs such as BioStar and HealthStar, which
Institute (SSTI). Those figures include $696.1 mil- leverage the assets of the UW-Madison and help to
lion in R&D spending by all UW System campuses create spinout companies and jobs. The study also
in the 2002 fiscal year. Most of the UW-related R&D calls for reversing the long slide in public support
spending ($662.1 million) took place on the UW- for the UW System, beginning in the 2005-2007
Madison campus. The stateʼs per capita spending state budget bill.
on academic R&D was $148.14, or well above the
U.S. average of $126.17. The study also urges that the UW-Madison, the
Medical College of Wisconsin and the Marshfield
n The $805.8 million total also includes $109 million Clinic re-examine an already strong collaborative
in research spending by private institutions, such as research relationship to look for more opportuni-
the Medical College of Wisconsin, the Milwaukee ties to jointly attract research funding and conduct
School of Engineering and Marquette University. science. Incentives to conduct inter-institution and
interdisciplinary research should be established.
n The SSTI figures do not include research spend- This is similar to an approach being followed in
ing by the private Marshfield Clinic Research Foun- Minnesota, where the University of Minnesota and
dation (about $75 million) or the research budgets the Mayo Clinic are working more closely together.
of the two Veterans Administration hospitals in
Wisconsin ($2.5 million). Those budgets deserve The study also urges the governor and the Leg-
including in the state total of $883 million, however, islature to establish a commission, similar to the
because research at those institutions is conducted Michigan Commission on Higher Education and
in close association with other institutions and/or Economic Growth, to explore other options and to
private industry. more deliberately track “best practices” in
other states.
2
5. ACADEMIC R&D THE VALUE OF ACADEMIC
RESEARCH IN WISCONSIN
Academic research institutions in Wisconsin spent percent of the stateʼs total workforce. Put another
$883 million on direct research activities in the way, academic research accounted for more jobs
fiscal year ending June 30, 2002, according to the than existed in total in Columbia County (28,128),
latest reported figures. That spending translated to the city of La Crosse (28,718) or the city of She-
31,788 jobs, using generally accepted estimates boygan (27,913) in July 2004. Moreover, jobs cre-
of the U.S. Department of Commerce, Bureau of ated through academic research pay substantially
Economic Analysis (36 jobs for every $1 million in more, on average, than the Wisconsin per capita
R&D spending). wage of $30,898 per year.
If the jobs created by academic research spending In an age when innovation is king and “knowledge-
in Wisconsin were reported as a separate cat- based” solutions are being pursued for Wiscon-
egory within the labor market statistics of the state sinʼs economic growth, it is essential that support
Department of Workforce Development, it would for research and development conducted through
represent a significant sector in its own right. By various Wisconsin research institutions remain
way of comparison, paper manufacturing employs high.
39,100 people in Wisconsin, printing 34,700, plas-
tics and rubber products 34,600, construction of Universities and other research institutions with an
buildings 31,600; the federal government 29,400; academic bent are the engines of discovery and
real estate and rentals 28,700, and wood product innovation in science and engineering, thus fueling
manufacturing 25,800. advances in agriculture, manufacturing, services
and other sectors of the economy. The return
Within a total non-farm workforce of 2,798,300 on investment in academic research is high; the
(average monthly 2004), Wisconsinʼs academic return on disinvestment could undermine
research sector represents a little more than 1 Wisconsinʼs competitiveness.
3
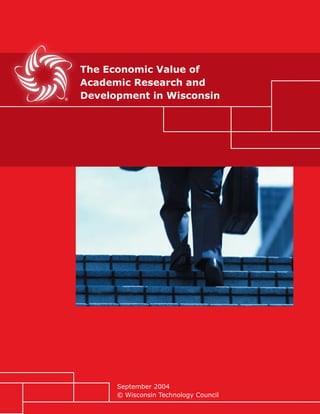
6. Academic research accounted for more jobs than
existed in total in Columbia County (28,128), the
city of La Crosse (28,718) or the city of Sheboygan
(27,913) in July 2004.
Academic R&D jobs compared to other employment sectors*
in 1000ʼs of people
40
39,100
35
34,700 34,600
30 31,788 31,600
29,400
28,700
25
25,800
20
15
10
5
0
Paper Printing Plastic and R&D Jobs Construction Federal Real Estate Wood Product
Manufacturing Rubber Products of Buildings Government and Rentals Manufacturing
*Estimates based on U.S. Commerce Department multiplier of 36 jobs created for every $1 million in academic R&D spending.
4
7. WHAT IS A RESEARCH UNIVERSITY
OR INSTITUTION?
In essence, a research institution emphasizes as the Association of American Universities in 1900.
its primary mission the conduct of research, the Today, only 60 research universities qualify for
training of graduate students in how to conduct membership in that organization.
research, and, over the past 25 years, the trans-
fer of knowledge acquired through research to The United States has long enjoyed the tradition
the marketplace. of great public universities offering professional
and classical education. But the concept of also
The idea of a research university was born in offering agricultural and technical education is
Germany in places such as the University of somewhat newer. In 1863, President Lincoln
Gottingen (founded in 1737) and the University of signed the Morrill Act creating a land grant sys-
Berlin (established in 1810). In the United States, tem of universities to provide practical education
universities began to fulfill that vital research and in agriculture and engineering. The Hatch Act of
development function in the late 1800s. The idea 1887 established a network of federally funded
spread from Johns Hopkins University (which be- agricultural experiment stations. Passage of the
gan in 1876) and Clark University (in 1890), and Smith-Lever Act in 1914 created the Cooperative
then to Stanford University (in 1891) and the Uni- Extension Service to work in partnership with uni-
versity of Chicago (in 1892). Research has been versities. The “Extension,” as it became known in
conducted on the University of Wisconsin-Madi- Wisconsin and elsewhere, transferred knowledge
son campus since the late 1800s. The University from the laboratories of the university to the farm
of Wisconsin was one of 14 founding members of fields of America.
5
8. “... innovation is king and “knowledge-
based” solutions are being pursued for
Wisconsinʼs economic growth ...”
- Wisconsin Technology Council
6
9. Today, about 250 U.S. universities consider them- to inventions made during federally sponsored
selves research universities, although the leading research. Before 1980, fewer than 250 patents
100 research institutions account for about 70 were issued each year to universities. In 2002, that
percent of the research space and 80 percent of number had swelled to 3,673 patents issued to
total research expenditures. The top 20 research 219 reporting institutions, according to the Asso-
universities – a category that includes the UW- ciation of University Technology Managers. In the
Madison – accounts for about one-third of total same year, those universities filed 7,741 patents
academic research expenditures in the United and reported 15,573 invention disclosures.
States.
n The rise of biotechnology R&D and, more gen-
About 660 U.S. academic institutions perform erally, of research in the life sciences, since the
basic and applied research and development, and early 1980s also boosted the number of research
that number is increasing. There are good rea- universities with offices of technology licensing.
sons for the phenomenon. Today, at least 70 percent of all license income
earned by universities comes from the life sci-
In our knowledge-based society, universities have ences, with the remainder mainly from the physi-
a growing role to play in creating, nurturing and cal sciences, including engineering. In Wisconsin,
deploying intellectual capital. The term “university research involving human embryonic stem cells
technology transfer” applies to the commercializa- provides an interesting case study. (Please see
tion of university discoveries and innovations. In page 41 in this report.)
the past quarter-century, such transfer has taken
on increasing importance to the U.S. and n State governments have joined the federal gov-
Wisconsin economies. ernment and private industry in supporting R&D,
increasingly providing financial support that can be
Three factors have contributed to the recent rise used for capital investments, hiring “star” faculty,
of university tech transfer activity: or engaging in partnerships with private institutions
n The enactment of the federal Bayh-Dole Act that might otherwise not be possible.
in 1980 gave universities the right to claim title
7
10. THE BAYH-DOLE ACT AND THE EXPANSION
OF ACADEMIC R&D
Federal government agencies provided more However, as the AAU was quick to add in its June
than $21.8 billion in FY 2001 to university and 2003 report, “new products and processes do not
other academic researchers to conduct scientific spring fully formed from the basic research per-
research, according to figures from the State Sci- formed at universities.” Patents, licenses, devel-
ence and Technology Institute. The Association of opment, capital, marketing and manufacturing
University Technology Managers put that figure at capacity are all required. Collectively, thatʼs called
more than $22.2 billion in FY 2002. That continu- technology transfer.
ing investment expands human knowledge and
helps educate the next generation of science and Under federal law, as provided by the Bayh-Dole
technology leaders, a process that is essential to Act of 1980, non-profit organizations – including
the long-term economic and physical security of universities – may patent and retain title to inven-
the United States. New discoveries from university tions created from research funding by the govern-
research also form the basis for many new prod- ment. In general, the university must disclose each
ucts and processes that benefit the nation and its new invention to the federal funding agency within
citizens. In fact, studies surveyed by the Associa- two months of the inventor disclosing it to the uni-
tion of American Universities (AAU) showed that versity, decide whether or not to retain title to the
technological innovation and the scientific research invention, and then file a patent application within
on which it is based are responsible for more than one year of electing to seek title.
half of the nationʼs productivity growth in the past
50 years.
8
11. Universities must license the rights to innovations In the 1960s and 70s, the pace of innovation
to industry for commercial development; small was slow. Very little federally funded research
businesses receive preference. The federal gov- was leading to commercial applications, mainly
ernment also receives a non-exclusive, irrevo- because there were no incentives for universities
cable license to the invention. Universities must or researchers to find partners to do so. Mainly,
share with the inventor any income eventually de- there were penalties. Tight restrictions on licens-
rived from the patent. Any remaining income, after ing, varying patenting policies among federal
technology management expenses, must support agencies, and the lack of exclusive manufacturing
scientific research or education. A principal value rights for government-owned patents made most
of having universities retain control of patent rights companies shy away. By 1980, only 5 percent of
is that it ensures that research findings remain government-owned patents resulted in new or
available for further use in the classroom and improved products.
laboratory.
Bayh-Dole was passed to break the logjam. With
Why does the government allow universities or the help of policies and procedures pioneered
their patent and license agencies to keep control by the Wisconsin Alumni Research Foundation
of government-funded inventions? Doing so gives (WARF), the act created a uniform government
people and companies incentives to commercial- patent policy and allowed universities and other
ize technology, which sparks innovation and yields non-profit organizations (such as WARF) to
other benefits for society. maintain title to federally-funded inventions and to
work with companies on bringing them to market.
A cycle of research, tech transfer and profit –
which enabled additional investment in research
– was created.
9
12. MEASURING THE ECONOMIC IMPACT
OF ACADEMIC R&D
Spurred on by Bayh-Dole and other trends, aca- universities in receiving patents (84 for the year)
demic R&D has altered the landscape of the U.S. from the U.S. Patent and Trademarks Office.
economy. But how can we measure the economic n 569 new commercial products were launched.
effects of academic R&D? n 450 new companies were established, for a total
of 4,320 since 1980 and 1,398 in the last three
Since it was launched a decade ago, the annual years. Nearly 2,750 of those start-ups since 1980
Licensing Survey of the Association of University are still operating, and many of those that have
Technology Managers (AUTM) has become a val- ceased to exist were acquired by other companies.
ued source for data on the transfer of academic re- n Running royalties on product sales were $1.005
search for commercial application. The 2003 AUTM billion, an 18.9 percent increase over FY 2001.
Licensing Survey included 222 U.S. and Canadian
respondents, the largest number ever, and showed “The conclusions of the 2002 AUTM Licensing
the following U.S.-only results for FY 2002: Survey show that the academic technology transfer
field is an integral part of the innovation economy,”
n Total sponsored research expenditures were noted Ashley Stevens, survey editor and chairman
$34.967 billion. of the AUTM Survey, Statistics and Metrics Com-
n Sponsored academic research expenditures from mittee.
federal sources totaled $22.213 billion.
n Sponsored academic research expenditures from “This persistent growth in a sluggish economy
industry sources totaled $2.715 billion. shows the vital role of academic technology trans-
n Sponsored academic research expenditures from fer in fostering the development of new products
all other sources, including foundations and state that improve our quality of life, providing new
governments, totaled $10.039 billion. streams of income to further academic research
and education, and creating new jobs,” added
The following reported figures included U.S. and AUTM President Patricia Harsche Weeks.
Canadian universities and research institutions:
An unanswered question from the 2002 AUTM
n 15,573 invention disclosures were reported, up Licensing Survey is how many jobs are created
14.8 percent over FY 2001. by academic research. In 1998, AUTM estimated
n 7,741 patent applications were filed, up 13.6 $33.5 billion in economic activity and 280,000
percent of FY 2001. directly supported jobs. In 1999, AUTM pegged
n 3,673 patents were issued, down 1.3 percent economic activity at $40 billion and directly sup-
from FY 2001. In calendar year 2003, the ported jobs at 270,000. The creation of indirect jobs
University of Wisconsin ranked sixth among all U.S was not calculated by AUTM.
10
13. In 2000, a study by the Association of American However, AAU continued, it is possible to “achieve
Universities (AAU) concluded that academic a rough, conservative approximation of the im-
R&D expenditures by doctorate-granting institu- mediate employment impacts of academic R&D”
tions created about 1.08 million jobs in the United by using multipliers developed by the U.S. Com-
States, directly and indirectly. Using a rule of merce Departmentʼs Bureau of Economic Analysis.
thumb for Wisconsinʼs share (2 percent) of the This multiplier is (36 jobs for every $1 million in
total national employment, that would indicate a academic R&D spending) is frequently used in the
minimum of 21,600 jobs in Wisconsin. But the rule development of studies of the economic impacts of
of thumb doesnʼt work in this example because individual universities and colleges.
of Wisconsinʼs above-average performance in
academic R&D spending. The AAUʼs estimate of 1.08 million jobs created in
2000 came from the following breakdown, which
Here is an excerpt from the AAU report: “The AAU examined various sources of funding for academic
is often asked about the number of jobs supported R&D:
by academic R&D funding in the United States. n National Institutes of Health extramural grants
There is no definitive answer to this question (total $10.785 billion) 384,123 jobs
because it has never been addressed in any pub- n National Science Foundation academic R&D
lished studies. Furthermore, academic R&D is not, grants (total $2.824 billion) 102,601 jobs
and has never been, intended or presented as n Department of Defense academic research
a jobs-creating mechanism. In the last analysis, grants (total $2.007 billion) 72,047 jobs
academic R&D makes a much more vital contri- n NASA academic R&D grants (total $1.016 bil-
bution to the nationʼs well-being-economic and lion) 37,904 jobs
otherwise-by advancing the frontiers of knowl- n Department of Energy academic R&D grants
edge, by finding new cures and treatments for (total $696.2 million) 25,230 jobs
diseases, by helping to develop new technologies, n All federal R&D grants to universities and col-
and by training future generations of researchers leges (total $19.879 billion) 717,243 jobs
and teachers.” n All other R&D expenditures by doctorate-grant-
ing institutions (these institutions account for
virtually all academic R&D; total $29.597 billion
includes R&D supported by nonfederal sources)
458,095 jobs
11
14. Top Ten U.S. Universities Receiving Patents (2003)
500
439
250
100 139 127
96
90
85
84
80 81
70
60 63
61
59 59
50
0
*University California Massachusetts University Stanford University Johns University Columbia Cornell University
of California Institute Institute of of Texas University of Wisconsin Hopkins of Michigan University University of Florida
System of Technology Technology University
������������������������������������������������������������������������������������������������������
12
12
15. ������������������������������������������������������������������������������������������
in 1000ʼs of jobs
500
458,095
400
384,123
300
200
100 102,601
72,047
50
37,904
25,230
0
Other Federal National Institutes National Science Dept of Defense NASA Academic Dept of Energy
R&D Grants of Health Foundation Academic Academic Research R&D Grants Academic R&D
to Universities Extramural Grants R&D Grants Grants Grants
13
16. “The more skilled the workforce the better that
workforce is able to absorb, implement and
adapt ideas that come from the R&D sector.”
- Researcher Steve Dowrick
14
17. A word about methodology
The economic multiplier of 36 jobs per $1 million spent on academic R&D was developed by the Association
of American Universities using methods established 30 years ago by the U.S. Department of Commerce,
Bureau of Economic Analysis (BEA). In the 1970s, BEA developed the Regional Input-Output Modeling Sys-
tem, which was most recently updated in 1997. To learn more, go to www.bea.gov/regional/rims/brfdesc.cfm.
These jobs figures include both full- and part-time
jobs. They also include jobs supported directly on and Economics concluded that $105.2 million in
campuses and jobs supported indirectly outside external funding for R&D at the University of Ken-
campuses as institutional expenditures ripple tucky produced 4,509 jobs, contributed $274.6 mil-
through local and state economies. To put these lion to the Kentucky economy, and raised personal
jobs figures in some perspective, the Commerce income by $84.5 million. That is a ratio of 42.8 jobs
Department at the time reported the following per $1 million in R&D.
numbers of persons were directly employed in n A 2004 study by the Huron Consulting Group
the following manufacturing sectors: tires, 73,300; and the Washington Advisory Group calculated
logging, 78,220; communications equipment, that research funding at the University of North
284,500; newspaper printing and publishing, Carolina and North Carolina State University sup-
444,310; aircraft and related parts, 466,640; basic ported 22,000 jobs statewide. For every dollar the
textiles, 516,380; motor vehicles and equipment, faculty at those two schools attract in research
1,012,990. funding, $1.70 in spending occurs in North Caro-
lina.
Other available metrics worth considering: n Economists have consistently agreed that
n An economic impact study by Cleveland State the rate of return on R&D spending is high. In a
University in 1992 used an employment multiplier 2003 report for the National Bureau of Economic
of 40 external jobs created for every $1 million Research in Cambridge, Mass., researcher Steve
spent in the local economy. Dowrick surveyed existing studies and determined
n The University of Montana estimated in 1992 that U.S. and multinational rates of return (private
that 45 jobs are created for every $1 million spent and social) ranged from 10 to 63 percent, with 25
in the local economy. to 30 percent being the norm for private rates
n A 2000 study by the Gatton College of Business of return.
15
18. Dowrick noted that academic R&D is a part of the
“new growth theory” that came into prominence in Duke generated $2.6 billion in activity during the
the late 1980s and early 1990s: “The neo-classical 2002-2003 fiscal year. Using the AAU formula,
growth model, formalized three decades earlier, Dukeʼs sponsored research of $365 million
had focused on the accumulation of machinery and generated 13,140 jobs.
equipment and emphasized the feature of dimin-
ishing returns – which implied that such investment “Like other major research universities, Duke is
would not be able to drive long-run growth. The an economic engine whose activities and health
new generation of studies switched attention to the have a dramatic effect on the local economy,”
accumulation of human capital and the possibility wrote President Nannerl Keohane. “Nationally, it is
that returns to investment in education, training clear that research universities such as Duke are
and research may not suffer from diminishing re- increasingly important to the evolving economy. In-
turns… The most extensively documented feature creasingly, industries and firms that are successful
of embodied human capital is the relationship competitors here and abroad for business and jobs
between education and wages. Studies of earnings are knowledge-based, high-tech, and engaged in
in advanced capitalist economies typically find that cutting-edge research.”
each extra year of schooling raises earnings by 5
to 10 percent.” In a paper prepared for the 2002 Wisconsin Eco-
nomic Summit, William R. Rayburn, dean of the
The more skilled the workforce, Dowrick continued, graduate school at UW-Milwaukee, summarized
the better that workforce is able to absorb, imple- the value of academic R&D in this way: “University
ment and adapt ideas that come from the R&D and industry relationships benefit both parties.
sector. Universities receive support for research, improve-
ments in facilities, and learning opportunities for
“The driving force of economic growth is invest- students. Companies receive useful research
ment in human capital – skills and ideas – rather results that advance their research and develop-
than investment in machines and buildings,” he ment objectives. The commercialization of univer-
wrote. sity technologies derived from federal and industry
sponsorship of research serves the public interest.
More often that not, the engines behind those To be most effective, Wisconsinʼs academic institu-
driving forces are located on the campuses of tions need policies, practices and infrastructure
academic R&D centers. In 2003, when Duke that promote an entrepreneurial environment…”
University examined its economic impact on the
Durham, N.C., region, the conclusion was that
16
19. “The driving force of economic growth
is investment in human capital – skills
and ideas – rather than investment in
machines and buildings.”
- Researcher Steve Dowrick
17
20. HOW DOES WISCONSINʼS ACADEMIC
R&D COMPARE TO OTHER STATES?
If not for Wisconsinʼs relatively high ranking in from federal, state and private sources, accord-
academic R&D, the state would slip out of the top ing to the State Science and Technology Institute
half of all U.S. states in overall research and de- (SSTI). Those figures include $696.1 million in
velopment spending. It is vital that academic R&D R&D spending by all UW System campuses in
in Wisconsin continue to be supported, or the state the 2002 fiscal year. Most of the UW-related R&D
risks becoming an “also-ran” in the 21st century, spending ($662.1 million) took place on the UW-
knowledge-based economy. Madison campus. The stateʼs per capita spending
on academic R&D was $148.14, or well above the
Research and development expenditures by U.S average of $126.17.
industry, government sources, foundations and
academic institutions vary widely by state. The 10 Those figures include $696.1 in R&D spending
highest ranking states accounted for 66 percent of by UW System campuses, with the bulk of that
total U.S. R&D expenditures in 2000. Those states spending ($662.1 million) taking place at UW-
were: California, Michigan, New York, New Jersey, Madison. UW-Milwaukee spent $24.9 million on
Massachusetts, Illinois, Texas, Washington, Penn- research.
sylvania and Maryland. The top 20 states account-
ed for 87 percent of the U.S. total of $247 billion; The $805.8 million total also includes $109 million
California alone accounted for more than one-fifth in research spending by private institutions, such
of the total at $55 billion. The bottom 20 states ac- as Marquette University, the Medical College of
counted for just 4 percent of all R&D spending. Wisconsin and the Milwaukee School of Engineer-
ing. The private school figures are stripped of
Wisconsin fell just outside the top 20 states (22nd dollars spent in research collaborations with other
overall) with total R&D expenditures of $2.7 billion. institutions.
This was primarily because Wisconsin lags the
nation in state-based and industrial R&D (40th The SSTI figures do not include research spend-
per capita). If not for Wisconsinʼs relatively high ing by the private Marshfield Clinic Research
ranking in academic R&D, the state would slip out Foundation (about $75 million) or the research
of the top half of all U.S. states in overall research budgets of the two Veterans Administration hos-
and development spending. It is important to note pitals in Wisconsin ($2.5 million). Those budgets
that the nationʼs fastest-growing states also rank deserve including in the state total, however, be-
among the highest in overall R&D spending. cause research at those institutions is conducted
Wisconsin ranks 15th among the 50 states with in close association with other institutions and/or
total academic R&D spending of $805.8 million private industry.
18
21. The SSTI breakdown of the funding sources for Wisconsinʼs intensity level was 1.55 percent
Wisconsinʼs academic R&D revealed the state – good for only 29th on the 50-state list, according
ranked 19th in federal funding, 20th in state and to the Alliance for Science and Technology Re-
local funding, and 40th in industrial support. search in America. It was also well below the U.S.
Wisconsin cannot compete with a California in average of 2.69 percent.
size or economic might – or even a Pennsylvania,
some might argue. Is there a way to measure Wisconsinʼs relatively weak R&D effort is important
Wisconsinʼs total R&D effort that might reflect the because of the correlation between the intensity
intensity of the stateʼs effort? of a stateʼs effort and its economic growth. Ac-
cording to the U.S. Bureau of Economic Analysis,
Yes. One way of controlling for the size of each real gross state product for the nation grew at an
stateʼs economy is to measure each stateʼs R&D annual rate of 4.5 percent from 1999 to 2000. Six
level as a percentage of its gross state product. of the 10 states with the fastest growth in real GSP
That percentage is referred to as R&D intensity or from 1999 to 2000 also rank among the top 10
concentration. in either total R&D performance (California, New
York, Massachusetts, and New Jersey) or R&D
Overall, the nationʼs ratio of total R&D to gross do- intensity (Massachusetts, Rhode Island, California,
mestic product was 2.69 percent in 2000. The top and Idaho) for 2000.
10 rankings for state R&D intensity in 2000 were,
in descending order, Michigan (5.81 percent), New If not for academic R&D in Wisconsin and the
Mexico, Washington, Maryland, Massachusetts, ability of academic institutions to attract federal
Delaware, Rhode Island, California, Idaho, and research dollars for that purpose, the state would
the District of Columbia (3.87 percent). Each of find itself in the bottom half of the states in an
the 10 states with the highest R&D intensity levels important “New Economy” indicator. And yet, state
in 2000 was also among the top 10 states in R&D support for academic R&D has been threatened
intensity in 1998 and 1999. by budget cuts affecting the University of Wiscon-
sin System. These budget cuts have taken place
at a time when most states are investing more in
academic R&D and their overall infrastructure for
technology development.
19
22. Sources of Academic R&D Spending in Wisconsin
in millions of dollars
$700
$650 662,100,000
$600
$550
$500
$450
$400
$350
$300
$250
$200
$150
$100 109,000,000
75,000,000
$50
34,000,000
$0 2,500,000
UW-Madison Remaining Private Colleges Marshfield Clinic Veterans
UW System and Institutions Administration
Hospitals
Total: $882.6 million. Note: Private colleges and institution estimates may be low due
to efforts to eliminate double-counting
20
20
23. Ten states account for two-thirds of all R&D spending in the United States
Remaining 39 States TOP 10 STATES
California
Michigan
New York
New Jersey
Massachusetts
Illinois
Texas
Washington
Pennsylvania
Maryland
Wisconsin
1.1%
21
21
24. WHAT ARE OTHER STATES DOING TO SUPPORT
TECHNOLOGY AND ACADEMIC R&D?
The pivotal role of state governments in expand- development initiatives available to assist biosci-
ing regional economic growth through science and ence companies. State investments have grown
technology development is a widely recognized, and the variety of approaches used to stimulate
albeit relatively recent, phenomenon. Practically growth of the bioscience sectors have increased
all states have established lead science and significantly.
technology offices, most of whose existence can n More than 885,000 people in the U.S. are em-
be traced back only to the mid- to late-1980s. The ployed in the biosciences. The largest segment
independent, non-profit Wisconsin Technology of this group is working in the areas of medical
Council is the lead agency for Wisconsin, and was devices and equipment, which accounts for 37
created by an act of the Legislature in 1999. percent of bioscience employment.
n In 2003, bioscience workers on average were
During the 1990s, states increasingly included paid at least $26,600 more than the overall na-
a science and technology component in their tional average private sector annual wage.
economic development plans. Between 1991 and
1995, no fewer than 13 states adopted statewide Overall, state efforts tend to focus on the creation
S&T strategic plans of varying levels of sophis- of high technology firms and the use of advanced
tication and complexity; that number climbed to technologies in the traditional manufacturing and
40 by 2003. A review of State of State speeches, service sectors. Common to these plans is the
inaugural addresses and budget messages that acknowledged importance of:
were delivered by most governors in the early part n Maintaining and strengthening the research and
of 2004 indicates a continuing high level of inter- development (R&D) capacity of the statesʼ col-
est in science- and technology-based economic leges and universities;
development. n Encouraging “home grown” businesses by pro-
viding support to entrepreneurs and small tech-
At the 2004 international conference of the Bio- nology-based firms rather than seeking to recruit
technology Industry Organization, a report by the technology firms to locate within the state; and
Batelle Memorial Institute showed: n Facilitating the incorporation of new technology
n Forty states specifically target the biosciences into processes and products.
for development and all 50 states have economic
22
25. States have become particularly adept at leverag- between industry, non-profit organizations, local
ing funds and fostering university-industry part- governments, and individual performers.
nerships. In 1998, the Battelle Memorial Institute
and the State Science and Technology Institute Organizations such as the National Governors As-
surveyed more than 1,000 state agencies and sociation have adopted strategies that encourage
universities and learned that states spent $3.009 states to invest in science and technology, with
billion on R&D activities and supporting facilities academic R&D being a cornerstone. In the NGAʼs
in 1995. These totals include (1) expenditures for annual meeting in 2003, the governors resolved:
R&D performed by or in support of state govern- “Fundamental research and technological innova-
ment agencies regardless of sources of funds, and tion provides the means for long-term economic
(2) R&D funding provided by state governments to growth, for a better standard of living and quality of
external parties, including most notably direct R&D life for all citizens, and for all branches and levels
appropriations to academic institutions through of government to better serve their citizens by
state budget processes. reducing costs and enhancing service quality. As
both investors in and users of science and technol-
State government sources (including general ogy, states have a critical role in creating an envi-
revenue funds, lottery proceeds, revenue bonds, ronment that promotes and supports research and
and specially designated tax funds) accounted for technology. Such an environment fosters economic
87.4 percent ($2.431 billion) of total state spending development, commercialization, and innovation.”
on R&D activities in 1995. Federal dollars passing
through state agencies accounted for 9.3 percent The governors specifically recognized the role of
($0.258 billion) of the state-directed R&D total, federal research, the Bayh-Dole Act, and the lever-
and leveraged funding from industry and other aging power of state investments:
non-government sources for 3.3 percent ($0.092 “Federal funding for basic research has significant
billion). Academic institutions performed 73.2 implications for federal-state relations. The federal
percent ($2.036 billion) of all state government government has become the principal source of
R&D spending reported in this survey. State agen- funding for basic and applied research in fields
cies performed 14.7 percent ($0.408 billion) of the such as health and life sciences, defense tech-
R&D total, and the rest ($0.336 billion) was split nologies, homeland security, energy conservation
23
26. and alternative fuels development, environmental by Promoting University-Industry Tech Transfer,”
protection, space exploration, land management, Tornatzky emphasized the importance of state
and education. The governors support continued support for academic research and development:
federal investments in such research and develop-
ment. “University-industry tech transfer – formal and
informal – is important in building high-skills,
“States also have played an important role in high-wage economies. Technology drives the new
research and development initiatives, particularly economy, and universities provide critical feed-
through their research universities. Governors stock in terms of talented people, new knowledge
strongly support a stateʼs right under the U.S. and innovative technology. For states, universities
Constitution to the protections of sovereign im- can be major assets in economic development…”
munity and oppose any effort to threaten that right
with a loss of the protections of federal intellectual Specifically, he urged governors to encourage uni-
property laws to any entity of the state, including versity-industry technology partnerships; to invest
their research universities. in entrepreneurial mechanisms, such as business
incubators tied to university campuses; to remove
“Governors also recognize the key role played by legal barriers to university-industry technology
the passage of the Bayh-Dole Act in improving the transfer; to underwrite capital improvements to
transfer of discoveries and technologies supported keep laboratories and other facilities competitive;
with federal funding from university laboratories to and to champion the role of research universities
commercial applications, and support its continu- in speeches and other public communications.
ation.”
Of late, however, governors across the United
In a 2000 report to the NGA, Dr. Louis D. Tor- States have found it more difficult to support
natzky of the Batelle Memorial Institute concluded research universities – and higher education in
that states can directly influence the growth of new general – because of declining revenues and cor-
economy research and development within their responding budget cuts. What follows is a review
borders. In his report, “Building State Economies of how Wisconsin has fared in that environment.
24
27. PUBLIC SUPPORT FOR THE UW SYSTEM
COMPARED TO OTHER STATES
At a time when states face budget troubles, analysts Wisconsin has reduced its higher education
are closely monitoring the debates and decisions spending effort by 47.6 percent since 1978, ac-
about spending for higher education occurring in cording to Grapevine. That is 40th among the 50
state capitals across the country – including Madi- states (with 50th representing the weakest effort
son. In early 2004, The Chronicle of Higher Edu- by Colorado) and seventh lowest of the eight Big
cation reported that aggregate appropriations for Ten Conference states. Those states are Iowa, Il-
higher education in the United States fell for the first linois, Indiana, Ohio, Michigan, Minnesota, Penn-
time in 11 years. sylvania and Wisconsin.
For fiscal year 2004, states appropriated $60.3 bil- Wisconsin is 27th nationally in appropriations of
lion for the operations of higher education in their state tax funds for operating expenses of higher
states, according to Grapevine, a respected statisti- education per $1,000 of personal income, or fifth
cal tracking project at Illinois State University. This lowest among the eight Big Ten states.
was down from $61.5 billion in fiscal 2004, and down
further from $62.8 billion in fiscal 2002. In 44 years Wisconsin is 36th nationally in the change in state
of reported data, this was the first time year-to-year tax fund appropriations per $1,000 of state per-
state tax fund appropriations for higher education sonal income between fiscal 2001 and fiscal 2004,
declined two years in a row. and sixth among the eight Big Ten states.
The Grapevine has also tracked state-by-state high- Based on the current trends, Wisconsin would stop
er education spending as a function of per capita spending state dollars on higher education in the
income and $1,000 of personal income. Almost all year 2040, which is the 16th fastest rate among
states show a diminished spending “effort” since the 50 states.
1978. But a few states stand out – Wisconsin among
them. In 1995, according to the Midwestern Higher
Education Compact, Wisconsin ranked 3rd highest
One state, Colorado, has reduced its state invest- among 12 Midwestern states in total funding for
ment effort in higher education by more than two- higher education. By 2002, it had fallen to sixth.
thirds since 1978 (67.5 percent) due to a spending
limit called the Taxpayer Bill of Rights. Seven states Between 1994 and 2004, Wisconsin ranked 46th
have joined the “50-percent off” club by reducing out of 50 states in the percentage change in state
their higher education effort by more than half: Ari- tax-funded spending on higher education. That
zona, South Carolina, Washington, Oregon, Mas- was the lowest ranking among the eight Big Ten
sachusetts and New Hampshire. Four more states states.
are poised to join the club: Minnesota, Rhode Island,
Vermont and Wisconsin.
25
28. CONCLUSIONS AND RECOMMENDATIONS
The evidence is mounting that the UW System n The number of lecture sections taught in under-
and UW-Madison, in particular, are providing less graduate courses declined from 2,525 in fall 2002
access to higher education at a time when there to 2,448 in fall 2003. This was a decline of 3.1
is more demand. Reductions in state support in percent. As a consequence, the average size of
2003-2004 had the following effects in the aca- undergraduate lecture sections increased by 1.6
demic year that began in the fall of 2004. percent.
n The number of faculty funded from the general n The number of laboratory sections taught in
purpose revenues/fees instructional budget de- undergraduate courses declined from 1,389 in fall
clined from 1,368 FTE in 2002-03 to 1,342 FTE in 2002 to 1,319 in fall 2003. This was a decline of
2003-04. This was a decline of 1.9 percent. 5.0 percent. As a consequence, the average size
of undergraduate laboratory sections increased by
n The number of non tenure-track academic staff 2.6 percent.
funded from the GPR/Fees instructional budget
declined from 892 FTE in fall 2002 to 843 FTE in As a point of context, this decline took place at a
fall 2003, a decline of 5.4 percent. time when the number of full-time equivalent
students at the UW-Madison increased by
n The total number of course sections taught one-half of 1 percent.
declined from 12,102 in fall 2002 to 11,922 in fall
2003. This was a decline of 1.5 percent. When overall state support for higher education
declines, so does state support for academic
n The total number of group instruction sections research and development as a segment of that
(lecture, laboratory, discussion and field) declined budget. If the slide in higher education funding
from 7,831 in fall 2002 to 7,683 in fall 2003. This effort continues, the academic R&D infrastructure
was a decline of 1.9 percent. in Wisconsin could deteriorate – and that would
mean less ability to compete for merit-based fed-
eral research grants. Such grants typically go to
states with state-of-the-art laboratories, well-com-
pensated researchers and a healthy environment
for scientific research.
26
29. Specific recommendations:
n The governor and Legislature should continue n The UW-Madison, the Medical College of Wis-
to invest in capital improvement programs such as consin and the Marshfield Clinic should re-examine
BioStar and HealthStar, which leverage the as- and already strong collaborative research relation-
sets of the UW-Madison and help to create spinout ship to look for more opportunities to jointly attract
companies and jobs. Of particular interest is the research funding and conduct science. Incentives
Interdisciplinary Research Center at the UW- to conduct inter-institution and interdisciplinary re-
Madison Medical School, which will require public search should be established. This is similar to an
support in order to attract private donations. As has approach being followed in Minnesota, where the
been demonstrated nationwide, state support for University of Minnesota and the Mayo Clinic have
capital improvements makes it possible to attract recently announced joint initiatives.
federal, industry and private foundation dollars for
research. General obligation bonding should be n The governor and the Legislature should estab-
considered as a funding source, given the long- lish a commission, similar to the Michigan Commis-
term return on the investment. sion on Higher Education and Economic Growth,
to explore other options and to more deliberately
n The governor and Legislature should begin, in track “best practices” in other states.
the 2005-2007 state budget, the process of re-
storing state support for UW System operations. Wisconsin has invested heavily over nearly 100
Although many states have experienced similar years in its academic research and development
budget difficulties, the erosion in the UW budget infrastructure. In the UW-Madison alone, the state
has been relatively steady for years and cannot has an asset that most states can only covet. For
continue if the state wants to protect its investment. far less money than some states are belatedly
investing in academic research and development,
n The governor and Legislature should create a Wisconsin state government can protect its historic
Wisconsin Innovation and Research Fund to help public investment and reap the benefits associated
secure federal and corporate grants by providing with the transformation to a high-tech economy.
small matching grants to UW system and private
college faculty who collaborate with business on
R&D.
27
30. “If the slide in higher education
funding effort continues, the
academic R&D infrastructure in
Wisconsin could deteriorate.”
- Wisconsin Technology Council
28
31. STATE-BY-STATE OVERVIEW
Here are examples of what selected states are doing to foster job growth and technology development
through academic research initiatives and related investments in higher education.
Illinois
Academic research per capita ranking (fiscal be expected to invest in Illinois firms, but will not
2001): 27 out of 51 be required to. It is understood by venture firms
State spending on higher education per $1,000 of that theyʼll be expected to invest in the state, and
personal income (2004): 33rd of 50 their prior investments to the state may help their
chances of receiving the money. The $50 million
State efforts to bolster academic R&D in Illinois invested to the Technology Development Fund will
have included funding for a post-genomics institute probably be invested in four or five venture funds.
at the University of Illinois, a new chemical sci- There is a rule that no more than 10 percent of a
ences building at UIʼs Chicago campus, a cancer fun can be constituted by this state money.
research center at Southern Illinois University in
Springfield, and a new facility for the treatment An additional $17 million in state funds is pro-
of juvenile diabetes at the University of Chicago. posed to leverage $126 million in federal money
Also, there is continued support for a new biomedi- over the next five years to complete the Center for
cal research building and a nanotechnology center Nanoscale Materials at Argonne National Labora-
for Northwestern University. Illinois has also tory. One of only five in the country, the facility is
established a Technology Development Fund. The expected to initially attract about $200 million in
initial amount invested will be $50 million. The cap nanoscience and nanotechnology research. In
on any investing is 1 percent of the money under addition to the Argonne National Laboratory, 26
the state treasurerʼs control and the total is $8 academic institutions in Illinois receive federal
billion. Participating venture funds must be either R&D dollars.
based in Illinois or have a significant presence in
the state. All of the funds that receive money will
29
32. Indiana
Academic research per capita ranking (fiscal capabilities in medical informatics, supporting the
2001): 33 out of 51 linkage of basic medical and clinical research in
State spending on higher education per $1,000 of Indianaʼs growing life science sector; (2) Support
personal income (2004): 20th of 50 for advances in materials science and engineer-
ing, particularly new carbon-carbon composites
Indiana is building on the stateʼs promising aca- of importance to the aerospace and automotive
demic and commercial assets to give Indiana a industries; (3) Development of new materials for
competitive edge in technology and job creation. joint implants; (4) Novel applications of engineer-
Seventeen public-private partnerships in Indiana ing concepts involve the application of non-linear
have been approved to receive a total of $22 acoustic theory to provide accurate information
million in awards from the Indiana 21st Century concerning critical blast furnace wear and erosion
Research and Technology Fund, as of August, characteristics.
2004. The fund, created by the Indiana General
Assembly in 1999, has awarded more than $132 In 2003, Kernan launched Energize Indiana, a
million in grants to 102 projects since its inception. $1.25 billion plan, to stimulate research, pro-
Gov. Joe Kernan has said he believes that provid- vide venture capital for entrepreneurs, and build
ing awards to public-private partnerships early university research facilities. The plan will not
in the development phase helps the projects get be funded by taxes, and will create high-paying
off the ground, and ultimately creates companies jobs in advanced manufacturing, life sciences,
that contribute to Indianaʼs economy. The fund 21st century logistics, high-tech distribution and
is aimed at supporting Indiana ventures focused information technology. Energize Indiana hopes
on the commercialization of advanced technolo- to create 200,000 new high-wage, high-skill jobs
gies. The fund makes awards in two categories: over the next 10 years, and enroll 200,000 addi-
Science and Technology Commercialization and tional students in higher education and credential
Centers of Excellence. Projects that have re- programs. This will help spur the stateʼs per capita
ceived funding include: (1) The creation of new income faster than the national average.
30
33. Iowa
Academic research per capita ranking (fiscal 2001): more than the stateʼs average income. The plan
7 out of 51 calls for encouragement and facilitation of biosci-
State spending on higher education per $1,000 of ence research and development, while supporting
personal income (2004): 15 of 50 the business climate and sustaining Iowaʼs firms.
Action steps ranging from developing bioscience
Iowa will continue to invest in the biosciences with educational programs to creating and funding an
a 10-year, $302 million plan, Bioscience Pathway economic development director position on the
for Development, to grow the industry and cre- Iowa Board of Regents within the first 12 months
ate new job opportunities for the state. The plan of strategy implementation.
is based on three solid aspects of Iowaʼs biosci-
ence background: (1) Strong bioscience research Bioscience Pathway for Development will be
capacity at several of the stateʼs universities; (2) funded over 10 years, with $170 million from the
Core bio-industrial competencies in sectors such sale of bonds and about $132 million from direct
as biomass conversion, traditional biotechnology, state appropriations. Each state dollar invested is
pharmaceuticals and medical devices; (3) A signifi- expected to be leveraged 5 to 1, with an estimated
cant workforce base already employed in biosci- $1.5 billion coming from federal, industry and other
ence related jobs. Iowaʼs per capita employment private sources. The total projected economic
in the bioscience industry is 24 percent higher than impact is 16,050 new bioscience jobs by the
the national average, with jobs paying $12,000 year 2015.
31
31
34. Kentucky
Academic research per capita ranking (fiscal 2001): University of Louisville and the comprehensive
42 out of 51 institutions, as well as helps universities com-
State spending on higher education per $1,000 of pete for federally funded research; (3) Kentucky
personal income (2004): 8th of 50 Science and Engineering Foundation, which
positions Kentucky researchers to secure more
Kentucky has developed a strategic plan for the new federal grants by giving them an opportunity to
economy based on the stateʼs core strengths. In investigate untested research hypotheses.
efforts to advance its innovation-based infrastruc-
ture, the New Economy strategic plan will develop Programs designed to foster product develop-
globally competitive research at Kentuckyʼs universi- ment in fledgling Kentucky technology-based
ties. Having limited R&D infrastructure, Kentucky firms are: (1) The Commercialization Fund,
will focus on five research priority focus areas, which which enables university faculty to translate their
provide the most promising opportunity for Kentucky research into marketable products. Maximum
to build centers of research excellence. grant is $225,000 over three years with a $75,000
annual limit; (2) The Rural Innovation Fund,
The following programs advance the development which enables small, rural-based Kentucky firms
of the universitiesʼ basic research capacity: (1) The to undertake research and development work.
Experimental Program to Stimulate Competitive Maximum grant is $50,000 over two years with a
Research, which builds basic research capacity in $25,000 annual limit; (3) The R&D Voucher Fund,
science and engineering with the goal of achieving which enables small and medium-sized Ken-
nationally competitive levels; (2) Bucks for Brains, tucky-based firms to undertake research and de-
which combines public monies and private donations velopment in partnership with Kentucky university
to encourage research at the University of Kentucky, researchers. Maximum grant is $200,000 over
two years with a $100,000 annual limit.
32
35. Michigan
Academic research per capita ranking (fiscal the four institutions on a competitive basis; (2) 50
2001): 25 out of 51 percent will go to a Collaborative Research and
State spending on higher education per $1,000 of Development Fund, with emphasis on testing or
personal income (2004): 26th of 50 developing emerging discoveries in partnership
with biotech firms; and, (3) 10 percent will go to a
Michigan is among the nationʼs leading states in Commercialization Development Fund to invest in
research and development intensity, meaning the start-up biotechnology-related companies in Michi-
amount of dollars invested per capita. Academic gan. The Michigan Economic Development Corpo-
R&D is only a part of that commitment, with private ration (MEDC) anticipates taking equity positions
industry leading the way. Through a series of $50 in supported new businesses. Life Sciences was
million appropriations, Michigan intends to invest one of three industries targeted in “Smart State:
$1 billion over 20 years in life sciences research, Michigan,” a report released in 1999. The other
development and commercialization. The fund- two were information technology and advanced
ing comes from Michiganʼs tobacco settlement. manufacturing.
Other public and private sources are expected to
match much of the stateʼs investment over the two Most recently in Michigan, Gov. Jennifer Granholm
decades. In 1999, then-Gov. John Engler signed announced the state cannot compete for jobs with-
a bill creating a “life sciences corridor,” an effort out more people earning college degrees. Of 6.4
to make four Michigan research institutions -- the million Michigan residents over age 25, 1.4 million
University of Michigan, Michigan State Univer- -- or about 22 percent -- have earned at least a
sity, Wayne State University, and the Van Andel bachelorʼs degree, according to Census 2000 fig-
Institute -- among the nationʼs most important for ures. That compares with 26.7 percent nationally.
biotechnology applications. Granholm would like to double the stateʼs percent-
age of people holding degrees to 45 percent over
The funding will be concentrated in three pro- the next 10 years. The Michigan Commission on
gram areas: (1) 40 percent will support a Basic Higher Education and Economic Growth is
Research Fund, to be distributed to projects from expected to report its findings by Jan. 1, 2005.
33
36. Minnesota
Academic research per capita ranking (fiscal Gov. Tim Pawlenty has made bioscience research
2001): 34 out of 51 and development a cornerstone of his economic
State spending on higher education per $1,000 development efforts. Pawlenty said bioscience
of personal income (2004): 21st of 50 advances represent “the next frontier” and that
they will “revolutionize big parts of our economy
According to the 1999 National Science Foun- within the next two decades.” He indicated re-
dation statistics, Minnesota was the 15th best search and new industries are integrating knowl-
state for R&D spending per capita at $808, and edge and ideas from molecular biology, genom-
the 16th best state for overall R&D spending at ics, materials science, electrical engineering,
$3.8 billion. Minnesota Technology Inc., (MTI) optics, bioinformatics, and agricultural processing
commissioned a study, Future Technologies Life to create scientific advances and practical prod-
Sciences 2003 Delphi Study, which identifies new ucts that can be used to save lives, make a better
technologies emerging from research laboratories fabric, create clean energy sources, and almost
to become products or services that can be sold limitless other applications.
in the marketplace. MTI recognizes the conver-
sion of technology into the marketplace through Pawlentyʼs proposals include: (1) Development
R&D helps companies find a competitive niche in of a Bioscience Park. Similar to one of the Gover-
todayʼs evolving economy. Annual reports from norʼs proposed JOB Zones, this Bioscience Park
Minnesota-based Medtronic and 3M illustrate the would be a private-public partnership designed to
importance of R&D, as they continually reap the attract cutting edge bioscience companies to Min-
benefits of those investments. Medtronicʼs 2003 nesota. (2) Create Major Partnership in Genom-
annual report states that “approximately two- ics and Biotechnology. Bringing together two of
thirds of current revenues were generated from the nationʼs top biotech and genomics research
products introduced within the past two years.” assets, the University of Minnesota and the Mayo
3M strongly advocates future R&D efforts as Clinic, the state will lead efforts to create a new
they state their 2002 research and development partnership and joint ventures between those two
related expenses were close to $1.1 billion. MTI institutions as well as Minnesotaʼs bioscience,
and Bemidji State University conducted this study medical device, and value-added agriculture
to point out that Minnesotaʼs R&D infrastructure companies. (3) Stimulate Investment in Min-
can capitalize on life sciences technology, nesota Bioscience Projects. Citing the example
converge the technology into the marketplace of the State of Wisconsin Investment Board, the
and ultimately benefit the region.
34
37. Minnesota State Board of Investment would be education: (1) Appointment of a Commission on
encouraged to seek out and support Minnesota- the Future of Higher Education – to recommend
based bioscience businesses. (4) Tax Incen- ways to improve higher education, and identify
tives for Bioscience Development. After the state new funding sources for colleges and universities;
budget deficit is resolved and economic times (2) Creation of the Research Alliance of Missouri,
improve, tax incentives would be provided to spur an alliance between businesses and universities,
both research and development and investment which will coordinate research and provide more
in bioscience projects and companies. (5) Fund access to technology for Missouri businesses.
the Universityʼs Translational Research Facility. “By these two steps, we can better direct and
This important new facility will not only lead to connect higher education and the economy. We
further bioscience discoveries, but it will be geared must make our colleges, universities, and techni-
towards transferring and applying those discover- cal schools the engines that fuel our economy and
ies in Minnesotaʼs economy. (6) Funding for Re- the future,” Holden declared.
search. The Governor repeated his commitment to
maintain funding for the University of Minnesotaʼs Missouri has created a student loan forgiveness
Academic Health Centers and academic health re- program aimed at keeping the stateʼs best and
search. His budget preserves and protects recent brightest math and science students in Missouri
new funding streams for those purposes. following graduation. The Missouri Advantage
Repayment Incentive Option (MARIO) provides
Missouri up to $10,000 in student loan forgiveness for
Academic research per capita ranking (fiscal college students who graduate with a math or
2001): 23 out of 51 science degree and go to work for a Missouri life
State spending on higher education per $1,000 of science related company. This is the first step in
personal income (2004): 43rd of 50 Holdenʼs Jobs Now plan, which calls for stronger
ties between business and research institutions
Policymakers in Missouri have reaffirmed that edu- to ensure that new technologies are brought to
cation will serve as the foundation for that stateʼs market and lead to additional jobs.
ʻknowledge-basedʼ economy of the future. In his
2003 State of the State Address, Governor Bob
Holden called for two action plans to strengthen
the link between Missouri businesses and higher
35
38. New York North Dakota
Academic research per capita ranking (fiscal Academic research per capita ranking (fiscal
2001): 17 out of 51 2001): 6 out of 51
State spending on higher education per $1,000 of State spending on higher education per $1,000
personal income (2004): 41st of 50 of personal income (2004): 4th of 50
New York Centers of Excellence – a network of The National Institutes of Health recently an-
high-tech research and economic development nounced a five-year, $16.3 million grant to
from Buffalo to Brookhaven -- creates an Empire promote biomedical research in North Dakota.
State High Tech Corridor that connects the high- The NIH Funding is the second phase of a previ-
tech industry with the universities. Additional Cen- ous grant designed to increase competitiveness
ters of Excellence such as New York Presbyterian for federal research money by smaller states.
Hospital, Cornell and Columbia universities, New Grants were given to North Dakota, along with
York Medical College and companies focused 22 other states and Puerto Rico, which combined
on biotech, along with Sloan-Kettering Cancer were receiving only 5 percent of NIH funding.
Center, NYU and other medical institutions, are The grants will help spur research initiatives and
expanding the Empire State High Tech Corridor. help build state research infrastructure networks.
They are all building on the biotech industry and Sen. Byron Dorgan, D-N.D., said heʼs worked
their academic strengths. In order to create a new to spread money in developing research zones,
economy in New York, the state must also build such as that between UND in Grand Forks and
on the other high-tech and biotech investments in North Dakota State in Fargo. This area is the
their STAR Centers, Advanced Research Centers cornerstone of his Red River Valley Research
and Centers for Advanced Technology. Corridor concept, with uses the stateʼs two larg-
est universities to attract more research funding
and enhance the stateʼs economic development.
The University of North Dakota will administer
the grant in collaboration with North Dakota State
University; Mayville State, Belcourt, Valley City,
Minot and Dickinson are also involved. The grant
will provide $1.2 million for science education at
four North Dakota tribal colleges as well.
36
39. Gov. John Hoeven has asked for $50 million to Research and Technology Transfer (BRTT), the
support the creation of new Centers of Excel- Wright Centers of Innovation, Wright Projects and
lence on each of the state college campuses to the Third Frontier Action Fund. Since 2002, the
accelerate the growth of targeted industries in all BRTT has distributed nearly $80 million to sev-
regions of North Dakota. The centers would use eral multi-million-dollar collaborative biomedical
the funds to leverage federal dollars, private sec- and biotechnology research projects that could
tor support and philanthropy to generate another lead to commercialization. The Wright Centers
$100 million. Potential projects for the campuses of Innovation, supporting large-scale research
include expansion of technology parks and exist- and tech-development platforms, are to be col-
ing centers and the creation of new centers in laborations among Ohio higher education institu-
numerous areas: biometrics and the life sciences; tions, nonprofit research organizations, and Ohio
rural technology, distance learning and computer companies in the areas of advanced materials,
networking; oil and gas training and technology; bioscience, power and propulsion, information
renewable energy; bio-security; advanced manu- technology and instruments, controls and electron-
facturing; audiology; rural law enforcement; ics. Wright Projects require major capital acquisi-
and tourism. tions and improvements at Ohio higher education
institutions and nonprofit research organizations
Ohio and must be near-term commercialization proj-
Academic research per capita ranking (fiscal ects. Funds for the Third Frontier Action Fund will
2001): 36 out of 51 be distributed across various action programs: (1)
State spending on higher education per $1,000 Validation/Seed Capital Funds to enhance early-
of personal income (2004): 35th of 50 stage Ohio technology companies; (2) collabora-
tive R&D grants through Ohioʼs Fuel Cell Initiative;
Ohio supports biomedical research and tech- (3) Product Development Pilot Program, providing
nology development, passing three bills com- development assistance to small and medium-
mitting state legislature to an additional $103 sized Ohio manufactures; (4) company recruitment
million for its Third Frontier Project for the fis- and attraction.
cal year, beginning July 1, 2004. The stateʼs
Third Frontier portfolio includes the Biomedical
37
40. Pennsylvania
Academic research per capita ranking (fiscal Pennsylvania ranks 4th in the nation in terms of
2001): 10 out of 51 the number of research and development facilities,
State spending on higher education per $1,000 of and 4th in the nation in terms of doctoral scientists
personal income (2004): 46th of 50 and engineers. There are nearly 40 Nobel Prize
Winners at research institutions in the Philadelphia
Pennsylvania supports technology development region alone.
and utilization through: (1) The Ben Franklin Part-
nership Program – allowing state government to
support small technology start-ups and facilitate South Dakota
the cooperation between industries and universi- Academic research per capita ranking (fiscal
ties to help solve firmsʼ problems. The program 2001): 51 out of 51
will provide financial support for early-stage, State spending on higher education per $1,000 of
high-tech venture companies and R&D activi- personal income (2004): 22nd of 50
ties, and will encourage the commercialization
of research: (2) The Industrial Resource Center South Dakota has invested an additional $2.8 mil-
Program – founded in 1988 to help companies to lion in its public universitiesʼ potential to grow the
adopt proven technologies to increase their com- stateʼs economy through research investments.
petitiveness; (3) R&D Tax Incentives – providing This funding comes from economic development
tax benefits for the high-tech industry, to stimulate legislation, passed in 2004, that approved creation
R&D activities and technological innovations. The of four new specialized research centers to be
state offers employers a 10 percent tax credit for completed by 2010. The research centers were
new R&D investments and provides a $1,000 tax selected by a research and commercialization
credit per newly created jobs for companies that council, after reviewing 11 proposals submitted by
focus on the development of technology; (3) The faculty at South Dakota public universities. The
Technology 21 Initiative Report – initiative devel- four research centers are: (1) Center for Infec-
oped to seek industry input regarding the role of tious Disease Research and Vaccinology, South
state government in helping Pennsylvania high- Dakota State University, $780,000. This center
tech businesses remain competitive. One of the will foster research leading to the development
major report recommendations is to establish a of novel therapeutic and diagnostic technologies
research and technology network among research and products for infectious diseases in humans
institutions, universities and industries.
38
41. Texas
and domestic animals; (2) South Dakota Signal Academic research per capita ranking (fiscal
Transduction Center, University of South Dakota, 2001): 26 out of 51
$900,000. This center will examine the pathways State spending on higher education per $1,000 of
that regulate cell growth and differentiation, cell personal income (2004): 19th of 50
death, response to stress and the maintenance
of constant physiological conditions, with a goal The Texas Enterprise Fund was proposed in
of reducing cardiovascular disease and cancer; 2003 to help grow the stateʼs economy by invest-
(3) Center for Accelerated Applications at the ing in technology, biotechnology and university
Nanoscale, South Dakota School of Mines and research. Thirty percent of the revenue projected
Technology, $585,000. This center will focus on for the stateʼs Economic Stability Fund – roughly
research in the areas of nanoparticles and associ- $390 million – will make up the Enterprise Fund.
ated nanosensors, with emphasis on South Dakota Along with investing in tech fields and research, a
mineral development; (4) Center for Research and portion of the money will be used to retain compa-
Development of Light-Activated Materials, Univer- nies, such as Sematech, that can attract related
sity of South Dakota, $503,741. This center will businesses to the area. There is also a Science
perform both basic and developmental research Initiative dedicated to improving pay for science
on materials with light-activated properties. The teachers and providing students with the neces-
research is important to medical applications such sary tools for technology jobs.
as human tissue bonding, drug delivery, and anti-
tumor agents, and is important to developing phos-
phors for sensors, new laser materials, and thin Washington
films that impart special properties and characteris- Academic research per capita ranking (fiscal
tics to the materials they coat. Within the first two 2001): 24 out of 51
years of the initiative, seven new senior scientists, State spending on higher education per $1,000 of
eight postdoctoral students, seven Ph.D. students, personal income (2004): 29th of 50
eight graduate associates, and 11 technicians will
be brought into the state university system. Also In 2003, Washington Governor Gary Locke
associated with the project will be another 24 uni- proposed $20 million in higher education funding
versity scientists, whose salary is associated with to expand enrollments at their colleges and uni-
their respective institutions. versities by more than 1,500 students. The funds
will be dedicated exclusively to high-demand
fields such as engineering, computer science and
health care. This will help the state create high-
paying jobs by supporting industries such as
biotechnology and software.
39
39
42. “Few states have the infrastructure, the
prestige and the talent to support stem
cell research over the long run. Wisconsin
is one such state.”
- Wisconsin Technology Council
40
43. STEM CELL RESEARCH: A CASE STUDY
Few examples of academic research and develop- “Just as the names Watson and Crick will always
ment in Wisconsin are more illustrative of R&Dʼs be related to DNA, (Thomson) … will forever be
potential economic value than current research linked with stem cells,” noted a 2004 publication
into human embryonic stem cells. If Wisconsin by UW-Madison.
fails to secure its world-class “head start” in such
research, however, the state could forfeit hundreds Since 1998, scientists across the United States
of millions of dollars in opportunities and hundreds, and Canada and in dozens of foreign lands have
if not thousands, of high-wage jobs. engaged in the race for stem cell breakthroughs.
Wisconsin is still among the worldʼs leaders, but
Using donated, surplus embryos produced by in that advantage could be lost – and with it, a valu-
vitro fertilization, a group of UW-Madison develop- able economic growth opportunity – unless Wis-
mental biologists led by James Thomson estab- consin resists attempts to curtail such research
lished five independent stem cell lines in Novem- and instead invests in its future. Few states have
ber 1998. This was the first time human embryonic the infrastructure, the prestige and the talent to
stem cells had been successfully isolated and support stem cell research over the long run.
cultured, and the discovery took the scientific Wisconsin is one such state.
world by storm. Thomsonʼs face graced the cover
of Time magazine (August 20, 2001) and millions
of hopeful people began talking about the promise
of stem cell research.
41