1. Web Server Workload Characterization and Generation
Archana Ganapathi
archanag@cs.berkeley.edu
Abstract
Workload characterization and generation are essential tools to assist in building and maintaining
web services. We discuss a framework that allows us to take advantage of trace data, process it
using Machine Learning algorithms, and generate workload that produces specific effects on the
target system. We performed clustering analysis to characterize a specific web server workload
and discuss the analysis results and action items to fortify our workload generation framework.
1. Introduction
The plethora of web services in today’s cyberspace has introduced a new set of challenges for
systems developers. The scale and variety of workload handled by these web services can
drastically increase and/or change over a short period of time. Currently, there are no tools to help
operators predict scaling issues and system behavior after hardware and/or software configuration
changes. The absence of such a tool results in unanticipated downtime, which ultimately reduces
to a significant loss of revenue for the company.
A representative, scalable and adaptive workload generator is the missing component that will
enable web service operators to predict system behavior during the development and maintenance
process of online services. Workload generation helps identify bottlenecks in the system and
allows the developer to test particular parts of the system. It is also useful in predicting scaling
issues and understanding system behavior under various configurations and saturation states.
Currently, there is no uniform methodology for workload generation and existing workload
generators are very system-specific.
Furthermore, there is no effective way to predict the behavior of a system that is exposed to
unexpected request patterns. The first obvious step in understanding how the target system works
is to interpret the workload it handles. It is crucial to understand the characteristics of workload
input and observe its effects on the target system. Since we are looking at web services, we use
traces (typically http traces) that were collected at various internet services and try to characterize
the consequent workload. Once we characterize the workload, we can tie it in with low-level
system metrics (such as power consumption and CPU utilization), and correlate workload
patterns with variations in system metrics. Our goal is to provide a framework for workload
characterization and generation.
Our proposed framework must be generic enough that it can accommodate existing commonly
used workload generators. It must also be reconfigurable to allow black-box workload generation
(where it learns properties of the system based on responses) as well as task-specific workload
generation where we can target which features of the system we’d like to evaluate.
One of the major obstacles of building such a framework based on trace data is privacy.
Companies often disallow sharing their data without explicit Non-Disclosure Agreements and
significant restrictions on how we use the data. We attempt to address such privacy concerns
2. related to sharing data and hope to take advantage of Machine Learning to condense trace
information into a concise, anonymized digest that has no pointers to the internal workings of the
system.
In this paper, we specifically elaborate upon the workload characterization process using various
clustering algorithms to partition trace data into unique working sets. We have made limited
progress in clustering the data; however, the process revealed the limitations of our dataset and
methodology and has helped us identify a set of action items to pursue to achieve our long-term
goals.
2. Related Work:
We evaluate related work in the workload generation frameworks, workload generators and
workload characterization domains.
Special-purpose Workload Generation Frameworks:
• Filebench (Sun Microsystems): This framework models/generates application interactions
with file systems. The desired behavior can be specified in a domain-specific language and is
then translated using pre-defined macros to determine the quantity and type of i/o requests.
• MACE (University of Wisconsin): This framework is used to specify and generate malicious
network traffic. This tool is commonly used in the network security domain.
• StreamGen (Georgia Institue of Technology): This framework allows users to generate
distributed events and data streams. However, they do not do much in terms of
sophisticatedly characterizing the workload.
Workload Generators:
• SURGE: (short form for Scalable URL Reference generator), captures file size and request
size distributions and relative popularity of requested files. It also models think time and
allows users to configure specific models of interest.
• SPECweb: Caters to web server. This workload generator generates http requests only and
only captures the 200 (or OK) response. It is very difficult to configure and has been known
to have request distributions that are quite different from actual trace data (especially at high
numbers)
• TPC-W: This workload generator models an online bookstore, which allows web serving,
browsing and shopping cart facilities. However, the set up overhead for this workload
generator is extremely high.
• SLAMD: Java-based, tests network-based applications (specifically LDAP directory servers).
This workload generator can also be used for Web servers and Web-based applications,
relational databases, and mail servers. SLAMD is becoming more and more popular due its
diverse nature of workload generation.
• Harpoon: A flow-level Traffic Generator, mimics internet traffic and generates representative
background traffic for application and protocol testing.
• Optixia: This is one of few hardware-based workload generators. It is commonly used as an
IP Performance Test platform, and can create and transmit any type of Layer 2-3 traffic
patterns at up to line rate over a network.
• Hammer: This is another rare instance of a hardware-based traffic generator. However, this
workload generator is specific to VoIP and PSTN telephone call generation.
3. While all the above workload generation tools are widely used in their specific application
domains, they do not perform well in the presence of a black-box system. They require a certain
degree of prior knowledge of the system, for which the workload generator is custom-configured.
Workload Characterization:
Arlitt et al. [AJ00] analyze the same data set we used for our study from the World Cup 1998.
However, they manually sort the data to identify prominent patterns of the traces and do not do
much in terms of applying maching learning algorithms. Moore et al. [MC+05], on the other
hand, consider various trends in data center workload and attempt a framework to instrument and
analyze workload in a data center and effectively emulate it. Eeckhout et al. [EV+02] consider
workload characterization for energy and power consumption in the Java Virtual Machine. They
instrument the virtual machine to observe these characteristics and analyze them. There has also
been some work on using Neural Networks for characterizing 3-tier web service workload that
follows non-linear behavior [YL+06]. Again, we see the predominance of a model-based
approach where a preconceived notion of the system has a dominant effect on the analysis results.
We hope to create a less biased characterization methodology for our future experiments.
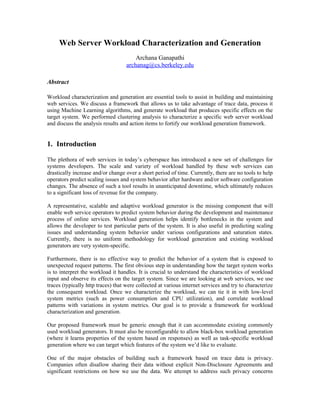
3. Workload Characterization and Generation Methodology:
Traces Project future
at t=n-2 behavior given
at t=n-1 historical trends
Metrics clustering Wstatic stratified Wdynamic
sampling
at t=n
Statistically
Scale Up
Workload
Behind the Firewall Synthetic
Model
Workload open/closed/ajax..
Generation
Figure 1: Workload Generation Framework. The diagram outlines each component we will use to
implement our methodology.
The figure above shows our proposed framework for capturing traces, condensing essential
features of the data and using the information to replay workload. Below we elaborate on each
step of the process outlined above, and discuss how we validate our generated workload.
Methodology:
1. Derive metrics of interest: We must identify what features of the trace data are most useful in
capturing the relationship between web server traces and system behavior. We can use a
combination of feature-selection algorithms and low-level metric data gathered as per
suggestions of knowledgeable domain experts.
Formally speaking:
Metrics = set of feature vectors
2. Clustering: Once we have identified useful features, we must cluster the workload trace data
4. based on system behavioral features of interest. Each cluster will consist of a specific set of
requests that produce particular system effects. In this step, we must identify the most
appropriate clustering algorithm for our data set and define distance metrics between data
points. Once we have clusters, we can summarize the features of the cluster and use the
summary as an anonyzed version of the cluster, which we refer to as an equivalence class.
We elaborate on this particular step of the process in subsequent sections of the paper.
Formally speaking:
Cluster = set of related metrics given pair-wise distance and clustering algorithm
Let N = number of equivalence classes
3. Understanding the static workload: Workload tends to be of two types-static and dynamic.
At this phase, we study static workload. Typically, there are several relationships between the
workload and system metrics that are static, such as database-intensive requests and CPU-
intensive requests. The clustering analysis helps us identify static effects of the workload on
the system (or Wstatic as enumerated in the system). These properties can be formally described
as follows:
Wstatic = {cluster centroidi, cluster radiusi} where 1≤ i ≤ number of equivalence classes
4. Stratified sampling: Once we determine the various clusters (and/or equivalence classes), we
must sample data from the original trace proportional to the specific workload mix we would
like from each cluster/equivalence class. With this information, we can generate the dynamic
component of the workload.
5. Dynamic workload: There are several aspects to the workload that may not be present in the
traces (but we would like to simulate). For example, load spikes may not be captured in a
given trace but we may choose to simulate it by scaling up trace data and adding
representative synthetic filler data. We can generate a variety of Wdynamic mixes based on the
task we would like to perform. For example, each Wdynamic can represent a different usage
pattern (request sequences, inter-arrival rates etc). Furthermore, as Wdynamic is a simple
transition matrix between equivalence classes, it contains no proprietary data and can be
easily shared outside a corporate domain without privacy concerns. More formally:
Wdynamic = NxN transition probability matrix
6. Projecting future behavior: Given various Wdynamic matrices for workload of different time
points, we can use past trends to extrapolate future workload characteristics. This step would
be useful to understand the evolving nature of the system and its workload but is not
mandatory for simple workload generation.
7. Statistically scaling up: We can use Wdynamic to seed our synthetic workload and scale up to the
desired quantity to stress-test our system. This step would help us determine the behavior of
the target system under high load, determine the saturation point, and observe how the system
behaves at its saturated state.
8. Synthetic workload generation: Lastly, we would like to perform the actual load generation
based on all the above 7 steps and statistical learning processes. We would like the user of the
workload generator to specify certain characteristics of the synthetic workload and custom-
configure the generator based on their testing goals.
Closely following the above 8 steps would guarantee that our workload generator is scalable and
adaptable. However, as the saying goes, “the proof is in the pudding” as far as being able to
5. generate realistic workload.
Validating the synthetic workload:
Success of our workload generator is not just defined by the ability to generate synthetic
workload. It also assumes that the generated workload is realistic. To evaluate this aspect of our
workload generate, we must compare the behavior of the system under trace-based workload to
the same under our generated synthetic workload. We plan to take advantage of virtual machine
technology for this purpose. As virtual machines provide us observability, we can run a variety of
applications on these virtual machines, replay the traces, observe system behavior, and repeat the
process by replaying our synthetically generated workload. Comparing the two behavioral
patterns will close the feedback loop and inform us about how accurately our synthetic workload
reproduces system behavior.
4. Clustering for Workload Characterization:
As a proof of concept for applying machine learning for workload characterization, we
implemented a few clustering algorithms and evaluated their performance against a set of http
traces. The algorithms, data set, and experimental results are described below.
Clustering Algorithms:
Clustering algorithms approximate a loosely-defined optimal assignment problem. In many
cases, including ours, the number of desired clusters is unknown, making it difficult to select a
concrete number of clusters and formulate the clustering task as an integer program. We
implemented two approximate solutions to clustering:
K-Means/K-Median Clustering Agglomerative Clustering
Initialization Choose k data points uniformly at Each data point is the center of a singleton
random from the full data set cluster
Iteration 1) Assign each data point to the 1) Merge two clusters whose centers are
nearest cluster center closest to each other
2) Recompute cluster centers as the 2) Recompute cluster centers as the
“average” of all member data points “average” of all member data points
Runtime O(n2) O(n) (one new cluster per iteration)
6. Figure 2: Comparison of Clustering Algorithms
Iterative k-means/medians clustering: This algorithm chooses k data points uniformly at random
from the data set as the initial cluster centroids. At each iteration, each data point joins the cluster
whose centroid is closest to it relative to all other cluster centroids, and the centroid of each
cluster is recomputed as the average/median of all member data points. This algorithm iterates
until cluster membership stabilizes. In addition, we forbid the existence of singleton clusters: a
cluster containing only one data point ceases to exist, and its constituent joins the nearest cluster.
k-means/medians clustering implements the expectation-maximization (EM) algorithm for a
uniform prior distribution over cluster membership. While easy to compute, it is sensitive to the
choice of initial cluster centroids (which can be alleviated by clever seeding techniques as
discussed later). The random seeding approach also causes non-deterministic cluster formation.
Furthermore, this algorithm does not provide much information about structure within clusters,
and hence is not as informative as the next algorithm we discuss.
Hierarchical agglomerative clustering: This algorithm starts with n singleton clusters, one for
each data point. At each iteration, it identifies the pair of clusters that are closest to each other
and merges them together. The centroid of the newly merged cluster is the average of all data
points in both original clusters. Agglomerative clustering implements a deterministic bottom-up
approximation to the optimal assignment; it provides more consistent behavior than k-means
clustering, and returns a binary tree that provides some insight into the internal structure of the
clusters it finds. However, the drawback of this algorithm is that greedy clustering based on
minimizing inter-cluster distance can lead to odd groupings in the outcome.
Both algorithms required us to define data-specific clustering features and distance metrics. We
discuss the data and relevant features and metrics in subsequent sections.
Raw Data:
We used the 1998 World Cup Web traces to apply our clustering techniques for characterizing
workload. These traces were obtained from www.france98.com and parsed from compressed
binary logs to user-readable format (as shown below). Each log file contained 1 day of data
(which was around 1.5 million requests). Due to the large scale of data in each log file, we were
only able to use one day of data at a time to prevent memory exhaustion.
ClientID TimeStamp Method URL/Object Requested Type Protocol Resp Size Server
595 894146590 GET /images/10538.jpg jpg HTTP/1.0 200 15770 32
1002 894146590 GET /english/images/archives.gif gif HTTP/1.0 200 869 32
2546 894146590 GET /english/frntpage.htm htm HTTP/1.0 200 12518 32
26637 894146590 GET /english/history/images/reading.GIF GIF HTTP/1.0 200 1171 32
26637 894146590 GET /english/history/images/history_hm_header.gif gif HTTP/1.0 200 688 32
33534 894146590 GET /images/saintetienne.gif gif HTTP/1.1 304 0 32
33808 894146590 GET /french/venues/images/venue_bu_city_off.gif gif HTTP/1.0 200 781 32
33808 894146590 GET /french/venues/images/venue_bu_statium_on.gif gif HTTP/1.0 200 1017 32
Figure 3: Raw Data Format
7. Below is an explanation of each of the fields in the raw data:
• clientID - a unique integer identifier for the client that issued the request (includes proxies).
Mappings are one to one and consistent across all traces in this data. However, they are
anonymized for privacy concerns.
• timestamp - the time of the request (converted to GMT), stored as the number of seconds
since the Epoch. Local time can be determined by adding 2 hours to the existing timestamp.
• method - the method contained in the client's request (e.g., GET). Mappings for this are
contained in src/*/definitions.h.
• objectID – URL for specific object requested. These mappings are also 1-to-1 and are
preserved across the entire data set.
• objectType - the type of file requested (e.g., HTML, IMAGE, etc), generally based on the file
extension (.html), or the presence of a parameter list (e.g., '?' indicates a DYNAMIC request).
If the url ends with '/', it is considered a DIRECTORY. Mappings from the integer ID to the
generic file type are contained in definitions.h. If more specific mappings are required this
information can be obtained from analyzing the object mappings file
(state/object_mappings.sort).
• Protocol/version – HTTP version indicated in the client's request (e.g., HTTP/1.0)
• Response - response status code (e.g., 200 OK).
• size - the number of bytes in the response sent from server back to client.
• serverID - indicates which server handled the request. We can further parse this field to
identify exact server and location. The mappings are one-to-one and consistent throughout the
traces.
Derived Features:
LastReq LastReq
Time ObjType LastReqURL
0 gif /images/102338.gif
11 gif /english/images/news_btn_letter_off.gif
2 gif /images/hm_brdr.gif
FALSE FALSE FALSE
0 GIF /english/history/images/reading.GIF
2 gif /images/lyon.gif
1 html /french/venues/venues/bordeaux.html
0 gif /french/venues/images/venue_bu_city_off.gif
While the raw data was in itself very descriptive, we did not have any information on the
implications of the traces on the system. To gather some structure about trace sequences, we
tried to gather certain temporal patterns by including historical data for each client request.
8. We derived the following features and added them to the request data:
• Time since last request: For each request, we obtained the timestamp for the previous
request made by the same client and obtained the difference between the current and
previous time stamp. This information helps us identify (to a small degree) user-behavior
and think-time models.
• Last object requested: For each request, we also recorded the previous object requested
by the same client so we can determine a request transition graph and identify what
common request streams look like.
• Last requested object type: In addition to the path to the specific object, we extracted the
type of the previous object request made by the same client. This data helps us identify
patterns pertaining to sequences of object types that are requested together. For example,
if I am requesting a gif, we can extrapolate what my most likely next request will be for
(perhaps another gif or jpg).
Clustering Features:
Eventually plan to use feature selection once we have traces of requests’ effects on system. For
now, we manually choose the following features to cluster on:
• Timestamp
• URL of requested object
• Type of object requested
• Response size
• Time since last request
• Previous request objectURL and objectType
• Server handling response
As and when we have more low-level metric data for the system, we plan to add those metrics as
features to our data by temporally correlating the metrics with requests input to the system.
Distance Metrics:
Clustering with numerical data permits a range of optimizations. For one thing, one can
explicitly represent the centroid of a cluster as the (probability-weighted or unweighted) average
of all data points in that cluster. This method works for numeric and binary vectors of data. For
example, the cluster centroid would be a vector of probabilities representing the likelihood that an
article contained a particular word given its membership in the cluster. However, many of our
features were discrete-valued and lacked a natural ordering consistent with the difference
operators we used. String identifiers are the best example of this problem. Specifically, in our
data, in addition to string, we also had structural information embedded in strings. The object
URL field contained a string with path information for the requested object. This forced us to
represent cluster centroids implicitly: the distance between a data point and a cluster centroid is
the average over all members of that cluster of the pairwise distance. This affects both the
performance of our clustering algorithms (agglomerative clustering must compute the distance
between a new cluster and an existing cluster using all pairs of data points from the two clusters,
instead of reducing the new cluster to a single data point) and the interpretability of the results
(we cannot synthesize a single data point that stands for an entire cluster). Here are some
examples of non-numeric data that was present in our dataset and how we calculated the
9. appropriate distance measure.
• Type of object requested: 0 or 1 based on if they’re the same or not. Later extensions:
categorize based on media, text, ajax code etc.
• Server handling the response: 0 (same server, same location), 1(diff server, same
location), 2(diff server, diff location)
• Time since last request: currently Euclidian distance (subtraction). Later we can break
this down by time of day, day of week etc. once we start using more data.
• Path to requested object: currently using string distance. However, this should logically
use “path distance” where by we calculate the number of hops between two requested
urls
e.g. dist between /france/images/blah.gif /usa/images/blee.gif should can be defined as 2
(common root is ~ and distance from both roots to ~ is 2 )
e.g. dist between /english/help/image/faq_on.GIF and /english/images/fpnewstop.gif
should be definied as 2 (common root is /english and max dist to /english from leaf is 2)
e.g. dist between /english/image/blah1.gif /english/image/blah2.gif is 1)
e.g. dist = 0 when both object URLs are the same.
Experimental Results
This section discusses the output of the automated clustering algorithms. We did not have a clear
sense of how many clusters we should expect to see, so we ran agglomerative clustering to
completion, and completed multiple runs of the k-means clustering algorithm with different initial
centroids and cluster counts. Both of these algorithms output cluster members, but as described
above, the raw data format precluded construction of an “average” cluster member.
Below, we describe the various experiments and observations for the produced clusters:
• Equal weight for all features: We started about by equally weighting all features in our data
set. Running the clustering algorithms consistently produced very randomly distributed
clusters. There seemed to be no consistent pattern for requests within each cluster. The results
for this experiment were not meaningful to us. So we decided we should increase the weight
of individual features to see if that helps provide interpretable results.
• Double weight for type of requested object type: This experiment produced clusters that
predominantly contained requests for the same object type (e.g. all gif, all html). However,
there was no clear correlation between requests within clusters other that the matching object
types. While these clusters were better than that of the previous experiment, it seemed as
though the information it produced can easily be determined by sorting the data and there was
not much value added by the clustering process as compared to the overhead.
• Double weight for time since last request: In this experiment, random requests were clustered
together based on similar values for time since last request from the same client. This
information is meaningful to understand usage behavior. We observed what types of requests
come after a significant amount of think-time and which ones stem from very short think-
10. times. However, the experiment did not shed much light on characterizing the raw workload
itself.
• Increase weight for size + object type: Increasing the priority for object type and response
size together while leaving all other features at lower weights produced some meaningful
insights. Requests for similar objects (for example, images) was further classified by similar
response sizes so we noticed clusters with similar request patterns. However, we did not get
any further insights beyond what’s mentioned above.
In the absence of cluster exemplars, we are left with the task of manually inspecting the clusters
found by our application. Working our way from the leaves to the root of the cluster tree
generated by the agglomerative algorithm, the clusters become harder to interpret. Regardless, for
the most part, our data had very scattered requests in each cluster and we did not find very
meaningful characterization results. Our concern is that the choice of features might bias the
results in favor of a particular hypothesis. One particular axis of the data could end up
significantly influencing the clustering results and the absence of sufficient feature vectors could
exaggerate this problem.
5. Discussion and Future Work:
The biggest drawback of our data set was the lack of measurable and quantifiable features that
reveal information about the target system for which the requests were generated. We plan to
alleviate this problem by replaying the traces on a virtual machine and recording various low-
level system metrics such as power consumption and CPU utilization. Such a task would enrich
the data with more observed and meaningful features and help the workload characterization
process significantly.
It was also difficult to validate “distance” between non-numeric data and we had to invent clever
workarounds for this problem. The most important of these non-numeric distance metrics is path
distance between two given URLs for requested objects. Once we implement this distance metric,
the data set and features will be richer and more informative. Another major improvement with
regards to the way the algorithms handle the data is to perform seeded clustering analysis. For
example, currently, the k-means algorithm randomly selects initial centroids to use for clustering.
However, if we intelligently select initial cluster centroids that are sparse across the data space,
our clustering results might prove to be more meaningful.
The last and probably most prohibitive aspect of our data was the sheer volume of requests for
each day. There were over 1.5 Million requests generated in a single day of trace data and our
tools were not catered to handle this volume. Thus, our analysis was limited to a single day of
data and did not span multiple days as we would have liked. As a result, the analysis is skewed by
behavioral patterns observed in a single day and there is no way to normalize the clustering
results based on other days of data. As a temporary workaround, we can experiment with stream
processing the log files to cluster across multiple days. However, there are practical limitations to
this approach due to available memory on the machines we use. The long-term solution to this
problem might be to stratify the data per day and sample data from each day to represent requests
spanning multiple days.
Perhaps we should reconsider the entire clustering approach and find an alternative algorithm that
does not involve tweaking the data so much. One conceivable (and appropriate) alternative is to
11. use Kernelized Canonical Correlation Analysis. This algorithm is a hybrid approach that projects
the data onto lower dimensions as well as clusters it to result in somewhat spherical clusters. It
can use tuples of request data and measured metrics and preserve their relationship across the
clustering process. This algorithm is the next action item we plan to pursue for our project.
6. Conclusions:
There are various benefits to our proposed workload characterization and generation
methodology. First and foremost, the methodology takes advantage of Machine Learning to
automatically distill important parameters of the workload. This fact guarantees that we do not
neglect important features based on any biases we have to system-specific behavior. We can also
generate models specific to our metric of interest, for example, performance, power, throughput,
user-response latency, or any combination of the above. Next, we can compare different
generations of models (e.g. different systems, different time points etc.) to identify data trends
over time and extrapolate to discover future behavior of the system. This ability to “fast-forward”
will prove extremely useful to web service developers and operators.
As we distinguish between model creation (inside companies, operates on sensitive data) and
model publishing (sanitized data for use by researchers), we address the privacy concern and
allow organizations to readily contribute trace data for us to process and use. This methodology
and mechanism are by no means restricted to web services and can easily be generalized to other
applications.
References:
[AJ00] M Arlitt, T Jin, A workload characterization study of the 1998 World Cup Web site.
.
Network, IEEE, 2000
[BC98] Paul Barford, Mark Crovella, Generating representative Web workloads for network and
server performance evaluation. Proceedings of the 1998 ACM SIGMETRICS joint international
conference on Measurement and modeling of computer systems SIGMETRICS '98, June 1998
[CM06] Gilberto Contreras, Margaret Martonosi, Techniques for Real-System
Characterization of Java Virtual Machine Energy and Power Behavior. IISWC 2006
[EV+02] L Eeckhout, H Vandierendonck, K De Bosschere, How Input Data Sets Change Program
Behaviour .Workshop on Computer Architecture Evaluation using …, 2002
[Filebench] www.solarisinternals.com/si/tools/filebench/index.php
[Hammer] www.empirix.com/
[Harpoon] J. Sommers and P. Barford. Self-Configuring Network Traffic Generation. In
Proceedings of ACM SIGCOMM Internet Measurement Conference, 2004.
[MACE] Joel Sommers, Vinod Yegneswaran, Paul Barford, A framework for malicious
workload generation. Proceedings of the 4th ACM SIGCOMM conference on Internet measurement,
Taormina, Sicily, Italy
[MC+05] J Moore, J Chase, K Farkas, P Ranganathan, Data Center Workload Monitoring,
12. Analysis, and Emulation. Eighth Workshop on Computer Architecture Evaluation using …, 2005
[Optixia] www.ixiacom.com/products/optixia/
[SLAMD] www.slamd.com/
[SPECweb] http://www.spec.org/web2005/
[StreamGen] Mohamed Mansour, Matthew Wolf, Karsten Schwan, A Workload Generation Tool
for Distributed Information Flow Applications Proceedings of the 2004 International Conference on
Parallel Processing (ICPP'04), August 2004
[TPC-W] www.tpc.org/tpcw/default.asp
[YL+06] Richard Yoo, Han Lee, Kingsum Chow, Hsien-Hsin Lee, Constructing a Non-Linear
Model with Neural Networks for Workload Characterization. IISWC, 2006