SlideShare une entreprise Scribd logo
1  sur  1
Télécharger pour lire hors ligne
Prosperous Times
  Prosperous Times
                                                                                   CRE Sales Volume 2004-2007 ($5m+)
  There was a period in the first decade of the 2000s, during
  2005-2007, which one can refer to as ―Prosperous Times;‖                    $250,000


                                                                   Millions
  where it seemed like everyone was prospering within
  commercial real estate. As shown in the graphs to the right                 $200,000
  or in the later part of this document, across all property
  types, sales were up, vacancies were down, CAP rates were                   $150,000                                                          Industrial
  at historic lows and rents were rising. Development was                                                                                       Office
  fast paced – construction and other bridge financing was                    $100,000                                                          Retail
  readily available and inexpensive – the market was                                                                                            Apartment
  enjoying quite a ride.                                                       $50,000


                                                                                   $0
  Debt capital was abundant. Not only for home purchases,
                                                                                           2004        2005       2006           2007
  refinances and other real estate related financial                                                                     Source: Real Capital Analytics
  transactions—but for corporations and private equity. Many
  Buyers/Users looked to future projected income (in most
  cases excessively optimistic) to justify present values that                In 2007 $423B of commercial real estate
  were unsound.                                                                        assets traded hands.

  Leverage buy-outs were abundant—the large banks, Wall
  Street and pension fiduciaries were spending into the                              CRE Avg. Price/SF 2004-2007
  economy like they had not done in the recent past.              $300
  Things were really good!                                                                                                  $271
                                                                  $250                                        $225
                                                                  $200                             $196
  Virtually all of the significant transactions (displayed on                            $175                               $187
  the following pages) were completed during this time. In                                                       $175                        Industrial
                                                                  $150                    $145     $155
  fact, there were several record-setting quarters for the                                                                                   Office
  individual property types. Competition among buyers for         $100
  the largest and best assets remained fierce. Condo                                                                                         Retail
                                                                   $50                                           $74          $76
  Converters were running strong during these years. The                                 $59       $65
  prices they paid for multi-family properties outpaced the          $0
  conservative business mind of the investor buyers.
                                                                                   2004         2005      2006         2007
                                                                                                                        Source: Real Capital Analytics

  It seemed liked everyone wanted to be in commercial
  real estate. National commercial real estate trade shows, such as ICSC, experienced record levels of attendance.
  Commercial real estate companies seemed to grow in size, more offices opened up, more professionals would be
  licensed. To say the least, it was a great time to be in commercial real estate. The commercial industry lagged
  slightly behind the Housing Boom, which took place between 2003-2005.


  Housing Market
  The ―Housing Market Boom,” a period between 2003-2005;
  where home prices dramatically increased, bidding wars
  were frequent, contracts were above asking prices and
  houses remained on the market for short periods of time.
  For a while, it seemed you could pay almost anything for a
  home, wait a few months and make a profit selling it.


  During this time, consumer confidence soared. Home
  owners were building equity at a rate that outpaced their
  savings; and as such, many stopped putting money aside
  and were looking to their future net worth to be a product of
  the value of their largest investment – their home. This in
  turn, led to many homeowners stretching the envelope as
  to what they felt they could afford. However, it appeared to                                                                Source: Fannie Mae
  be a false “Prosperous Times” and this all led to...
                                                                   “You could do less than half the things right and still
                                                                          have an awesome year…” anonymous
                                        View other sections: www.crereview.com

Contenu connexe

Plus de Coldwell Banker Commercial

Coldwell Banker Commercial - The Dirt on Land Sales White Paper
Coldwell Banker Commercial - The Dirt on Land Sales White PaperColdwell Banker Commercial - The Dirt on Land Sales White Paper
Coldwell Banker Commercial - The Dirt on Land Sales White PaperColdwell Banker Commercial
 
Moving an organization with 1000s of employees
Moving an organization with 1000s of employeesMoving an organization with 1000s of employees
Moving an organization with 1000s of employeesColdwell Banker Commercial
 
Tech-Driven Transformation: Technology Usage & Investment Grows in Commercial...
Tech-Driven Transformation: Technology Usage & Investment Grows in Commercial...Tech-Driven Transformation: Technology Usage & Investment Grows in Commercial...
Tech-Driven Transformation: Technology Usage & Investment Grows in Commercial...Coldwell Banker Commercial
 
A Review of Commercial Real Estate during the first decade of the 21st Century.
A Review of Commercial Real Estate during the first decade of the 21st Century.A Review of Commercial Real Estate during the first decade of the 21st Century.
A Review of Commercial Real Estate during the first decade of the 21st Century.Coldwell Banker Commercial
 
What has changed in Commercial Real Estate over the past 10 years
What has changed in Commercial Real Estate over the past 10 yearsWhat has changed in Commercial Real Estate over the past 10 years
What has changed in Commercial Real Estate over the past 10 yearsColdwell Banker Commercial
 

Plus de Coldwell Banker Commercial (20)

Featured listing friday
Featured listing fridayFeatured listing friday
Featured listing friday
 
2013 Year End Commercial Real Estate Review
2013 Year End Commercial Real Estate Review2013 Year End Commercial Real Estate Review
2013 Year End Commercial Real Estate Review
 
Top Commercial Real Estate Markets 2013
Top Commercial Real Estate Markets 2013Top Commercial Real Estate Markets 2013
Top Commercial Real Estate Markets 2013
 
Coldwell Banker Commercial - The Dirt on Land Sales White Paper
Coldwell Banker Commercial - The Dirt on Land Sales White PaperColdwell Banker Commercial - The Dirt on Land Sales White Paper
Coldwell Banker Commercial - The Dirt on Land Sales White Paper
 
How cicadas affect commercial real estate
How cicadas affect commercial real estateHow cicadas affect commercial real estate
How cicadas affect commercial real estate
 
Go big or go home
Go big or go homeGo big or go home
Go big or go home
 
A view from the top
A view from the topA view from the top
A view from the top
 
Moving an organization with 1000s of employees
Moving an organization with 1000s of employeesMoving an organization with 1000s of employees
Moving an organization with 1000s of employees
 
2013 Mid Year Blue Book
2013 Mid Year Blue Book2013 Mid Year Blue Book
2013 Mid Year Blue Book
 
2012 Year-End Bluebook
2012 Year-End Bluebook2012 Year-End Bluebook
2012 Year-End Bluebook
 
Commercial Real Estate Brand awareness
Commercial Real Estate Brand awarenessCommercial Real Estate Brand awareness
Commercial Real Estate Brand awareness
 
Tech-Driven Transformation: Technology Usage & Investment Grows in Commercial...
Tech-Driven Transformation: Technology Usage & Investment Grows in Commercial...Tech-Driven Transformation: Technology Usage & Investment Grows in Commercial...
Tech-Driven Transformation: Technology Usage & Investment Grows in Commercial...
 
2012 Mid-Year Blue Book
2012 Mid-Year Blue Book2012 Mid-Year Blue Book
2012 Mid-Year Blue Book
 
2012 CBC Market Review: Blue Book
2012 CBC Market Review: Blue Book2012 CBC Market Review: Blue Book
2012 CBC Market Review: Blue Book
 
2011 Mid Year Blue Book
2011 Mid Year Blue Book2011 Mid Year Blue Book
2011 Mid Year Blue Book
 
2011 NREI Beyond Core Markets Survey
2011 NREI Beyond Core Markets Survey2011 NREI Beyond Core Markets Survey
2011 NREI Beyond Core Markets Survey
 
CBC Blue Book Market Review
CBC Blue Book Market ReviewCBC Blue Book Market Review
CBC Blue Book Market Review
 
A Review of Commercial Real Estate during the first decade of the 21st Century.
A Review of Commercial Real Estate during the first decade of the 21st Century.A Review of Commercial Real Estate during the first decade of the 21st Century.
A Review of Commercial Real Estate during the first decade of the 21st Century.
 
What has changed in Commercial Real Estate over the past 10 years
What has changed in Commercial Real Estate over the past 10 yearsWhat has changed in Commercial Real Estate over the past 10 years
What has changed in Commercial Real Estate over the past 10 years
 
Tenant Retention Tips
Tenant Retention TipsTenant Retention Tips
Tenant Retention Tips
 

Prosperous Times of Commercial Real Estate 2005-2007

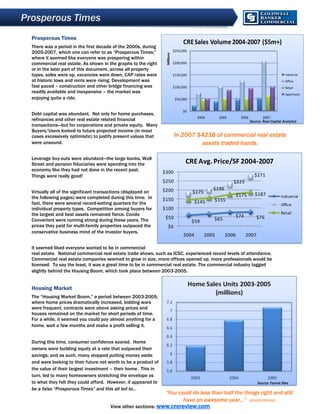
  • 1. Prosperous Times Prosperous Times CRE Sales Volume 2004-2007 ($5m+) There was a period in the first decade of the 2000s, during 2005-2007, which one can refer to as ―Prosperous Times;‖ $250,000 Millions where it seemed like everyone was prospering within commercial real estate. As shown in the graphs to the right $200,000 or in the later part of this document, across all property types, sales were up, vacancies were down, CAP rates were $150,000 Industrial at historic lows and rents were rising. Development was Office fast paced – construction and other bridge financing was $100,000 Retail readily available and inexpensive – the market was Apartment enjoying quite a ride. $50,000 $0 Debt capital was abundant. Not only for home purchases, 2004 2005 2006 2007 refinances and other real estate related financial Source: Real Capital Analytics transactions—but for corporations and private equity. Many Buyers/Users looked to future projected income (in most cases excessively optimistic) to justify present values that In 2007 $423B of commercial real estate were unsound. assets traded hands. Leverage buy-outs were abundant—the large banks, Wall Street and pension fiduciaries were spending into the CRE Avg. Price/SF 2004-2007 economy like they had not done in the recent past. $300 Things were really good! $271 $250 $225 $200 $196 Virtually all of the significant transactions (displayed on $175 $187 the following pages) were completed during this time. In $175 Industrial $150 $145 $155 fact, there were several record-setting quarters for the Office individual property types. Competition among buyers for $100 the largest and best assets remained fierce. Condo Retail $50 $74 $76 Converters were running strong during these years. The $59 $65 prices they paid for multi-family properties outpaced the $0 conservative business mind of the investor buyers. 2004 2005 2006 2007 Source: Real Capital Analytics It seemed liked everyone wanted to be in commercial real estate. National commercial real estate trade shows, such as ICSC, experienced record levels of attendance. Commercial real estate companies seemed to grow in size, more offices opened up, more professionals would be licensed. To say the least, it was a great time to be in commercial real estate. The commercial industry lagged slightly behind the Housing Boom, which took place between 2003-2005. Housing Market The ―Housing Market Boom,” a period between 2003-2005; where home prices dramatically increased, bidding wars were frequent, contracts were above asking prices and houses remained on the market for short periods of time. For a while, it seemed you could pay almost anything for a home, wait a few months and make a profit selling it. During this time, consumer confidence soared. Home owners were building equity at a rate that outpaced their savings; and as such, many stopped putting money aside and were looking to their future net worth to be a product of the value of their largest investment – their home. This in turn, led to many homeowners stretching the envelope as to what they felt they could afford. However, it appeared to Source: Fannie Mae be a false “Prosperous Times” and this all led to... “You could do less than half the things right and still have an awesome year…” anonymous View other sections: www.crereview.com