SlideShare une entreprise Scribd logo
1  sur  16
Télécharger pour lire hors ligne
Office Insight
Downtown Toronto. Q4 2013

Surprisingly, despite the increase in vacancy in the fourth quarter, average Class
A and Class B prices showed small increases to $23.70 p.s.f. and $19.42 p.s.f.,
respectively. Through 2014 these rates are expected to decrease as landlords
seek to attract tenants in a diverse and high supply market. Tenants could also
see significant benefits in the form of cash allowances and free rent periods.
Downtown Toronto did experience positive absorption of 55,000 square feet in
the fourth quarter, however this did little to offset the annual negative absorption
which ended the year at negative 667,859 square feet. In comparison, total
absorption for 2012 was a positive 537,516 square feet.
As tenants await the best possible market conditions leasing activity is expected
to decline. Over time, lower rates in the core will present more and more
tempting relocation options for companies in the suburbs looking to consolidate
and secure a downtown location. An influx of new companies into Downtown
Toronto could mean competition for tenants already here. Additionally, the
positive economic outlook with ideal leasing conditions will make Toronto an
attractive location for companies interested in entering Canada.

6.5%

2013 space completion

746,898 s.f.

12 Mth % Change in Leased area

-2.70%

2013 net absorption

-667,859 s.f.

12-month overall rent % change

+2.58%

Class A overall asking rent

$23.70 p.s.f

Class B overall asking rent

Pricing

The Mars Discovery Centre Phase II was completed and added to the downtown
inventory in the fourth quarter, the only construction completed in 2013. This
sciences targeted development at 661 University Avenue added 750,000 square
feet of space to the Downtown Toronto inventory and served as a large
contributor to the 90 basis point increase in vacancy over the quarter with
400,000 square feet of space still available in the building. Vacancy rates, as the
new developments come to market, are expected to continue to increase. In the
Class A market, vacancy rates surged 130 basis points over the quarter to match
downtown Toronto`s overall 6.5 percent rate. In the Class B market, rates
increased a modest 30 basis points to 5.7 percent.

4.7%

Total vacancy rate

Note:

70,626,238 s.f.

Direct vacancy rate

Demand

Market conditions
Conditions in the downtown core will soon see the effects of the 5.0 million
square feet of new class A office space currently under construction. Eight
developments are scheduled for completion with dates ranging through late 2014
– 2017. All submarkets with the exception of Downtown North have at least one
development in the pipeline with the Financial Core and Downtown South
receiving two and three projects respectively. Tenants in these new buildings
include RBC, Deloitte and Ernst & Young. There are an additional ten preleasing developments in Downtown Toronto whose developers are now
struggling to find suitable anchor tenants. Few, if any, are expected to move
forward in the near future.

Supply
Supply

Economy
Ontario’s economy is expected to accelerate over the next two years. RBC
Economics predicts a GDP growth of 2.6 percent in 2014 and 2.9 percent in
2015, citing a stronger manufacturing sector and the recovering U.S. economy
as catalysts. The 2013 GDP growth of 1.3 percent was largely attributable to the
vibrant service sector and limited by the weakness of the manufacturing sector.
The provincial unemployment rate is expected to drop 40 basis points to 7.1
percent by the end of 2014 and a further 20 basis points to 6.9 percent by 2015.

12-month
forecast

Current
Standing

Key market indicators

$19.51 p.s.f

indicates an increase

indicates a decrease

indicates status quo

Net new supply, net absorption and total vacancy
Net new supply

sf

Downtown Toronto sees lower market activity and
higher vacancy in anticipation of new developments

Net absorption

total vacancy

4,000,000

8%

3,500,000

7%

3,000,000

6%

2,500,000
2,000,000

5%

1,500,000

4%

1,000,000

3%

500,000

2%

0

1%

-500,000
-1,000,000

0%
2008

2009

2010

2011

2012

2013

Leasing Momentum *
30.00%

North

East

West

Core

South

King & Dufferin

25.00%
20.00%
15.00%
10.00%
5.00%
0.00%
-5.00%
-10.00%
2008

2009

2010

2011

2012

2013

.

* Leasing momentum equals change in occupied area as a percentage of all office building inventory

.

Source: Altus Insite, RBC Economics Research, Scotiabank Economics Research, Statistics Canada
Jones Lang LaSalle Americas Research • Greater Toronto Office Insight • Q4 2013 2

Available available
Sublease sublease space

Downtown East
Downtown West

sf

4,000,000

Downtown North
Financial Core

Downtown South
King & Dufferin

Downtown East
Downtown West

900,000
sf

Available direct space

Downtown North
Financial Core

Downtown South
King & Dufferin

800,000

3,500,000

700,000

3,000,000

600,000

2,500,000

500,000

2,000,000

400,000

1,500,000

300,000

1,000,000

200,000

500,000

100,000

0

0
2008

2009

2010

2011

2012

2013

2008

2009

2010

2011

Class B overall asking rents

$35

Downtown East
Downtown West

Downtown North
Financial Core

Downtown South
King & Dufferin

$ psf

Class A overall asking rents

2013

* Includes all available sublease space on the market

$ psf

* Includes all available direct space on the market

2012

$30

Downtown East
Downtown West

$25

Downtown North
Financial Core

Downtown South
King & Dufferin

$20

$25
$15

$20
$15

$10

$10
$5

$5

$0

$0
2008

2009

2010

2011

2012

2008

2013

East

400

North

South

West

Core

2011

2012

2013

East

North

South

West

Core

King & Dufferin

100
Number of blocks

Number of blocks

120

King & Dufferin

350
300
250
200
150

80
60
40

100

20

50
0

2010

Class B blocks of available contiguous space

Class A blocks of available contiguous space
450

2009

10,000 25,000 sf

King & Dufferin

25,000 50,000 sf

50,000 100,000 sf

100,000 200,000 sf

0
200,000 sf +

10,000 25,000 sf

25,000 50,000 sf

50,000 100,000 sf

100,000 200,000 sf

200,000 sf +

4

4

0

0

0

King & Dufferin

9

6

1

0

0

Core

256

202

176

139

69

Core

38

12

0

0

0

West

65

55

46

38

14

West

24

7

0

0

0

South

53

51

47

44

37

South

1

1

1

0

0

North

28

23

16

16

10

North

28

16

10

10

0

East

15

10

10

10

10

East

0

0

0

0

0

* Includes sublease space

* Includes sublease space
Source: AltusInsite
Jones Lang LaSalle Americas Research • Greater Toronto Office Insight • Q4 2013 3

GTA Submarket leverage – market condition and forecast

Property clock – current market conditions

Submarket

Peaking
market

Rising
market

2013

2014

2015

2016

Core

Tenant leverage

Landlord leverage

Downtown Toronto
Toronto

Falling
market
Bottoming
market

Downtown (excluding Core)
Midtown
GTA North
GTA East
GTA West
Landlord-favorable
conditions

Suburban Toronto

Balanced
conditions

Tenant-favorable
conditions

Q4 Completed lease transactions

Tenant

Address

Submarket

s.f.

Type

Sentry Select

199 Bay Street

Financial Core

46,000

New

LinkedIn

250 Yonge Street

Downtown North

37,000

New

Microsoft

222 Bay Street

Financial Core

26,142

Renewal

Oberfeld Snowcap Inc. 330 Bay Street

Financial Core

10,275

Sublease

Downtown Sublease Space Market
Downtown Toronto added a total of 522,618 square feet of sublease space to the market ending the fourth quarter with almost 1.5 million square feet of
available sublease space. A total of 193,214 square feet was subleased in the fourth quarter at an average space size of 6,700 square feet. This places
sublease absorption over the quarter at 328,954 negative square feet. The Financial Core remains the most active sublease market, containing more
than half of all current sublease listings. The Downtown South submarket, however, has the highest rate of sublease availability at 3.6 percent, with
subleases making up 73.0 percent of all available space. The largest sublease availabilities in the market are Allstream Canada’s seven year, 140,000
square feet seven floor sublease at 200 Wellington Street West and Manulife Financial’s eight year, 140,000 square feet seven floor sublease at 2
Queen Street East. Sublease space is expected to increase in the long term as tenants seek to upgrade in the favorable market conditions brought on
by the 5.0 million square feet of new office space coming to market through 2014 – 2017.
Downtown sublease space by lease expiration year

Distribution of available sublease space
11%

2019 +

3%

Financial Core
2017 thru 2018

Downtown East
Downtown North
19%

Downtown West
Downtown South

2015 thru 2016

King & Dufferin
2014
9%
0

10

20

30

40

50

60

70

80 s.f.

55%
3%
Source: AltusInsite
About Jones Lang LaSalle
Jones Lang LaSalle (NYSE:JLL) is a professional services and investment management firm offering specialized real estate services to clients
seeking increased value by owning, occupying and investing in real estate. With annual revenue of $3.9 billion, Jones Lang LaSalle operates in 70
countries from more than 1,000 locations worldwide. On behalf of its clients, the firm provides management and real estate outsourcing services to
a property portfolio of 2.6 billion square feet and completed $63 billion in sales, acquisitions and finance transactions in 2012. Its investment
management business, LaSalle Investment Management, has $46.3 billion of real estate assets under management. For further information, visit
www.jll.com.
About Jones Lang LaSalle Research
Jones Lang LaSalle’s research team delivers intelligence, analysis, and insight through market-leading reports and services that illuminate today’s
commercial real estate dynamics and identify tomorrow’s challenges and opportunities. Our 300 professional researchers track and analyze
economic and property trends and forecast future conditions in over 70 countries, producing unrivalled local and global perspectives. Our research
and expertise, fueled by real-time information and innovative thinking around the world, creates a competitive advantage for our clients and drives
successful strategies and optimal real estate decisions.

Prepared by:

For more information, please contact:

Taylor McCarten
Associate
Direct +1 416 238 5987
Taylor.mccarten@am.jll.com

Eamonn Murphy
Managing Director
Direct +1 416 209 8920
eamonn.murphy@am.jll.com

Jones Lang LaSalle
199 Bay Street
Suite 4610
Toronto, ON, M5L 1G3
For further information, please visit
our website,
http://www.joneslanglasalle.ca

Jones Lang LaSalle Real Estate Services, Inc. Real Estate Agency.
©2013 Jones Lang LaSalle IP, Inc. All rights reserved. All information contained herein is from sources deemed reliable; however, no
representation or warranty is made to the accuracy thereof.
Brace for the
construction boom. In
2014, over 10.0 million
square feet will be
delivered to the national
office market.

Q4 2013 Canadian Office Market Overview

Continued urbanization will drive
downtown office leasing in 2014
23.0 million square feet under construction across the country
Full year 400,000 square feet of negative absorption nationally

National vacancy at 8.5 percent in the fourth quarter

National Office Report • Q4 2013

Jones Lang LaSalle Canada Research

1
Canadian economy

Global and national economic conditions
Global economic activity was stronger leading into the end of
2013, showing signs of growth and confidence that are expected
to carry into 2014. The United States posted stronger than
expected employment and income gains in the third quarter of
2013; consequently, the Federal Reserve trimmed its bondbuying program by $10.0 billion a month, from $85.0 billion to
$75.0 billion. U.S. GDP growth is expected to accelerate into
2014; forecasts have improved, projected at 1.8 percent for 2013
and 2.5 percent for 2014. The unemployment rate stands at 6.7
percent following a dismal December, as lower than expected
job growth numbers were reported for the month. The positive
outlook for the U.S. in 2014 will be driven by the upturn in private
consumption, residential construction and private investment;
both neighboring countries, Canada and Mexico, are expected to
benefit from these improved market conditions.
Excluding Brazil, the Eurozone was the weakest part of the
global economy in the third quarter, growing only 0.1 percent
quarter-over-quarter. Forecasts for the Eurozone’s GDP growth
in 2014 and 2015, however, remain encouraging, at 0.9 percent
and 1.6 percent respectively. The European Central Bank has
set the interest rate at a record-low benchmark of 0.25 percent in
order to stimulate the economy as downward pressure continues
on the current 0.8 percent inflation rate, which stands 120 basis
points below the 2.0 percent target rate.
The Bank of Canada’s (BoC) governor, Stephen Poloz,
continued to hold the target overnight rate at 1.0 percent. This
policy will remain in place if inflation remains muted and
imbalances in the household sector continue to improve. CPI
inflation rose 1.0 percent year-over-year for November, missing
the target rate of 2.0 percent by 100 basis points. With inflation
expectations well anchored, both core and total CPI inflation are
expected to slowly return to the 2.0 percent rate.

National Office Report • Q4 2013

Employment gains in 2013 were disappointing as Canada had
the slowest December year-over-year growth rate since 2009,
adding a merely 102,000 jobs or 0.6 percent over 12 months.
Employment fell by 46,000 jobs in the month of December,
increasing the unemployment rate by 0.3 percent to 7.2
percent. The Canadian GDP growth rate for 2013 has been
adjusted to 1.8 percent and forecasts for 2014 have increased
to 2.4 percent. Canadian growth in 2014 will be determined by
the approval of key export pipeline projects. The oil and gas
sector currently accounts for 25.0 percent of Canadian
exports, and could expand if Canada gains access to the
Asian market through the proposed pipeline projects along the
West Coast and Atlantic Canada.
The Canadian economy is anticipated to benefit from the
positive outlook on the United States in 2014. The cyclical
recovery of the U.S and a possible softening of the Canadian
dollar will allow Canada to benefit through exports. The
Canadian dollar will likely fluctuate around the low- to mid-90¢
(U.S) range; this is expected to increase foreign demand for
Canadian exports and reduce Canada’s $120.0 billion noncommodity trade deficit.
U.S housing starts jumped to 1.1 million units annualized in
November and is expected to increase to 1.4 million units by
2015. Construction starts for the Canadian housing market
cooled down in 2013, slowing to 188,200 units. The outlook for
2014 shows housing starts further declining to 180,000 units;
as several developers pull back projects to allow demand to
catch up with supply.

Jones Lang LaSalle Canada Research

2
Office market overview

National market conditions
The Canadian office market, stretching from Halifax in the east
to Vancouver in the west, saw an uptick of leasing velocity in
the last three months of the year after posting negative net
absorption in three consecutive quarters. Quarter over quarter,
net absorption totalled 200,000 square feet which while
positive, was not enough to offset the three previous quarters,
bringing 2013 net absorption to negative 400,000 square feet.
Looking back, we have not registered a full year with total
negative net absorption since the 2008 and 2009 recession
when the market shed close to 1.2 million square feet.
In Canada, overall leasing activity was notably stronger in the
suburban landscape while several downtown markets were in
the red for most of the year. Full year net absorption numbers
for the five largest office markets (Vancouver, Calgary,
Montréal, Ottawa and Toronto) were negative 1.7 million
square feet in downtown and positive 280,000 square feet in
the suburbs. Leasing activity is expected to pick up in 2014,
particularly in downtown markets as economic conditions and
the labour market improves. In addition, we expect certain
suburban markets to perform well, particularly markets with a
significant presence of U.S. companies and markets with
superior transit connectivity.
Despite overall positive absorption in the fourth quarter, the
national office vacancy rate increased for the sixth quarter in a
row to 8.5 percent, up 60 basis points quarter over quarter and
120 basis points year over year. Vacancy remains highest in
suburban markets, with the five largest office markets ending
the year with an overall vacancy rate of 11.7 percent while the
downtown rate was 6.1 percent. The overall vacancy rate
increase was primarily due to the completion of 26 office
projects in the fourth quarter, adding 3.3 million square feet of
which 2.5 million square feet were in suburban markets.

National Office Report • Q4 2013

We expect this trend to continue over the next few years as
the current office development cycle enters its completion
phase. Nationally, there is 23.0 million square feet in the
pipeline, or 4.7 percent of the total inventory, all slated for
completion through 2014 – 2018. Approximately 75.0 percent
of that space is downtown developments, while 25.0 percent is
suburban developments. To put this in perspective, in the
markets of Toronto, Calgary and Vancouver city wide stock
will increase by 5.0 to 11.0 percent.
Another noticeable increase over the past 12 months is the
amount of available sublease space. Nationally, the sublet
availability rate sits at 1.9 percent representing an increase of
2.8 million square feet year over year. The sublet availability
rate is particularly high in downtown markets. For example, in
downtown Calgary and Toronto the rate has almost doubled in
the past 12 months. This increase, coupled with development
completions and tenant movements to said completions is
creating large blocks of direct vacant space. These blocks are
putting pressure on landlords to either lower their net asking
rents or be more liberal with their concessions. Nationally,
overall rents are close to peaking or at the peak for this cycle,
thus shifting the office market from landlord-favourable to a
more neutral market. At the end of the fourth quarter national
average asking net rents were $16.14 per square foot, up from
$16.03 year over year, but slightly down when compared with
the previous quarter.
As shown in the JLL market clock on the following page,
several markets have passed the 12 o’clock mark and
ventured into the falling quadrant. We expect this trend to
continue as rents gradually decrease leading to more tenantfavourable conditions over the next three to four years.

Jones Lang LaSalle Canada Research

3
Canadian Office Property Clock
Q4 2013

Canada, Montréal

Toronto

Vancouver, Québec City

Calgary

Edmonton
Winnipeg

Ottawa

Rental growth
slowing

Rents
falling

Rental growth
accelerating

Halifax

Rents
bottoming out

Reading the clock
Jones Lang LaSalle’s office clock demonstrates
where each market sits within its real estate
cycle. Markets typically move clockwise around
the clock and markets on the left are generally
landlord-favourable, while those on the right
side of the clock tend to be tenant-favourable.
At the end of 2013, three major markets had
crossed the 12 o’clock position, signaling that
they had shifted from a rising to a falling market.
While Toronto and Calgary are still considered
landlord-favourable, we believe conditions will
convert to neutral and/or tenant-favourable over
the next three to four years. This anticipated
shift is in large part the result of new office
National Office Report • Q4 2013

developments, available sublet space and large
blocks of vacant space.
Canada as a whole has transitioned from the
2:30 position in 2009, 5:30 position at the end
of 2010 and the 8:00 position in 2011 to the
11:45 position in Q4 2013. JLL expects the
office markets in Montréal and Quebec City to
peak during the first quarter of 2014, pushing
the national office market to the falling rent
quadrant. It should be noted that positive
economic conditions and labour market outlook
could keep Canada at or close to peak for some
time.

Jones Lang LaSalle Canada Research

4
Calgary
• The overall vacancy rate increased 50 basis points to 7.7 percent quarter-over-quarter.
• Available sublet space accounted for over 40.0 percent of all available space in Calgary, an increase of 1.6 million
square feet year-over-year.
• 7.0 million square feet of new office space is in the pipeline with delivery dates through 2014 – 2018. The majority, 73.0
percent, is being built in Downtown Calgary.

Economy
• Alberta’s employment is expected to have grown by 2.8 percent in
2013 and come in at 2.4 percent in 2014.
• Calgary’s unemployment rate saw a slight uptick in December, up
10 basis points to 4.7 percent. Still among the lowest unemployment
rates in the country.
• According to forecasts by RBC economics, Alberta will lead the
country in real GDP with expected growth of 3.9 percent in 2014
and 3.5 percent in 2015.
Trends in Review and Outlook
• After three consecutive quarters of negative net absorption, the
Calgary office market finally crept back to positive territory with
close to 400,000 square feet of net absorption in the fourth quarter.
While positive, it was not enough to offset the three previous
quarters bringing the total net absorption for the year to negative
702,296 square feet.
• Despite Calgary’s overall positive net absorption, the total vacancy
rate increased 50 basis points to 7.7 percent quarter-over-quarter.
The increase in vacancy was primarily driven by the completion of
seven new buildings, adding close to 900,000 square feet to the
inventory and 150,000 square feet of available space, all in
suburban markets.
• With approximately 3.3 million square feet of forward leasing activity
through Q4 2013 and spilling over into the New Year, our view is
that the downtown market in 2017/2018 could be well poised to
realize vacancy rates considerably below equilibrium.
• However, our near term forecast suggests that tenants looking for
space are facing the most favorable market conditions witnessed in
the last 10 years.
• At the end of the fourth quarter, available sublet space accounted
for over 40.0 percent of all available space in Calgary, an increase
of 1.6 million square feet year-over-year.
• 7.0 million square feet of new Class A office space is under
construction, and assuming completion on time, will add over 11.0
percent to the citywide stock over the next five years. This
represents an unique opportunity for tenants to upgrade their
current office space to highly-efficient and modern spaces in both
Downtown and suburban Calgary. As of the fourth quarter 34.0
percent or 2.3 million square feet of the new construction was still
available for lease.
• In the near term, growing inventory and weaker market conditions
are placing downward pressure on rents, thus pushing the Calgary
wide office market towards more tenant-favourable conditions.
• Downtown Calgary, however, could be experiencing the beginnings
of a potentially rapid swing from a “Falling Market” to a “Rising
Market” on our property clock.

National Office Report • Q4 2013

Property Clock

Betline
Calgary
Downtown
Suburban

Peaking
market

Falling
market

Rising
market

Bottoming
market

Market

Vacancy ( %)

Absorption (s.f.)

Betline

13.7%

135,359

$17.05

Downtown

4.6%

-125,684

$28.55

North Calgary

9.6%

615,943

$17.50

South Calgary

15.1%

664,893

$19.20

Market Vitals
Net Asking Rate

Arrows represent change from prior quarter

Recent Deals
Address

Node

Tenant

Area (s.f.)

Brookfield Place

Downtown

Cenovus

1,000,000

Western Canadian Place

Downtown

Husky

800,000

Nexen Tower

Downtown

Nexen

600,000

Eighth Avenue Place West

Downtown

Pembina Pipeline

305,000

707 – 5th Avenue SW

Downtown

Brion Energy (Dover)

250,000

Scotia Centre

Downtown

Harvest Energy Trust

142,000

Jones Lang LaSalle Canada Research

5
Ottawa-Gatineau
• The Ottawa-Gatineau market is increasingly tenant-favourable and can offer great value to new users of office space.
• Landlords are reacting to trends of increasing vacancy rates and federal government downsizing by offering attractive
incentives to existing and potential tenants.
• Tepid growth is expected in the next year as the tech sector slowly rebounds and major government investments in
infrastructure begin to ramp up.
• The overall vacancy rate decreased to 5.5 percent and there was 100,011 square feet of net new space leased by
tenants in quarter four.
Economy
• Federal government employment has shrunk to 141,600
employees from 163,100 employees a year earlier. Employment
in this sector is expected to decrease by another 1.4 percent in
2014. This was counterbalanced by an improvement in tech
sector employment. It raised to 56,200 employees from 40,200 a
year ago.
• The overall unemployment rate is expected to have risen from 6.4
percent to 6.5 percent by the end of the fourth quarter.
• Although there are many big construction projects in the city such
as the Confederation Line LRT, rehabilitation of the center block
at Parliament Hill and four major investments in retail, construction
values decreased by 40.0 percent in December from a year
earlier.
• Residential construction has slowed down due to an oversupply of
condominium units and a negative outlook for employment in the
area. The average sale price increased by 1.6 percent in 2013 but
the number of sales decreased by 3.3 percent
• Real GDP is expected to lag behind other major metropolitan
cities in 2014 and is expected to be roughly 1.8 percent.
Trends in Review and Outlook
• The fourth quarter continued to show emerging trends in the
Ottawa-Gatineau market.
• The downtown market has been experiencing some of the highest
vacancies in the past 10 years. The main factor is considered to
be the government and private business not leasing additional
space, but right-sizing their office area.
• Attractive incentives in the Downtown Core have had a negative
impact on older B and C buildings in the Core and in Centretown.
Vacancy rates are high for these buildings and should produce a
very tenant-favourable market for users looking for this type of
space.
• Ottawa East and Gatineau remained relatively strong in quarter
four. New purpose built buildings in each node built for the
government may produce vacancies in the future as the
government consolidates their workforce in these new buildings.
• The technology-centric Ottawa West has seen some improvement
in the fourth quarter. As technology employment numbers
improve, companies are growing into new spaces. This, plus
some very aggressive incentives offered by landlords, have
brought down the vacancy rate in these suburban nodes. Expect
balanced conditions if employment continues to improve at this
same pace.

National Office Report • Q4 2013

Property Clock

Suburban East
Downtown Submarket

Gatineau

Peaking
market

Rising
market

Falling
market

Ottawa-Gatineau
Suburban West

Bottoming
market

Market Vitals
Market

Vacancy (%)

Absorption (s.f.)

Net Asking Rate

Ottawa

5.5%

101,011

$15.34

Downtown

5.1%

-77,003

$19.02

Suburban East

4.0%

14,030

$13.96

Suburban West

7.6%

147,001

$13.30

Gatineau

1.8%

15,983

$13.50

Arrows represent change from prior quarter

Recent Deals
Address

Node

Tenant

Area (s.f.)

150 Elgin Street

Downtown Core

Shopify

100,000

350 Legget Drive

Ottawa West

Conversant/Mossaid

43,000

275 Slater Street

Downtown Core

MBM

12,000

55 Metcalfe Street

Downtown Core

Mercer

10,000

Jones Lang LaSalle Canada Research

6
Montréal
•
•
•
•
•

The GMA ended 2013 with a quarter of weak leasing momentum, adding only 23,979 square feet in total occupied area.
New supply caused the total vacancy rate across the GMA to push over 10.0 percent.
Total vacancy in the Downtown submarket inched above 7.0 percent for the first time in over two years.
Midtown experienced negative net absorption (118,948 square feet) for the first time this year.
Although the fourth quarter brought good news, the suburban submarket’s performance remained polarized in 2013.

Economy
• Improvements to Montreal’s labour market remained modest this year
with the GMA adding only 42,300 new jobs.
• Although employment grew by roughly 2.1 percent during this period,
unemployment increased by 20.0 basis points to reach 8.3 percent.
• The increase in unemployment was a result of the active population
growing by 52,200 people, outpacing employment growth by nearly
9,900 workers.
• However, during the same period the GMA’s office employment
sector faired significantly better with total employment growing by
approximately 2.8 percent and adding 11,600 jobs.
Trends in Review and Outlook
• The GMA ended 2013 with another quarter of weak leasing
momentum, adding a meager 23,979 square feet in total occupied
area, bringing total YTD net absorption to 248,815 square feet.
• Leasing activity resulted in a 0.26 percent increase in total occupied
area in 2013, which is significantly lower then the 1.0 percent and 1.3
percent growth rates experienced respectively over the last two
years.
• Market conditions Downtown continue to lag in relation to the rest of
the GMA. Similar to five out of the six previous quarters, Downtown
experienced negative absorption in the fourth quarter of 2013.
• Net absorption for the quarter amounted to negative 164,689 square
feet, helping vacancy inch above 7.0 percent for the first time in over
two years.
• Weak leasing activity for 2013 has caused total occupied area
Downtown to compress by nearly 0.9 percent or negative 440,911
square feet.
• The Midtown market was, for the first time in 2013, the worst
performing submarket across the GMA during the quarter with net
absorption amounting to negative 118,948 square feet.
• However this year, the Midtown market remained the best performing
submarket adding nearly 518,338 square feet of additional occupied
area, representing a 2.4 percent growth from 2012.
• Weak market conditions and new supply this quarter have caused
total vacancy to inch up another 2.1 percent, bringing the total
increase this year to 4.4 percent. Total vacancy in the Midtown
market currently stands at 14.1 percent.
• Suburban submarkets performance remained polarized in 2013. On
one side, the South Shore saw a 5.1 percent growth in total occupied
area and bringing total vacancy down to 9.5 percent.
• On the other hand, the East End ended the year with negative 74,361
square feet of net absorption, a 3.1 percent compression in total
occupied area, causing total vacancy to approach 15.0 percent.
• The two remaining suburban submarkets, Laval and West Island, saw
little real growth in 2013 and continue to display high vacancy rates at
13.3 percent and 16.5 percent respectively.
National Office Report • Q4 2013

Property Clock

Montréal
Midtown
Laval

South Shore

Peaking
market

Rising
market

Downtown (excluding core)
Downtown Core

Falling
market

East End

Bottoming
market

Saint-Laurent
(West Island)

West Island

Market Vitals
Market

Vacancy (%)

Absorption (s.f.)

Net Asking Rate

Downtown

7.0%

-164,689

$15.34

Midtown

14.1%

-118,948

$12.08

Laval

13.3%

20,584

$13.71

South Shore

9.5%

72,940

$13.29

East End

15.0%

14,570

$12.80

West Island

16.5%

199,522

$12.03

Arrows represent change from prior quarter

Recent Deals
Address

Node

Tenant

Area
(s.f.)

1155 René-Lévesque W.

Downtown Core

Ultramar

45,043

1501 McGill College

Downtown Core

Bank of Montreal

43,427

1002 Sherbrooke W.

Downtown Core

BCA Research

21,754

1050 Beaver Hall

Downtown Core

Alphanumeric Systems

15,841

Jones Lang LaSalle Canada Research

7
Downtown Toronto
• Forecasts for Ontario’s economy anticipate GDP growth of 2.6 percent in 2014 and 2.9 percent in 2015 with a
recovering U.S. economy and a stronger manufacturing sector.
• Downtown Toronto vacancy increased 0.9 percent from last quarter, ending the year at 6.5 percent.
• Leasing activity continued to remain subdued as tenants wait in anticipation for the arrival of new office developments.
Thus far, 750,000 square feet of new space has entered the market in Toronto’s office growth boom.

Economy
• Ontario’s economy is expected to accelerate over the next two years,
with RBC Economics predicting GDP growth of 2.6 percent in 2014
and 2.9 percent in 2015, citing a stronger manufacturing sector and
U.S. economy as catalysts.
• The 2013 GDP growth of 1.3 percent was largely attributable to the
vibrant service sector and limited by the weakness of the
manufacturing sector.
• The provincial unemployment rate is expected to drop 40 basis points
to 7.1 percent by the end of 2014 and a further 20 basis points to 6.9
percent by 2015.
Trends in Review and Outlook
• Conditions in the downtown core will soon see the effects of the 5.0
million square feet of new Class A office space currently under
construction. Eight developments are scheduled for completion with
dates ranging from late 2014 through 2017.
• The Mars Discovery Centre Phase II was completed and added to the
downtown inventory in the fourth quarter, the only construction
completed in 2013. This sciences-targeted development at 661
University Avenue added 750,000 square feet of space to the
Downtown Toronto supply and served as a large contributor to the 90
basis point increase in vacancy over the quarter with 400,000 square
feet of space still available in the building.
• Vacancy rates, as the new developments come to market, are
expected to continue to increase. In the Class A market, rates surged
130 basis points over the quarter to match downtown Toronto`s
overall 6.5 percent rate. In the Class B market, rates increased a
modest 30 basis points to 5.7 percent.
• Surprisingly, despite the increase in vacancy in quarter four, average
Class A and B rents showed small increases to $23.70 and $19.42
per square foot respectively. Through 2014 these rates are expected
to decrease as landlords seek to attract tenants in a diverse and high
supply market. Tenants could also see significant benefits in the form
of cash allowances and free rent periods.
• Downtown Toronto did experience positive absorption of 55,000
square feet in quarter four however this did little to offset the annual
negative absorption total of 667,859 square feet. In comparison, total
absorption for 2012 was positive 537,516 square feet.
• As the market moves towards more tenant-favorable conditions,
activity is expected to decline while some tenants wait to secure the
best possible rates. Lower rates in the Core will present tempting
relocation options for companies in the suburbs looking to consolidate
and secure a downtown location. An influx of new companies into
Downtown Toronto could mean competition for tenants already here
and the positive economic outlook with ideal leasing conditions will
make Toronto an attractive location for companies interested in
entering Canada.
National Office Report • Q4 2013

Property Clock
Downtown South

Downtown West

King & Dufferin

Peaking
market

Rising
market

Downtown Toronto
Financial Core

Falling
market

Bottoming
market

Downtown East
Downtown North

Market Vitals
Market

Vacancy (%)

Absorption (s.f.)

Net Asking Rate

Downtown East

7.4%

-17,474

$19.02

Downtown North

9.1%

144,430

$17.59

Downtown South

4.4%

-55,619

$19.55

Downtown West

6.1%

-172,389

$19.29

Financial Core

5.5%

138,458

$22.45

King & Dufferin

9.2%

18,406

$18.02

Arrows represent change from prior quarter

Recent Deals
Address

Node

Tenant

199 Bay Street

Financial Core

Stikeman Elliott LLP

199 Bay Street

Financial Core

Sentry Select

250 Yonge Street

Downtown North

LinkedIn

222 Bay Street

Financial Core

Microsoft

Area (s.f.)

46,615

26,142

Jones Lang LaSalle Canada Research

8
Suburban Toronto
• In quarter four, the vacancy rate was 13.6 percent in Toronto West, 7.6 percent in Toronto North and 11.7 percent in
Toronto East
• Toronto East saw 257,753 square feet of negative net absorption, followed by Toronto North with negative 87,315
square feet and Toronto West with 79,564 square feet.
• Don Mills & Eglinton was the weakest submarket with 361,2709 square feet of negative net absorption

Economy
• Ontario’s economy is expected to accelerate over the next two years.
RBC Economics predicts GDP growth of 2.6 percent in 2014 and 2.9
percent in 2015, citing a stronger manufacturing sector and U.S.
economy as catalysts.
• Ontario’s unemployment rate is expected to drop 40 basis points to
7.1 percent by the end of 2014 and a further 20 basis points to 6.9
percent by 2015.
• The 2013 GDP growth of 1.3 percent was largely attributable to the
vibrant service sector and limited by the weakness of the
manufacturing sector.
Trends in Review and Outlook
• Vacancy in the Greater Toronto Area (GTA) suburban market
continued to trend upwards reaching 12.0 percent in the fourth
quarter of 2013. From 2009 to 2012 vacancy in the suburban market
has ranged from 10.0 percent and 11.0 percent, which was up from
the low of 7.8 percent in 2008.
• The Airport Area was another weak submarket with 230,580 square
feet of negative net absorption, the majority of which came from the
Airport Corporate Centre.
• Toronto West leads the suburbs with 1.2 million square feet of
available sublet space, followed by the East with 0.5 million square
feet and the North with 0.3 million square feet.
• Meadowvale was the strongest submarket with almost 200,000
square feet of positive absorption.
• Although North Yonge remained one of the tightest suburban markets
in terms of vacancy, the vacancy rate jumped 170 basis points to 7.4
percent in quarter four.
• GTA West currently has 1.6 million square feet of office space
currently under construction, of which 661,536 square feet, or 42.2
percent, is available for lease.
• The vacancy rate in the GTA North increased by 130 basis points in
quarter four to 7.6 percent, which is the highest rate since Q1 2010.
This vacancy increase was primarily due to the completion of the two
new buildings in Vaughan, which totaled 105,000 square feet of new
office space.
• The P&G building at 4711 Yonge Street is one of the largest and
newest subleases to hit the market with approximately 100,000
square feet over five non-contiguous floors.
• The GTA West is the dominant sublease market with 53.0 percent of
sublease availabilities, followed by the GTA East with 31.0 percent
and the GTA North with 16.0 percent.
• Net rent remained relatively steady, with an net asking rate of $14.75
per square foot in the GTA West, $16.43 in the GTA North and
$12.64 in the GTA East.

National Office Report • Q4 2013

Property Clock

North Yonge

Markham

Peaking
market

Rising
market

Falling
market

Bottoming
market
Oakville/Burlington

Meadowvale

Airport Area

Mississauga City Centre
Suburban Toronto

Market Vitals
Market

Vacancy ( %)

Absorption (s.f.)

Net Asking Rate

Meadowvale

10.1%

199,088

$15.95

Airport Area

18.8%

-230,580

$13.52

Mississauga City
Centre

15.5%

-20,146

$16.44

North Yonge

7.4%

-140,791

$18.20

Markham

10.1%

-87,520

$14.91

Oakville/Burlington

15.7%

135,149

$16.48

Arrows represent change from prior quarter

Recent Deals
Address

Node

Tenant

Area
(s.f.)

2920 Matheson Blvd E

Airport Corporate
Centre

Bayer

134,000

7100 West Credit Ave.

Meadowvale

WorleyParsons

95,800

3450-3470 Superior Crt

Oakville

Amerisource Bergen

60,000

75 Courtney Park Dr W

Heartland

KAO Group

38,000

Jones Lang LaSalle Canada Research

9
Vancouver
• Metro Vancouver office vacancy increased by 170 basis points over the previous quarter to 8.9 percent.
• The Suburban market experienced its fifth consecutive quarter with negative net absorption, increasing the vacancy rate
to 12.8 percent.
• Downtown sublease availability increased from 1.8 percent to 2.4 percent, which is significantly higher than the 10 year
average availability rate of 1.3 percent.
• In comparison to other major markets, there continues to be limited options for multi-floor tenants in the Downtown Core
looking for Class A office space.
Economy
• British Columbia’s GDP growth is expected to be 2.7 percent in 2014,
followed by one of the highest in Canada in 2015 at 3.1 percent.
• The unemployment rate in Vancouver has dropped 40 basis points
over the previous year to 6.3 percent. This trend is on pace to
continue as real wage gains supported by low inflation and federal
shipbuilding contracts are expected to boost consumer spending and
job creation.
• Improving economic conditions in the United States combined with
strong international demand for B.C.’s natural resource industries
should increase consumer and business confidence moving into
2014.
Trends in Review and Outlook
• Demand for office space throughout Metro Vancouver remained
relatively slow during the fourth quarter.
• Metro Vancouver experienced year-to-date negative net absorption
for the first time since 2009, with approximately 300,000 square feet
of negative net absorption in the fourth quarter alone.
• As several larger Class A tenants in the Downtown Core prepare to
move into new buildings upon completion, significant backfill
opportunities remain available.
• Seven new Downtown office developments totaling approximately 2.7
million square feet are currently 43.0 percent pre-leased.
• The 445,000 square foot TELUS Garden is now 93.0 percent preleased following a significant pre-lease to a technology company.
• Law firm Miller Thomson became the first tenant to commit to Cadillac
Fairview’s redevelopment at 725 Granville and will take 48,000
square feet of a 75,000 square foot floor plate upon completion.
• Credit Suisse building 369,000 square foot LEED Platinum Standard
tower on Howe Street despite 0.0 percent pre-leased.
• Cadillac Fairview announced a new 350,000 square feet waterfront
office tower on their site next to The Station on West Cordova Street.
• Richmond vacancy increased by 60 basis points to 14.2 percent
during the fourth quarter, and the submarket is currently responsible
for 33.7 percent of all sublease space available in the suburban
market.
• Notable transactions in the fourth quarter include the Arts and Crafts
Building on Seymour Street for $15,200,000 ($434 p.s.f.) and 1770
West 7th Avenue in the Broadway Corridor for $32,625,000 ($436
p.s.f.)
• The Vancouver Periphery experienced limited volatility during the
fourth quarter of 2013. Year-to-date total net absorption was positive
6,757 square feet and office space availability only marginally
increased from 7.4 percent to 7.8 percent during the year. There was
72,527 square feet of new office supply added to the market during
the year, 100 percent of which has been fully leased.

National Office Report • Q4 2013

Property Clock
Downtown

Vancouver
Broadway Corridor

Peaking
market

Burnaby
New Westminster

Falling
market

Surrey
North Shore

Bottoming
market

Rising
market

Richmond
Langley

Market Vitals
Market

Vacancy (%)

Absorption (s.f.)

Net Asking Rate

Downtown

6.0%

-202,576

$23.58

Broadway Corridor

6.9%

-25,182

$20.88

Burnaby

9.1%

-181,453

$16.90

Richmond

14.2%

36,785

$14.59

Surrey

25.5%

-120,121

$16.13

North Shore

7.1%

-6,610

$19.67

New Westminster

7.5%

-8,216

$16.76

Langley

20.5%

24,641

$17.87

Arrows represent change from prior quarter

Recent Deals
Address

Node

Tenant

Area
(s.f.)

520 West Georgia Street

Downtown

Confidential Tenant

156,000

550 Burrard Street

Downtown

Teekay Corporation

52,900

1700 West 75th Avenue

Broadway Corridor

Canfor

50,000

10271 Shellbridge Way

Richmond

Top Producer

48,600

Jones Lang LaSalle Canada Research

10
Canadian Office Market Statistics
Key Office Markets

Fourth Quarter
2013

Inventory (s.f.)

Quarterly total
net absorption
(s.f., including
subleases)

YTD total net
absorption
(s.f., including
subleases)

YTD total net
absorption
( % of
inventory)

Total Vacancy
( %)

Average Gross
marketed rent
($ PSF)

Under
Construction
and Committed
(s.f.)

18,492,394

427,998

727,283

3.9%

6.4%

$21.70

173,829

2,309,170

4,551

26,357

1.4%

13.4%

$26.90

0

44,859,518

100,011

428,189

1.0%

5.5%

$31.22

1,446,595

9,372,736

490

393,653

4.2%

3.5%

$50.08

930,598

63,784,522

1,290,511

-102,708

-0.2%

7.7%

$45.21

7,024,021

28,896,317

-68,664

65,941

0.2%

2.9%

$55.44

5,131,839

23,228,350

90,522

167,850

0.7%

7.5%

$33.84

338,926

11,023,249

85,197

198,637

1.8%

6.1%

$39.28

0

52,247,799

-513,873

-308,558

-0.6%

8.9%

$38.03

4,248,557

13,336,532

-179,706

-284,146

-2.1%

5.3%

$55.76

1,937,977

171,653,463

-252,192

-1,002,574

-0.6%

9.2%

$29.48

7,084,489

45,120,320

111,181

-297,699

-0.7%

6.5%

$47.43

5,108,908

10,642,786

12,498

86,144

0.81%

6.2%

$23.71

85,000

3,477,581

10,618

54,771

1.6%

3.5%

$30.65

85,000

92,619,056

23,979

248,815

0.3%

10.2%

$26.55

2,750,545

23,124,284

-185,934

-291,385

-1.3%

7.5%

$40.57

1,226,923

9,738,479

310,408

-91,444

-0.8%

8.7%

$27.32

307,126

1,375,075

114,955

-3,664

-0.3%

8.4%

$34.14

280,126

487,266,367

1,489,862

-1,226,221

0.0%

8.5%

$31.80*

23,459,088

Quebec City
Downtown 'A'
Ottawa
Downtown 'A'
Calgary
Downtown 'A'
Edmonton
Downtown ‘A’
Vancouver
Downtown 'A'
Toronto
Downtown 'A'
Winnipeg
Downtown 'A'
Montreal
Downtown 'A'
Halifax
Downtown ‘A’

Canadian major
market total

*Weighted Average
Source: Altus Insite, Jones Lang LaSalle Research

National Office Report • Q4 2013

Jones Lang LaSalle Canada Research

11
About Jones Lang LaSalle
Jones Lang LaSalle (NYSE:JLL) is a professional services and investment management firm offering specialized real estate services to clients seeking increased
value by owning, occupying and investing in real estate. With annual revenue of $3.9 billion, Jones Lang LaSalle operates in 70 countries from more than 1,000
locations worldwide. On behalf of its clients, the firm provides management and real estate outsourcing services to a property portfolio of 2.6 billion square feet and
completed $63 billion in sales, acquisitions and finance transactions in 2012. Its investment management business, LaSalle Investment Management, has $47.7
billion of real estate assets under management. For further information, visit www.jll.com.

About Jones Lang LaSalle Research
Jones Lang LaSalle’s research team delivers intelligence, analysis, and insight through market-leading reports and services that illuminate today’s commercial real
estate dynamics and identify tomorrow’s challenges and opportunities. Our 400 professional researchers track and analyze economic and property trends and
forecast future conditions in over 60 countries, producing unrivalled local and global perspectives. Our research and expertise, fueled by real-time information and
innovative thinking around the world, creates a competitive advantage for our clients and drives successful strategies and optimal real estate decisions.

TORONTO
199 Bay Street, Suite 4610
Toronto, Ontario M5L 1G3
Tel: +1 416 304 6000
Fax: +1 416 304 6001

MISSISSAUGA
110 Matheson Blvd W, Suite 107
Mississauga, ON L5R 4G7
Tel +1 905 502 6116
Fax +1 905 502 5466

MONTRÉAL
1, Place Ville Marie, Suite 2121
Montréal, QC H3B 2C6
Tel +1 514 849 8849
Fax +1 514 849 6919

OTTAWA
275 Slater Street, Suite 933
Ottawa, ON K1P 5H9
Tel +1 613 288 2272
Fax +1 613 688 3010

OFFICE LOCATIONS

CALGARY
300, 129 – 8th Avenue SW
Calgary , AB T2P 1B4
Tel +1 403 456 2104
Fax +1 587 880 9966

VANCOUVER
21st Floor, 400 Burrard Street
Vancouver, BC V6C 3A6
Tel +1 604 998 6001
Fax +1 604 998 6018

For more information please contact:
Thomas Forr
National Research Coordinator
+1 416 304 6047
thomas.forr@am.jll.com

www.joneslanglasalle.ca/research
www.joneslanglasalle.ca

© 2014 Jones Lang LaSalle IP, Inc. All rights reserved. No part of this publication may be reproduced by any means, whether graphically, electronically, mechanically or otherwise howsoever, including without
limitation photocopying and recording on magnetic tape, or included in any information store and/or retrieval system without prior written permission of Jones Lang LaSalle. The information contained in this document
has been compiled from sources believed to be reliable. Jones Lang LaSalle or any of their affiliates accept no liability or responsibility for the accuracy or completeness of the information contained herein and no
reliance should be placed on the information contained in this document.
National Office Report • Q4 2013
Jones Lang LaSalle Canada Research

12

Contenu connexe

Tendances

Colliers Toronto office market report 2015 q3
Colliers Toronto office market report 2015 q3Colliers Toronto office market report 2015 q3
Colliers Toronto office market report 2015 q3Chris Fyvie
 
Q3 2015 Industrial Brief
Q3 2015 Industrial BriefQ3 2015 Industrial Brief
Q3 2015 Industrial BriefRyan Searle
 
C&W MARKETBEAT- U.S. Office Q4 2018
C&W MARKETBEAT- U.S. Office Q4 2018C&W MARKETBEAT- U.S. Office Q4 2018
C&W MARKETBEAT- U.S. Office Q4 2018Guy Masse
 
Office fall2010 final
Office fall2010 finalOffice fall2010 final
Office fall2010 finalChris Fyvie
 
National Dashboard Report | Office - Metro Areas with Population < 1M
National Dashboard Report | Office - Metro Areas with Population < 1MNational Dashboard Report | Office - Metro Areas with Population < 1M
National Dashboard Report | Office - Metro Areas with Population < 1MDarren Shaw, SIOR
 
JLL Columbus Industrial Outlook - Q4 2020
JLL Columbus Industrial Outlook - Q4 2020JLL Columbus Industrial Outlook - Q4 2020
JLL Columbus Industrial Outlook - Q4 2020Emma Gresky
 
Q2 2016 industrial brief 7 29-16 final
Q2 2016 industrial brief 7 29-16 finalQ2 2016 industrial brief 7 29-16 final
Q2 2016 industrial brief 7 29-16 finalJustin B. Smith
 
New Homes Residential View - Autumn/Winter 2016
New Homes Residential View - Autumn/Winter 2016New Homes Residential View - Autumn/Winter 2016
New Homes Residential View - Autumn/Winter 2016Lee Layton
 
Atlanta Office Sector Report (Q2 2016)
Atlanta Office Sector Report (Q2 2016)Atlanta Office Sector Report (Q2 2016)
Atlanta Office Sector Report (Q2 2016)Savills Studley
 
Toronto_North_and_East_Market_Report_Q3_2015
Toronto_North_and_East_Market_Report_Q3_2015Toronto_North_and_East_Market_Report_Q3_2015
Toronto_North_and_East_Market_Report_Q3_2015Brook Stachel
 
2016 office condo report
2016 office condo report2016 office condo report
2016 office condo reportChris Fyvie
 
Carter Jonas New Homes Residential View - Winter 2016
Carter Jonas New Homes Residential View - Winter 2016Carter Jonas New Homes Residential View - Winter 2016
Carter Jonas New Homes Residential View - Winter 2016Lee Layton
 
Office Market Report Q1 2015
Office Market Report Q1 2015Office Market Report Q1 2015
Office Market Report Q1 2015Peter Ikeda
 

Tendances (20)

Colliers Toronto office market report 2015 q3
Colliers Toronto office market report 2015 q3Colliers Toronto office market report 2015 q3
Colliers Toronto office market report 2015 q3
 
Q3 2020 | Houston Office | Research & Forecast Report
Q3 2020 | Houston Office | Research & Forecast ReportQ3 2020 | Houston Office | Research & Forecast Report
Q3 2020 | Houston Office | Research & Forecast Report
 
Q3 2015 Industrial Brief
Q3 2015 Industrial BriefQ3 2015 Industrial Brief
Q3 2015 Industrial Brief
 
C&W MARKETBEAT- U.S. Office Q4 2018
C&W MARKETBEAT- U.S. Office Q4 2018C&W MARKETBEAT- U.S. Office Q4 2018
C&W MARKETBEAT- U.S. Office Q4 2018
 
Office fall2010 final
Office fall2010 finalOffice fall2010 final
Office fall2010 final
 
National Dashboard Report | Office - Metro Areas with Population < 1M
National Dashboard Report | Office - Metro Areas with Population < 1MNational Dashboard Report | Office - Metro Areas with Population < 1M
National Dashboard Report | Office - Metro Areas with Population < 1M
 
282 month in-review_june_2016
282 month in-review_june_2016282 month in-review_june_2016
282 month in-review_june_2016
 
JLL Columbus Industrial Outlook - Q4 2020
JLL Columbus Industrial Outlook - Q4 2020JLL Columbus Industrial Outlook - Q4 2020
JLL Columbus Industrial Outlook - Q4 2020
 
Q4 2020 | Houston Office | Research & Forecast Report
Q4 2020 | Houston Office | Research & Forecast ReportQ4 2020 | Houston Office | Research & Forecast Report
Q4 2020 | Houston Office | Research & Forecast Report
 
Q2 2016 industrial brief 7 29-16 final
Q2 2016 industrial brief 7 29-16 finalQ2 2016 industrial brief 7 29-16 final
Q2 2016 industrial brief 7 29-16 final
 
Q3 2013 Houston Office Market Research Report
Q3 2013 Houston Office Market Research ReportQ3 2013 Houston Office Market Research Report
Q3 2013 Houston Office Market Research Report
 
New Homes Residential View - Autumn/Winter 2016
New Homes Residential View - Autumn/Winter 2016New Homes Residential View - Autumn/Winter 2016
New Homes Residential View - Autumn/Winter 2016
 
HCMC Market Insights Q32015 (English version)
HCMC Market Insights Q32015 (English version)HCMC Market Insights Q32015 (English version)
HCMC Market Insights Q32015 (English version)
 
Atlanta Office Sector Report (Q2 2016)
Atlanta Office Sector Report (Q2 2016)Atlanta Office Sector Report (Q2 2016)
Atlanta Office Sector Report (Q2 2016)
 
Q3 2020 | Fort Bend | Submarket Snapshot
Q3 2020 | Fort Bend | Submarket SnapshotQ3 2020 | Fort Bend | Submarket Snapshot
Q3 2020 | Fort Bend | Submarket Snapshot
 
Toronto_North_and_East_Market_Report_Q3_2015
Toronto_North_and_East_Market_Report_Q3_2015Toronto_North_and_East_Market_Report_Q3_2015
Toronto_North_and_East_Market_Report_Q3_2015
 
Q2 2020 | E Fort Bend Commercial Real Estate Trends
Q2 2020 | E Fort Bend Commercial Real Estate TrendsQ2 2020 | E Fort Bend Commercial Real Estate Trends
Q2 2020 | E Fort Bend Commercial Real Estate Trends
 
2016 office condo report
2016 office condo report2016 office condo report
2016 office condo report
 
Carter Jonas New Homes Residential View - Winter 2016
Carter Jonas New Homes Residential View - Winter 2016Carter Jonas New Homes Residential View - Winter 2016
Carter Jonas New Homes Residential View - Winter 2016
 
Office Market Report Q1 2015
Office Market Report Q1 2015Office Market Report Q1 2015
Office Market Report Q1 2015
 

Similaire à Jll commercial real estate market report toronto 2014

Toronto office market report q1 2016
Toronto office market report q1 2016Toronto office market report q1 2016
Toronto office market report q1 2016Chris Fyvie
 
Broward County Office Outlook - Q4 2018
Broward County Office Outlook - Q4 2018Broward County Office Outlook - Q4 2018
Broward County Office Outlook - Q4 2018JLL Florida
 
Kolkata office market overview jan 2015
Kolkata office market overview jan 2015Kolkata office market overview jan 2015
Kolkata office market overview jan 2015Surabhi Arora, MRICS
 
Kolkata Office Market Overview Jan 2015
Kolkata Office Market Overview Jan 2015Kolkata Office Market Overview Jan 2015
Kolkata Office Market Overview Jan 2015Sachin Sharma
 
JLL City Report Nairobi Kenya - April 2016
JLL City Report Nairobi Kenya - April 2016JLL City Report Nairobi Kenya - April 2016
JLL City Report Nairobi Kenya - April 2016Fadheelat Noor Mohamed
 
JLL Grand Rapids Office Insight - Fall 2016
JLL Grand Rapids Office Insight - Fall 2016JLL Grand Rapids Office Insight - Fall 2016
JLL Grand Rapids Office Insight - Fall 2016Aaron Moore
 
Savills Prime Office Cost Index Q1 2017
Savills Prime Office Cost Index Q1 2017Savills Prime Office Cost Index Q1 2017
Savills Prime Office Cost Index Q1 2017Will Butler
 
2017 Law Firm office market overview
2017 Law Firm office market overview2017 Law Firm office market overview
2017 Law Firm office market overviewJLL
 
Cushman & Wakefield Toronto Americas Marketbeat Office Q1 2019
Cushman & Wakefield Toronto Americas Marketbeat Office Q1 2019 Cushman & Wakefield Toronto Americas Marketbeat Office Q1 2019
Cushman & Wakefield Toronto Americas Marketbeat Office Q1 2019 Guy Masse
 
JLL Cleveland Office Outlook: Q3 2017
JLL Cleveland Office Outlook: Q3 2017JLL Cleveland Office Outlook: Q3 2017
JLL Cleveland Office Outlook: Q3 2017Andrew Batson
 
U.S. office market statistics (Q4 2014) and 2015 outlook
U.S. office market statistics (Q4 2014) and 2015 outlook U.S. office market statistics (Q4 2014) and 2015 outlook
U.S. office market statistics (Q4 2014) and 2015 outlook JLL
 
U.S. Office market statistics, trends and outlook: Q3 2015
U.S. Office market statistics, trends and outlook: Q3 2015U.S. Office market statistics, trends and outlook: Q3 2015
U.S. Office market statistics, trends and outlook: Q3 2015JLL
 
JLL Cleveland Office Outlook: Q1 2018
JLL Cleveland Office Outlook: Q1 2018JLL Cleveland Office Outlook: Q1 2018
JLL Cleveland Office Outlook: Q1 2018Andrew Batson
 
Cw global office forecast 2014-2015
Cw global office forecast 2014-2015Cw global office forecast 2014-2015
Cw global office forecast 2014-2015Guy Masse
 

Similaire à Jll commercial real estate market report toronto 2014 (20)

Toronto office market report q1 2016
Toronto office market report q1 2016Toronto office market report q1 2016
Toronto office market report q1 2016
 
Broward County Office Outlook - Q4 2018
Broward County Office Outlook - Q4 2018Broward County Office Outlook - Q4 2018
Broward County Office Outlook - Q4 2018
 
Kolkata office market overview jan 2015
Kolkata office market overview jan 2015Kolkata office market overview jan 2015
Kolkata office market overview jan 2015
 
Kolkata Office Market Overview Jan 2015
Kolkata Office Market Overview Jan 2015Kolkata Office Market Overview Jan 2015
Kolkata Office Market Overview Jan 2015
 
Office Insight Q3 2015-Grand Rapids
Office Insight Q3 2015-Grand RapidsOffice Insight Q3 2015-Grand Rapids
Office Insight Q3 2015-Grand Rapids
 
Bogotá, 2014 Q4 - JLL
Bogotá, 2014 Q4 - JLLBogotá, 2014 Q4 - JLL
Bogotá, 2014 Q4 - JLL
 
JLL City Report Nairobi Kenya - April 2016
JLL City Report Nairobi Kenya - April 2016JLL City Report Nairobi Kenya - April 2016
JLL City Report Nairobi Kenya - April 2016
 
JLL Grand Rapids Office Insight - Fall 2016
JLL Grand Rapids Office Insight - Fall 2016JLL Grand Rapids Office Insight - Fall 2016
JLL Grand Rapids Office Insight - Fall 2016
 
Savills Prime Office Cost Index Q1 2017
Savills Prime Office Cost Index Q1 2017Savills Prime Office Cost Index Q1 2017
Savills Prime Office Cost Index Q1 2017
 
2017 Law Firm office market overview
2017 Law Firm office market overview2017 Law Firm office market overview
2017 Law Firm office market overview
 
Los_Angeles_4Q16
Los_Angeles_4Q16Los_Angeles_4Q16
Los_Angeles_4Q16
 
Cushman & Wakefield Toronto Americas Marketbeat Office Q1 2019
Cushman & Wakefield Toronto Americas Marketbeat Office Q1 2019 Cushman & Wakefield Toronto Americas Marketbeat Office Q1 2019
Cushman & Wakefield Toronto Americas Marketbeat Office Q1 2019
 
Houston Sublease
Houston SubleaseHouston Sublease
Houston Sublease
 
JLL Cleveland Office Outlook: Q3 2017
JLL Cleveland Office Outlook: Q3 2017JLL Cleveland Office Outlook: Q3 2017
JLL Cleveland Office Outlook: Q3 2017
 
U.S. office market statistics (Q4 2014) and 2015 outlook
U.S. office market statistics (Q4 2014) and 2015 outlook U.S. office market statistics (Q4 2014) and 2015 outlook
U.S. office market statistics (Q4 2014) and 2015 outlook
 
U.S. Office market statistics, trends and outlook: Q3 2015
U.S. Office market statistics, trends and outlook: Q3 2015U.S. Office market statistics, trends and outlook: Q3 2015
U.S. Office market statistics, trends and outlook: Q3 2015
 
JLL Cleveland Office Outlook: Q1 2018
JLL Cleveland Office Outlook: Q1 2018JLL Cleveland Office Outlook: Q1 2018
JLL Cleveland Office Outlook: Q1 2018
 
Q3 office
Q3 officeQ3 office
Q3 office
 
HCMC Market Insights Q42015 (EN)
HCMC Market Insights Q42015 (EN)HCMC Market Insights Q42015 (EN)
HCMC Market Insights Q42015 (EN)
 
Cw global office forecast 2014-2015
Cw global office forecast 2014-2015Cw global office forecast 2014-2015
Cw global office forecast 2014-2015
 

Plus de Chris Fyvie

Colliers canada national market snapshot 2020 q4
Colliers canada national market snapshot 2020 q4Colliers canada national market snapshot 2020 q4
Colliers canada national market snapshot 2020 q4Chris Fyvie
 
Colliers GTA Office Statistics Q1 2017
Colliers GTA Office Statistics Q1 2017Colliers GTA Office Statistics Q1 2017
Colliers GTA Office Statistics Q1 2017Chris Fyvie
 
Downtown toronto office survey package august 25 2016
Downtown toronto office survey package   august 25 2016Downtown toronto office survey package   august 25 2016
Downtown toronto office survey package august 25 2016Chris Fyvie
 
WTF Properties - Toronto Office Space July availability report
WTF Properties - Toronto Office Space July availability reportWTF Properties - Toronto Office Space July availability report
WTF Properties - Toronto Office Space July availability reportChris Fyvie
 
Plug in to peak productivity - Colliers Spark Report
Plug in to peak productivity - Colliers Spark ReportPlug in to peak productivity - Colliers Spark Report
Plug in to peak productivity - Colliers Spark ReportChris Fyvie
 
Lennard commercial office space downtown toronto
Lennard commercial office space downtown torontoLennard commercial office space downtown toronto
Lennard commercial office space downtown torontoChris Fyvie
 
Q1 2016 cresa market report
Q1 2016 cresa market reportQ1 2016 cresa market report
Q1 2016 cresa market reportChris Fyvie
 
Colliers Gta office market statistics q1 2016
Colliers Gta office market statistics q1 2016Colliers Gta office market statistics q1 2016
Colliers Gta office market statistics q1 2016Chris Fyvie
 
Cadillac Fairview Office Vacancy - May 2016
Cadillac Fairview Office Vacancy - May 2016Cadillac Fairview Office Vacancy - May 2016
Cadillac Fairview Office Vacancy - May 2016Chris Fyvie
 
Security deposit insecurity - Daoust Vukovich LLP
Security deposit insecurity - Daoust Vukovich LLPSecurity deposit insecurity - Daoust Vukovich LLP
Security deposit insecurity - Daoust Vukovich LLPChris Fyvie
 
Costs to Furnish Toronto Office Space
Costs to Furnish Toronto Office SpaceCosts to Furnish Toronto Office Space
Costs to Furnish Toronto Office SpaceChris Fyvie
 
Audio Visual Construction Costs
Audio Visual Construction CostsAudio Visual Construction Costs
Audio Visual Construction CostsChris Fyvie
 
Office Space Construction Costs
Office Space Construction CostsOffice Space Construction Costs
Office Space Construction CostsChris Fyvie
 
Toronto Innovate Office Spaces
Toronto Innovate Office SpacesToronto Innovate Office Spaces
Toronto Innovate Office SpacesChris Fyvie
 
Cadillac fairview gta reports-nov_2015
Cadillac fairview   gta reports-nov_2015Cadillac fairview   gta reports-nov_2015
Cadillac fairview gta reports-nov_2015Chris Fyvie
 
Ashlar november-2015-availability-report
Ashlar november-2015-availability-reportAshlar november-2015-availability-report
Ashlar november-2015-availability-reportChris Fyvie
 
#Toronto Businesses now demanding their offices be close to accessible, rapid...
#Toronto Businesses now demanding their offices be close to accessible, rapid...#Toronto Businesses now demanding their offices be close to accessible, rapid...
#Toronto Businesses now demanding their offices be close to accessible, rapid...Chris Fyvie
 
Q2 15 office dashboard - midtown - yonge bloor #cre
Q2 15 office dashboard - midtown - yonge bloor #creQ2 15 office dashboard - midtown - yonge bloor #cre
Q2 15 office dashboard - midtown - yonge bloor #creChris Fyvie
 
Toronto Bloor Street #CRE #officeleasing - September 2015
Toronto Bloor Street #CRE #officeleasing - September 2015Toronto Bloor Street #CRE #officeleasing - September 2015
Toronto Bloor Street #CRE #officeleasing - September 2015Chris Fyvie
 
North American Commercial Real Estate Report
North American Commercial Real Estate ReportNorth American Commercial Real Estate Report
North American Commercial Real Estate ReportChris Fyvie
 

Plus de Chris Fyvie (20)

Colliers canada national market snapshot 2020 q4
Colliers canada national market snapshot 2020 q4Colliers canada national market snapshot 2020 q4
Colliers canada national market snapshot 2020 q4
 
Colliers GTA Office Statistics Q1 2017
Colliers GTA Office Statistics Q1 2017Colliers GTA Office Statistics Q1 2017
Colliers GTA Office Statistics Q1 2017
 
Downtown toronto office survey package august 25 2016
Downtown toronto office survey package   august 25 2016Downtown toronto office survey package   august 25 2016
Downtown toronto office survey package august 25 2016
 
WTF Properties - Toronto Office Space July availability report
WTF Properties - Toronto Office Space July availability reportWTF Properties - Toronto Office Space July availability report
WTF Properties - Toronto Office Space July availability report
 
Plug in to peak productivity - Colliers Spark Report
Plug in to peak productivity - Colliers Spark ReportPlug in to peak productivity - Colliers Spark Report
Plug in to peak productivity - Colliers Spark Report
 
Lennard commercial office space downtown toronto
Lennard commercial office space downtown torontoLennard commercial office space downtown toronto
Lennard commercial office space downtown toronto
 
Q1 2016 cresa market report
Q1 2016 cresa market reportQ1 2016 cresa market report
Q1 2016 cresa market report
 
Colliers Gta office market statistics q1 2016
Colliers Gta office market statistics q1 2016Colliers Gta office market statistics q1 2016
Colliers Gta office market statistics q1 2016
 
Cadillac Fairview Office Vacancy - May 2016
Cadillac Fairview Office Vacancy - May 2016Cadillac Fairview Office Vacancy - May 2016
Cadillac Fairview Office Vacancy - May 2016
 
Security deposit insecurity - Daoust Vukovich LLP
Security deposit insecurity - Daoust Vukovich LLPSecurity deposit insecurity - Daoust Vukovich LLP
Security deposit insecurity - Daoust Vukovich LLP
 
Costs to Furnish Toronto Office Space
Costs to Furnish Toronto Office SpaceCosts to Furnish Toronto Office Space
Costs to Furnish Toronto Office Space
 
Audio Visual Construction Costs
Audio Visual Construction CostsAudio Visual Construction Costs
Audio Visual Construction Costs
 
Office Space Construction Costs
Office Space Construction CostsOffice Space Construction Costs
Office Space Construction Costs
 
Toronto Innovate Office Spaces
Toronto Innovate Office SpacesToronto Innovate Office Spaces
Toronto Innovate Office Spaces
 
Cadillac fairview gta reports-nov_2015
Cadillac fairview   gta reports-nov_2015Cadillac fairview   gta reports-nov_2015
Cadillac fairview gta reports-nov_2015
 
Ashlar november-2015-availability-report
Ashlar november-2015-availability-reportAshlar november-2015-availability-report
Ashlar november-2015-availability-report
 
#Toronto Businesses now demanding their offices be close to accessible, rapid...
#Toronto Businesses now demanding their offices be close to accessible, rapid...#Toronto Businesses now demanding their offices be close to accessible, rapid...
#Toronto Businesses now demanding their offices be close to accessible, rapid...
 
Q2 15 office dashboard - midtown - yonge bloor #cre
Q2 15 office dashboard - midtown - yonge bloor #creQ2 15 office dashboard - midtown - yonge bloor #cre
Q2 15 office dashboard - midtown - yonge bloor #cre
 
Toronto Bloor Street #CRE #officeleasing - September 2015
Toronto Bloor Street #CRE #officeleasing - September 2015Toronto Bloor Street #CRE #officeleasing - September 2015
Toronto Bloor Street #CRE #officeleasing - September 2015
 
North American Commercial Real Estate Report
North American Commercial Real Estate ReportNorth American Commercial Real Estate Report
North American Commercial Real Estate Report
 

Dernier

Rustomjee The Panorama At Pali Hill, Bandra West, Mumbai - Brochure.pdf
Rustomjee The Panorama At Pali Hill, Bandra West, Mumbai - Brochure.pdfRustomjee The Panorama At Pali Hill, Bandra West, Mumbai - Brochure.pdf
Rustomjee The Panorama At Pali Hill, Bandra West, Mumbai - Brochure.pdfmonikasharma630
 
Pride Wonderland Dhanori Pune Brochure.pdf
Pride Wonderland Dhanori Pune Brochure.pdfPride Wonderland Dhanori Pune Brochure.pdf
Pride Wonderland Dhanori Pune Brochure.pdfabbu831446
 
The Importance of Parks and Recreation Areas in Reliaable Developers Plot Dev...
The Importance of Parks and Recreation Areas in Reliaable Developers Plot Dev...The Importance of Parks and Recreation Areas in Reliaable Developers Plot Dev...
The Importance of Parks and Recreation Areas in Reliaable Developers Plot Dev...Reliaable Developers
 
Call Girls in Inderpuri Delhi 💯Call Us 🔝8264348440🔝
Call Girls in Inderpuri Delhi 💯Call Us 🔝8264348440🔝Call Girls in Inderpuri Delhi 💯Call Us 🔝8264348440🔝
Call Girls in Inderpuri Delhi 💯Call Us 🔝8264348440🔝soniya singh
 
Choose Noida's Leading Architect
Choose    Noida's    Leading   ArchitectChoose    Noida's    Leading   Architect
Choose Noida's Leading ArchitectMM Design Studio
 
Managed Farmland Brochures to get more in
Managed Farmland Brochures to get more inManaged Farmland Brochures to get more in
Managed Farmland Brochures to get more inknoxdigital1
 
Kolte Patil Universe Hinjewadi Pune Brochure.pdf
Kolte Patil Universe Hinjewadi Pune Brochure.pdfKolte Patil Universe Hinjewadi Pune Brochure.pdf
Kolte Patil Universe Hinjewadi Pune Brochure.pdfPrachiRudram
 
Ebullient Investments Limited specializes in Building contractor
Ebullient Investments Limited specializes in Building contractorEbullient Investments Limited specializes in Building contractor
Ebullient Investments Limited specializes in Building contractorEbullient Investments Limited
 
Ryan Mahoney - How Property Technology Is Altering the Real Estate Market
Ryan Mahoney - How Property Technology Is Altering the Real Estate MarketRyan Mahoney - How Property Technology Is Altering the Real Estate Market
Ryan Mahoney - How Property Technology Is Altering the Real Estate MarketRyan Mahoney
 
A Brief History of Intangibles in Ad Valorem Taxation.pdf
A Brief History of Intangibles in Ad Valorem Taxation.pdfA Brief History of Intangibles in Ad Valorem Taxation.pdf
A Brief History of Intangibles in Ad Valorem Taxation.pdfTim Wilmath
 
Experion Elements Sector 45 Noida_Brochure.pdf.pdf
Experion Elements Sector 45 Noida_Brochure.pdf.pdfExperion Elements Sector 45 Noida_Brochure.pdf.pdf
Experion Elements Sector 45 Noida_Brochure.pdf.pdfkratirudram
 
8 Key Elements for Comfortable Farmland Living
8 Key Elements for Comfortable Farmland Living 8 Key Elements for Comfortable Farmland Living
8 Key Elements for Comfortable Farmland Living Farmland Bazaar
 
Call Girls In Peeragarhi, Delhi↫8447779280↬Call Girls in Peeragarhi Delhi NCR
Call Girls In Peeragarhi, Delhi↫8447779280↬Call Girls in Peeragarhi Delhi NCRCall Girls In Peeragarhi, Delhi↫8447779280↬Call Girls in Peeragarhi Delhi NCR
Call Girls In Peeragarhi, Delhi↫8447779280↬Call Girls in Peeragarhi Delhi NCRasmaqueen5
 
Sobha Aranya Sector 80 Gurgaon E- Brochure.pdf
Sobha Aranya Sector 80 Gurgaon E- Brochure.pdfSobha Aranya Sector 80 Gurgaon E- Brochure.pdf
Sobha Aranya Sector 80 Gurgaon E- Brochure.pdffaheemali990101
 
83770-87607 ۞Call Girls In Near The Park Hotel (Cp) Delhi
83770-87607 ۞Call Girls In Near The Park Hotel (Cp) Delhi83770-87607 ۞Call Girls In Near The Park Hotel (Cp) Delhi
83770-87607 ۞Call Girls In Near The Park Hotel (Cp) Delhidollysharma2066
 
MADHUGIRI FARM LAND BROCHURES (11)_compressed (1).pdf
MADHUGIRI FARM LAND BROCHURES (11)_compressed (1).pdfMADHUGIRI FARM LAND BROCHURES (11)_compressed (1).pdf
MADHUGIRI FARM LAND BROCHURES (11)_compressed (1).pdfknoxdigital1
 
Kohinoor Hinjewadi Phase 2 Pune | E-Brochure
Kohinoor Hinjewadi Phase 2 Pune | E-BrochureKohinoor Hinjewadi Phase 2 Pune | E-Brochure
Kohinoor Hinjewadi Phase 2 Pune | E-BrochureOmanaConsulting
 
Ajmera Prive at Juhu, Mumbai E-Brochure.pdf
Ajmera Prive at Juhu, Mumbai  E-Brochure.pdfAjmera Prive at Juhu, Mumbai  E-Brochure.pdf
Ajmera Prive at Juhu, Mumbai E-Brochure.pdfManishSaxena95
 
LCAR Unit 22 - Leasing and Property Management - 14th Edition Revised.pptx
LCAR Unit 22 - Leasing and Property Management - 14th Edition Revised.pptxLCAR Unit 22 - Leasing and Property Management - 14th Edition Revised.pptx
LCAR Unit 22 - Leasing and Property Management - 14th Edition Revised.pptxTom Blefko
 

Dernier (20)

Rustomjee The Panorama At Pali Hill, Bandra West, Mumbai - Brochure.pdf
Rustomjee The Panorama At Pali Hill, Bandra West, Mumbai - Brochure.pdfRustomjee The Panorama At Pali Hill, Bandra West, Mumbai - Brochure.pdf
Rustomjee The Panorama At Pali Hill, Bandra West, Mumbai - Brochure.pdf
 
Pride Wonderland Dhanori Pune Brochure.pdf
Pride Wonderland Dhanori Pune Brochure.pdfPride Wonderland Dhanori Pune Brochure.pdf
Pride Wonderland Dhanori Pune Brochure.pdf
 
The Importance of Parks and Recreation Areas in Reliaable Developers Plot Dev...
The Importance of Parks and Recreation Areas in Reliaable Developers Plot Dev...The Importance of Parks and Recreation Areas in Reliaable Developers Plot Dev...
The Importance of Parks and Recreation Areas in Reliaable Developers Plot Dev...
 
Call Girls in Inderpuri Delhi 💯Call Us 🔝8264348440🔝
Call Girls in Inderpuri Delhi 💯Call Us 🔝8264348440🔝Call Girls in Inderpuri Delhi 💯Call Us 🔝8264348440🔝
Call Girls in Inderpuri Delhi 💯Call Us 🔝8264348440🔝
 
Choose Noida's Leading Architect
Choose    Noida's    Leading   ArchitectChoose    Noida's    Leading   Architect
Choose Noida's Leading Architect
 
Managed Farmland Brochures to get more in
Managed Farmland Brochures to get more inManaged Farmland Brochures to get more in
Managed Farmland Brochures to get more in
 
Kolte Patil Universe Hinjewadi Pune Brochure.pdf
Kolte Patil Universe Hinjewadi Pune Brochure.pdfKolte Patil Universe Hinjewadi Pune Brochure.pdf
Kolte Patil Universe Hinjewadi Pune Brochure.pdf
 
Ebullient Investments Limited specializes in Building contractor
Ebullient Investments Limited specializes in Building contractorEbullient Investments Limited specializes in Building contractor
Ebullient Investments Limited specializes in Building contractor
 
Ryan Mahoney - How Property Technology Is Altering the Real Estate Market
Ryan Mahoney - How Property Technology Is Altering the Real Estate MarketRyan Mahoney - How Property Technology Is Altering the Real Estate Market
Ryan Mahoney - How Property Technology Is Altering the Real Estate Market
 
A Brief History of Intangibles in Ad Valorem Taxation.pdf
A Brief History of Intangibles in Ad Valorem Taxation.pdfA Brief History of Intangibles in Ad Valorem Taxation.pdf
A Brief History of Intangibles in Ad Valorem Taxation.pdf
 
Experion Elements Sector 45 Noida_Brochure.pdf.pdf
Experion Elements Sector 45 Noida_Brochure.pdf.pdfExperion Elements Sector 45 Noida_Brochure.pdf.pdf
Experion Elements Sector 45 Noida_Brochure.pdf.pdf
 
8 Key Elements for Comfortable Farmland Living
8 Key Elements for Comfortable Farmland Living 8 Key Elements for Comfortable Farmland Living
8 Key Elements for Comfortable Farmland Living
 
Call Girls In Peeragarhi, Delhi↫8447779280↬Call Girls in Peeragarhi Delhi NCR
Call Girls In Peeragarhi, Delhi↫8447779280↬Call Girls in Peeragarhi Delhi NCRCall Girls In Peeragarhi, Delhi↫8447779280↬Call Girls in Peeragarhi Delhi NCR
Call Girls In Peeragarhi, Delhi↫8447779280↬Call Girls in Peeragarhi Delhi NCR
 
Sobha Aranya Sector 80 Gurgaon E- Brochure.pdf
Sobha Aranya Sector 80 Gurgaon E- Brochure.pdfSobha Aranya Sector 80 Gurgaon E- Brochure.pdf
Sobha Aranya Sector 80 Gurgaon E- Brochure.pdf
 
Call Girls in Mahavir Nagar whatsaap call US +919953056974
Call Girls in Mahavir Nagar  whatsaap call US  +919953056974Call Girls in Mahavir Nagar  whatsaap call US  +919953056974
Call Girls in Mahavir Nagar whatsaap call US +919953056974
 
83770-87607 ۞Call Girls In Near The Park Hotel (Cp) Delhi
83770-87607 ۞Call Girls In Near The Park Hotel (Cp) Delhi83770-87607 ۞Call Girls In Near The Park Hotel (Cp) Delhi
83770-87607 ۞Call Girls In Near The Park Hotel (Cp) Delhi
 
MADHUGIRI FARM LAND BROCHURES (11)_compressed (1).pdf
MADHUGIRI FARM LAND BROCHURES (11)_compressed (1).pdfMADHUGIRI FARM LAND BROCHURES (11)_compressed (1).pdf
MADHUGIRI FARM LAND BROCHURES (11)_compressed (1).pdf
 
Kohinoor Hinjewadi Phase 2 Pune | E-Brochure
Kohinoor Hinjewadi Phase 2 Pune | E-BrochureKohinoor Hinjewadi Phase 2 Pune | E-Brochure
Kohinoor Hinjewadi Phase 2 Pune | E-Brochure
 
Ajmera Prive at Juhu, Mumbai E-Brochure.pdf
Ajmera Prive at Juhu, Mumbai  E-Brochure.pdfAjmera Prive at Juhu, Mumbai  E-Brochure.pdf
Ajmera Prive at Juhu, Mumbai E-Brochure.pdf
 
LCAR Unit 22 - Leasing and Property Management - 14th Edition Revised.pptx
LCAR Unit 22 - Leasing and Property Management - 14th Edition Revised.pptxLCAR Unit 22 - Leasing and Property Management - 14th Edition Revised.pptx
LCAR Unit 22 - Leasing and Property Management - 14th Edition Revised.pptx
 

Jll commercial real estate market report toronto 2014

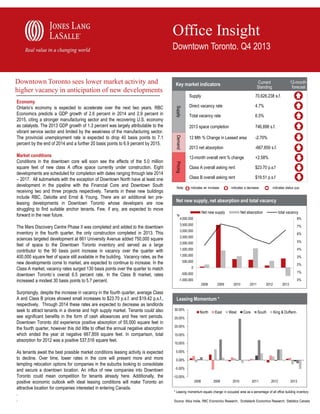
  • 1. Office Insight Downtown Toronto. Q4 2013 Surprisingly, despite the increase in vacancy in the fourth quarter, average Class A and Class B prices showed small increases to $23.70 p.s.f. and $19.42 p.s.f., respectively. Through 2014 these rates are expected to decrease as landlords seek to attract tenants in a diverse and high supply market. Tenants could also see significant benefits in the form of cash allowances and free rent periods. Downtown Toronto did experience positive absorption of 55,000 square feet in the fourth quarter, however this did little to offset the annual negative absorption which ended the year at negative 667,859 square feet. In comparison, total absorption for 2012 was a positive 537,516 square feet. As tenants await the best possible market conditions leasing activity is expected to decline. Over time, lower rates in the core will present more and more tempting relocation options for companies in the suburbs looking to consolidate and secure a downtown location. An influx of new companies into Downtown Toronto could mean competition for tenants already here. Additionally, the positive economic outlook with ideal leasing conditions will make Toronto an attractive location for companies interested in entering Canada. 6.5% 2013 space completion 746,898 s.f. 12 Mth % Change in Leased area -2.70% 2013 net absorption -667,859 s.f. 12-month overall rent % change +2.58% Class A overall asking rent $23.70 p.s.f Class B overall asking rent Pricing The Mars Discovery Centre Phase II was completed and added to the downtown inventory in the fourth quarter, the only construction completed in 2013. This sciences targeted development at 661 University Avenue added 750,000 square feet of space to the Downtown Toronto inventory and served as a large contributor to the 90 basis point increase in vacancy over the quarter with 400,000 square feet of space still available in the building. Vacancy rates, as the new developments come to market, are expected to continue to increase. In the Class A market, vacancy rates surged 130 basis points over the quarter to match downtown Toronto`s overall 6.5 percent rate. In the Class B market, rates increased a modest 30 basis points to 5.7 percent. 4.7% Total vacancy rate Note: 70,626,238 s.f. Direct vacancy rate Demand Market conditions Conditions in the downtown core will soon see the effects of the 5.0 million square feet of new class A office space currently under construction. Eight developments are scheduled for completion with dates ranging through late 2014 – 2017. All submarkets with the exception of Downtown North have at least one development in the pipeline with the Financial Core and Downtown South receiving two and three projects respectively. Tenants in these new buildings include RBC, Deloitte and Ernst & Young. There are an additional ten preleasing developments in Downtown Toronto whose developers are now struggling to find suitable anchor tenants. Few, if any, are expected to move forward in the near future. Supply Supply Economy Ontario’s economy is expected to accelerate over the next two years. RBC Economics predicts a GDP growth of 2.6 percent in 2014 and 2.9 percent in 2015, citing a stronger manufacturing sector and the recovering U.S. economy as catalysts. The 2013 GDP growth of 1.3 percent was largely attributable to the vibrant service sector and limited by the weakness of the manufacturing sector. The provincial unemployment rate is expected to drop 40 basis points to 7.1 percent by the end of 2014 and a further 20 basis points to 6.9 percent by 2015. 12-month forecast Current Standing Key market indicators $19.51 p.s.f indicates an increase indicates a decrease indicates status quo Net new supply, net absorption and total vacancy Net new supply sf Downtown Toronto sees lower market activity and higher vacancy in anticipation of new developments Net absorption total vacancy 4,000,000 8% 3,500,000 7% 3,000,000 6% 2,500,000 2,000,000 5% 1,500,000 4% 1,000,000 3% 500,000 2% 0 1% -500,000 -1,000,000 0% 2008 2009 2010 2011 2012 2013 Leasing Momentum * 30.00% North East West Core South King & Dufferin 25.00% 20.00% 15.00% 10.00% 5.00% 0.00% -5.00% -10.00% 2008 2009 2010 2011 2012 2013 . * Leasing momentum equals change in occupied area as a percentage of all office building inventory . Source: Altus Insite, RBC Economics Research, Scotiabank Economics Research, Statistics Canada
  • 2. Jones Lang LaSalle Americas Research • Greater Toronto Office Insight • Q4 2013 2 Available available Sublease sublease space Downtown East Downtown West sf 4,000,000 Downtown North Financial Core Downtown South King & Dufferin Downtown East Downtown West 900,000 sf Available direct space Downtown North Financial Core Downtown South King & Dufferin 800,000 3,500,000 700,000 3,000,000 600,000 2,500,000 500,000 2,000,000 400,000 1,500,000 300,000 1,000,000 200,000 500,000 100,000 0 0 2008 2009 2010 2011 2012 2013 2008 2009 2010 2011 Class B overall asking rents $35 Downtown East Downtown West Downtown North Financial Core Downtown South King & Dufferin $ psf Class A overall asking rents 2013 * Includes all available sublease space on the market $ psf * Includes all available direct space on the market 2012 $30 Downtown East Downtown West $25 Downtown North Financial Core Downtown South King & Dufferin $20 $25 $15 $20 $15 $10 $10 $5 $5 $0 $0 2008 2009 2010 2011 2012 2008 2013 East 400 North South West Core 2011 2012 2013 East North South West Core King & Dufferin 100 Number of blocks Number of blocks 120 King & Dufferin 350 300 250 200 150 80 60 40 100 20 50 0 2010 Class B blocks of available contiguous space Class A blocks of available contiguous space 450 2009 10,000 25,000 sf King & Dufferin 25,000 50,000 sf 50,000 100,000 sf 100,000 200,000 sf 0 200,000 sf + 10,000 25,000 sf 25,000 50,000 sf 50,000 100,000 sf 100,000 200,000 sf 200,000 sf + 4 4 0 0 0 King & Dufferin 9 6 1 0 0 Core 256 202 176 139 69 Core 38 12 0 0 0 West 65 55 46 38 14 West 24 7 0 0 0 South 53 51 47 44 37 South 1 1 1 0 0 North 28 23 16 16 10 North 28 16 10 10 0 East 15 10 10 10 10 East 0 0 0 0 0 * Includes sublease space * Includes sublease space Source: AltusInsite
  • 3. Jones Lang LaSalle Americas Research • Greater Toronto Office Insight • Q4 2013 3 GTA Submarket leverage – market condition and forecast Property clock – current market conditions Submarket Peaking market Rising market 2013 2014 2015 2016 Core Tenant leverage Landlord leverage Downtown Toronto Toronto Falling market Bottoming market Downtown (excluding Core) Midtown GTA North GTA East GTA West Landlord-favorable conditions Suburban Toronto Balanced conditions Tenant-favorable conditions Q4 Completed lease transactions Tenant Address Submarket s.f. Type Sentry Select 199 Bay Street Financial Core 46,000 New LinkedIn 250 Yonge Street Downtown North 37,000 New Microsoft 222 Bay Street Financial Core 26,142 Renewal Oberfeld Snowcap Inc. 330 Bay Street Financial Core 10,275 Sublease Downtown Sublease Space Market Downtown Toronto added a total of 522,618 square feet of sublease space to the market ending the fourth quarter with almost 1.5 million square feet of available sublease space. A total of 193,214 square feet was subleased in the fourth quarter at an average space size of 6,700 square feet. This places sublease absorption over the quarter at 328,954 negative square feet. The Financial Core remains the most active sublease market, containing more than half of all current sublease listings. The Downtown South submarket, however, has the highest rate of sublease availability at 3.6 percent, with subleases making up 73.0 percent of all available space. The largest sublease availabilities in the market are Allstream Canada’s seven year, 140,000 square feet seven floor sublease at 200 Wellington Street West and Manulife Financial’s eight year, 140,000 square feet seven floor sublease at 2 Queen Street East. Sublease space is expected to increase in the long term as tenants seek to upgrade in the favorable market conditions brought on by the 5.0 million square feet of new office space coming to market through 2014 – 2017. Downtown sublease space by lease expiration year Distribution of available sublease space 11% 2019 + 3% Financial Core 2017 thru 2018 Downtown East Downtown North 19% Downtown West Downtown South 2015 thru 2016 King & Dufferin 2014 9% 0 10 20 30 40 50 60 70 80 s.f. 55% 3% Source: AltusInsite
  • 4. About Jones Lang LaSalle Jones Lang LaSalle (NYSE:JLL) is a professional services and investment management firm offering specialized real estate services to clients seeking increased value by owning, occupying and investing in real estate. With annual revenue of $3.9 billion, Jones Lang LaSalle operates in 70 countries from more than 1,000 locations worldwide. On behalf of its clients, the firm provides management and real estate outsourcing services to a property portfolio of 2.6 billion square feet and completed $63 billion in sales, acquisitions and finance transactions in 2012. Its investment management business, LaSalle Investment Management, has $46.3 billion of real estate assets under management. For further information, visit www.jll.com. About Jones Lang LaSalle Research Jones Lang LaSalle’s research team delivers intelligence, analysis, and insight through market-leading reports and services that illuminate today’s commercial real estate dynamics and identify tomorrow’s challenges and opportunities. Our 300 professional researchers track and analyze economic and property trends and forecast future conditions in over 70 countries, producing unrivalled local and global perspectives. Our research and expertise, fueled by real-time information and innovative thinking around the world, creates a competitive advantage for our clients and drives successful strategies and optimal real estate decisions. Prepared by: For more information, please contact: Taylor McCarten Associate Direct +1 416 238 5987 Taylor.mccarten@am.jll.com Eamonn Murphy Managing Director Direct +1 416 209 8920 eamonn.murphy@am.jll.com Jones Lang LaSalle 199 Bay Street Suite 4610 Toronto, ON, M5L 1G3 For further information, please visit our website, http://www.joneslanglasalle.ca Jones Lang LaSalle Real Estate Services, Inc. Real Estate Agency. ©2013 Jones Lang LaSalle IP, Inc. All rights reserved. All information contained herein is from sources deemed reliable; however, no representation or warranty is made to the accuracy thereof.
  • 5. Brace for the construction boom. In 2014, over 10.0 million square feet will be delivered to the national office market. Q4 2013 Canadian Office Market Overview Continued urbanization will drive downtown office leasing in 2014 23.0 million square feet under construction across the country Full year 400,000 square feet of negative absorption nationally National vacancy at 8.5 percent in the fourth quarter National Office Report • Q4 2013 Jones Lang LaSalle Canada Research 1
  • 6. Canadian economy Global and national economic conditions Global economic activity was stronger leading into the end of 2013, showing signs of growth and confidence that are expected to carry into 2014. The United States posted stronger than expected employment and income gains in the third quarter of 2013; consequently, the Federal Reserve trimmed its bondbuying program by $10.0 billion a month, from $85.0 billion to $75.0 billion. U.S. GDP growth is expected to accelerate into 2014; forecasts have improved, projected at 1.8 percent for 2013 and 2.5 percent for 2014. The unemployment rate stands at 6.7 percent following a dismal December, as lower than expected job growth numbers were reported for the month. The positive outlook for the U.S. in 2014 will be driven by the upturn in private consumption, residential construction and private investment; both neighboring countries, Canada and Mexico, are expected to benefit from these improved market conditions. Excluding Brazil, the Eurozone was the weakest part of the global economy in the third quarter, growing only 0.1 percent quarter-over-quarter. Forecasts for the Eurozone’s GDP growth in 2014 and 2015, however, remain encouraging, at 0.9 percent and 1.6 percent respectively. The European Central Bank has set the interest rate at a record-low benchmark of 0.25 percent in order to stimulate the economy as downward pressure continues on the current 0.8 percent inflation rate, which stands 120 basis points below the 2.0 percent target rate. The Bank of Canada’s (BoC) governor, Stephen Poloz, continued to hold the target overnight rate at 1.0 percent. This policy will remain in place if inflation remains muted and imbalances in the household sector continue to improve. CPI inflation rose 1.0 percent year-over-year for November, missing the target rate of 2.0 percent by 100 basis points. With inflation expectations well anchored, both core and total CPI inflation are expected to slowly return to the 2.0 percent rate. National Office Report • Q4 2013 Employment gains in 2013 were disappointing as Canada had the slowest December year-over-year growth rate since 2009, adding a merely 102,000 jobs or 0.6 percent over 12 months. Employment fell by 46,000 jobs in the month of December, increasing the unemployment rate by 0.3 percent to 7.2 percent. The Canadian GDP growth rate for 2013 has been adjusted to 1.8 percent and forecasts for 2014 have increased to 2.4 percent. Canadian growth in 2014 will be determined by the approval of key export pipeline projects. The oil and gas sector currently accounts for 25.0 percent of Canadian exports, and could expand if Canada gains access to the Asian market through the proposed pipeline projects along the West Coast and Atlantic Canada. The Canadian economy is anticipated to benefit from the positive outlook on the United States in 2014. The cyclical recovery of the U.S and a possible softening of the Canadian dollar will allow Canada to benefit through exports. The Canadian dollar will likely fluctuate around the low- to mid-90¢ (U.S) range; this is expected to increase foreign demand for Canadian exports and reduce Canada’s $120.0 billion noncommodity trade deficit. U.S housing starts jumped to 1.1 million units annualized in November and is expected to increase to 1.4 million units by 2015. Construction starts for the Canadian housing market cooled down in 2013, slowing to 188,200 units. The outlook for 2014 shows housing starts further declining to 180,000 units; as several developers pull back projects to allow demand to catch up with supply. Jones Lang LaSalle Canada Research 2
  • 7. Office market overview National market conditions The Canadian office market, stretching from Halifax in the east to Vancouver in the west, saw an uptick of leasing velocity in the last three months of the year after posting negative net absorption in three consecutive quarters. Quarter over quarter, net absorption totalled 200,000 square feet which while positive, was not enough to offset the three previous quarters, bringing 2013 net absorption to negative 400,000 square feet. Looking back, we have not registered a full year with total negative net absorption since the 2008 and 2009 recession when the market shed close to 1.2 million square feet. In Canada, overall leasing activity was notably stronger in the suburban landscape while several downtown markets were in the red for most of the year. Full year net absorption numbers for the five largest office markets (Vancouver, Calgary, Montréal, Ottawa and Toronto) were negative 1.7 million square feet in downtown and positive 280,000 square feet in the suburbs. Leasing activity is expected to pick up in 2014, particularly in downtown markets as economic conditions and the labour market improves. In addition, we expect certain suburban markets to perform well, particularly markets with a significant presence of U.S. companies and markets with superior transit connectivity. Despite overall positive absorption in the fourth quarter, the national office vacancy rate increased for the sixth quarter in a row to 8.5 percent, up 60 basis points quarter over quarter and 120 basis points year over year. Vacancy remains highest in suburban markets, with the five largest office markets ending the year with an overall vacancy rate of 11.7 percent while the downtown rate was 6.1 percent. The overall vacancy rate increase was primarily due to the completion of 26 office projects in the fourth quarter, adding 3.3 million square feet of which 2.5 million square feet were in suburban markets. National Office Report • Q4 2013 We expect this trend to continue over the next few years as the current office development cycle enters its completion phase. Nationally, there is 23.0 million square feet in the pipeline, or 4.7 percent of the total inventory, all slated for completion through 2014 – 2018. Approximately 75.0 percent of that space is downtown developments, while 25.0 percent is suburban developments. To put this in perspective, in the markets of Toronto, Calgary and Vancouver city wide stock will increase by 5.0 to 11.0 percent. Another noticeable increase over the past 12 months is the amount of available sublease space. Nationally, the sublet availability rate sits at 1.9 percent representing an increase of 2.8 million square feet year over year. The sublet availability rate is particularly high in downtown markets. For example, in downtown Calgary and Toronto the rate has almost doubled in the past 12 months. This increase, coupled with development completions and tenant movements to said completions is creating large blocks of direct vacant space. These blocks are putting pressure on landlords to either lower their net asking rents or be more liberal with their concessions. Nationally, overall rents are close to peaking or at the peak for this cycle, thus shifting the office market from landlord-favourable to a more neutral market. At the end of the fourth quarter national average asking net rents were $16.14 per square foot, up from $16.03 year over year, but slightly down when compared with the previous quarter. As shown in the JLL market clock on the following page, several markets have passed the 12 o’clock mark and ventured into the falling quadrant. We expect this trend to continue as rents gradually decrease leading to more tenantfavourable conditions over the next three to four years. Jones Lang LaSalle Canada Research 3
  • 8. Canadian Office Property Clock Q4 2013 Canada, Montréal Toronto Vancouver, Québec City Calgary Edmonton Winnipeg Ottawa Rental growth slowing Rents falling Rental growth accelerating Halifax Rents bottoming out Reading the clock Jones Lang LaSalle’s office clock demonstrates where each market sits within its real estate cycle. Markets typically move clockwise around the clock and markets on the left are generally landlord-favourable, while those on the right side of the clock tend to be tenant-favourable. At the end of 2013, three major markets had crossed the 12 o’clock position, signaling that they had shifted from a rising to a falling market. While Toronto and Calgary are still considered landlord-favourable, we believe conditions will convert to neutral and/or tenant-favourable over the next three to four years. This anticipated shift is in large part the result of new office National Office Report • Q4 2013 developments, available sublet space and large blocks of vacant space. Canada as a whole has transitioned from the 2:30 position in 2009, 5:30 position at the end of 2010 and the 8:00 position in 2011 to the 11:45 position in Q4 2013. JLL expects the office markets in Montréal and Quebec City to peak during the first quarter of 2014, pushing the national office market to the falling rent quadrant. It should be noted that positive economic conditions and labour market outlook could keep Canada at or close to peak for some time. Jones Lang LaSalle Canada Research 4
  • 9. Calgary • The overall vacancy rate increased 50 basis points to 7.7 percent quarter-over-quarter. • Available sublet space accounted for over 40.0 percent of all available space in Calgary, an increase of 1.6 million square feet year-over-year. • 7.0 million square feet of new office space is in the pipeline with delivery dates through 2014 – 2018. The majority, 73.0 percent, is being built in Downtown Calgary. Economy • Alberta’s employment is expected to have grown by 2.8 percent in 2013 and come in at 2.4 percent in 2014. • Calgary’s unemployment rate saw a slight uptick in December, up 10 basis points to 4.7 percent. Still among the lowest unemployment rates in the country. • According to forecasts by RBC economics, Alberta will lead the country in real GDP with expected growth of 3.9 percent in 2014 and 3.5 percent in 2015. Trends in Review and Outlook • After three consecutive quarters of negative net absorption, the Calgary office market finally crept back to positive territory with close to 400,000 square feet of net absorption in the fourth quarter. While positive, it was not enough to offset the three previous quarters bringing the total net absorption for the year to negative 702,296 square feet. • Despite Calgary’s overall positive net absorption, the total vacancy rate increased 50 basis points to 7.7 percent quarter-over-quarter. The increase in vacancy was primarily driven by the completion of seven new buildings, adding close to 900,000 square feet to the inventory and 150,000 square feet of available space, all in suburban markets. • With approximately 3.3 million square feet of forward leasing activity through Q4 2013 and spilling over into the New Year, our view is that the downtown market in 2017/2018 could be well poised to realize vacancy rates considerably below equilibrium. • However, our near term forecast suggests that tenants looking for space are facing the most favorable market conditions witnessed in the last 10 years. • At the end of the fourth quarter, available sublet space accounted for over 40.0 percent of all available space in Calgary, an increase of 1.6 million square feet year-over-year. • 7.0 million square feet of new Class A office space is under construction, and assuming completion on time, will add over 11.0 percent to the citywide stock over the next five years. This represents an unique opportunity for tenants to upgrade their current office space to highly-efficient and modern spaces in both Downtown and suburban Calgary. As of the fourth quarter 34.0 percent or 2.3 million square feet of the new construction was still available for lease. • In the near term, growing inventory and weaker market conditions are placing downward pressure on rents, thus pushing the Calgary wide office market towards more tenant-favourable conditions. • Downtown Calgary, however, could be experiencing the beginnings of a potentially rapid swing from a “Falling Market” to a “Rising Market” on our property clock. National Office Report • Q4 2013 Property Clock Betline Calgary Downtown Suburban Peaking market Falling market Rising market Bottoming market Market Vacancy ( %) Absorption (s.f.) Betline 13.7% 135,359 $17.05 Downtown 4.6% -125,684 $28.55 North Calgary 9.6% 615,943 $17.50 South Calgary 15.1% 664,893 $19.20 Market Vitals Net Asking Rate Arrows represent change from prior quarter Recent Deals Address Node Tenant Area (s.f.) Brookfield Place Downtown Cenovus 1,000,000 Western Canadian Place Downtown Husky 800,000 Nexen Tower Downtown Nexen 600,000 Eighth Avenue Place West Downtown Pembina Pipeline 305,000 707 – 5th Avenue SW Downtown Brion Energy (Dover) 250,000 Scotia Centre Downtown Harvest Energy Trust 142,000 Jones Lang LaSalle Canada Research 5
  • 10. Ottawa-Gatineau • The Ottawa-Gatineau market is increasingly tenant-favourable and can offer great value to new users of office space. • Landlords are reacting to trends of increasing vacancy rates and federal government downsizing by offering attractive incentives to existing and potential tenants. • Tepid growth is expected in the next year as the tech sector slowly rebounds and major government investments in infrastructure begin to ramp up. • The overall vacancy rate decreased to 5.5 percent and there was 100,011 square feet of net new space leased by tenants in quarter four. Economy • Federal government employment has shrunk to 141,600 employees from 163,100 employees a year earlier. Employment in this sector is expected to decrease by another 1.4 percent in 2014. This was counterbalanced by an improvement in tech sector employment. It raised to 56,200 employees from 40,200 a year ago. • The overall unemployment rate is expected to have risen from 6.4 percent to 6.5 percent by the end of the fourth quarter. • Although there are many big construction projects in the city such as the Confederation Line LRT, rehabilitation of the center block at Parliament Hill and four major investments in retail, construction values decreased by 40.0 percent in December from a year earlier. • Residential construction has slowed down due to an oversupply of condominium units and a negative outlook for employment in the area. The average sale price increased by 1.6 percent in 2013 but the number of sales decreased by 3.3 percent • Real GDP is expected to lag behind other major metropolitan cities in 2014 and is expected to be roughly 1.8 percent. Trends in Review and Outlook • The fourth quarter continued to show emerging trends in the Ottawa-Gatineau market. • The downtown market has been experiencing some of the highest vacancies in the past 10 years. The main factor is considered to be the government and private business not leasing additional space, but right-sizing their office area. • Attractive incentives in the Downtown Core have had a negative impact on older B and C buildings in the Core and in Centretown. Vacancy rates are high for these buildings and should produce a very tenant-favourable market for users looking for this type of space. • Ottawa East and Gatineau remained relatively strong in quarter four. New purpose built buildings in each node built for the government may produce vacancies in the future as the government consolidates their workforce in these new buildings. • The technology-centric Ottawa West has seen some improvement in the fourth quarter. As technology employment numbers improve, companies are growing into new spaces. This, plus some very aggressive incentives offered by landlords, have brought down the vacancy rate in these suburban nodes. Expect balanced conditions if employment continues to improve at this same pace. National Office Report • Q4 2013 Property Clock Suburban East Downtown Submarket Gatineau Peaking market Rising market Falling market Ottawa-Gatineau Suburban West Bottoming market Market Vitals Market Vacancy (%) Absorption (s.f.) Net Asking Rate Ottawa 5.5% 101,011 $15.34 Downtown 5.1% -77,003 $19.02 Suburban East 4.0% 14,030 $13.96 Suburban West 7.6% 147,001 $13.30 Gatineau 1.8% 15,983 $13.50 Arrows represent change from prior quarter Recent Deals Address Node Tenant Area (s.f.) 150 Elgin Street Downtown Core Shopify 100,000 350 Legget Drive Ottawa West Conversant/Mossaid 43,000 275 Slater Street Downtown Core MBM 12,000 55 Metcalfe Street Downtown Core Mercer 10,000 Jones Lang LaSalle Canada Research 6
  • 11. Montréal • • • • • The GMA ended 2013 with a quarter of weak leasing momentum, adding only 23,979 square feet in total occupied area. New supply caused the total vacancy rate across the GMA to push over 10.0 percent. Total vacancy in the Downtown submarket inched above 7.0 percent for the first time in over two years. Midtown experienced negative net absorption (118,948 square feet) for the first time this year. Although the fourth quarter brought good news, the suburban submarket’s performance remained polarized in 2013. Economy • Improvements to Montreal’s labour market remained modest this year with the GMA adding only 42,300 new jobs. • Although employment grew by roughly 2.1 percent during this period, unemployment increased by 20.0 basis points to reach 8.3 percent. • The increase in unemployment was a result of the active population growing by 52,200 people, outpacing employment growth by nearly 9,900 workers. • However, during the same period the GMA’s office employment sector faired significantly better with total employment growing by approximately 2.8 percent and adding 11,600 jobs. Trends in Review and Outlook • The GMA ended 2013 with another quarter of weak leasing momentum, adding a meager 23,979 square feet in total occupied area, bringing total YTD net absorption to 248,815 square feet. • Leasing activity resulted in a 0.26 percent increase in total occupied area in 2013, which is significantly lower then the 1.0 percent and 1.3 percent growth rates experienced respectively over the last two years. • Market conditions Downtown continue to lag in relation to the rest of the GMA. Similar to five out of the six previous quarters, Downtown experienced negative absorption in the fourth quarter of 2013. • Net absorption for the quarter amounted to negative 164,689 square feet, helping vacancy inch above 7.0 percent for the first time in over two years. • Weak leasing activity for 2013 has caused total occupied area Downtown to compress by nearly 0.9 percent or negative 440,911 square feet. • The Midtown market was, for the first time in 2013, the worst performing submarket across the GMA during the quarter with net absorption amounting to negative 118,948 square feet. • However this year, the Midtown market remained the best performing submarket adding nearly 518,338 square feet of additional occupied area, representing a 2.4 percent growth from 2012. • Weak market conditions and new supply this quarter have caused total vacancy to inch up another 2.1 percent, bringing the total increase this year to 4.4 percent. Total vacancy in the Midtown market currently stands at 14.1 percent. • Suburban submarkets performance remained polarized in 2013. On one side, the South Shore saw a 5.1 percent growth in total occupied area and bringing total vacancy down to 9.5 percent. • On the other hand, the East End ended the year with negative 74,361 square feet of net absorption, a 3.1 percent compression in total occupied area, causing total vacancy to approach 15.0 percent. • The two remaining suburban submarkets, Laval and West Island, saw little real growth in 2013 and continue to display high vacancy rates at 13.3 percent and 16.5 percent respectively. National Office Report • Q4 2013 Property Clock Montréal Midtown Laval South Shore Peaking market Rising market Downtown (excluding core) Downtown Core Falling market East End Bottoming market Saint-Laurent (West Island) West Island Market Vitals Market Vacancy (%) Absorption (s.f.) Net Asking Rate Downtown 7.0% -164,689 $15.34 Midtown 14.1% -118,948 $12.08 Laval 13.3% 20,584 $13.71 South Shore 9.5% 72,940 $13.29 East End 15.0% 14,570 $12.80 West Island 16.5% 199,522 $12.03 Arrows represent change from prior quarter Recent Deals Address Node Tenant Area (s.f.) 1155 René-Lévesque W. Downtown Core Ultramar 45,043 1501 McGill College Downtown Core Bank of Montreal 43,427 1002 Sherbrooke W. Downtown Core BCA Research 21,754 1050 Beaver Hall Downtown Core Alphanumeric Systems 15,841 Jones Lang LaSalle Canada Research 7
  • 12. Downtown Toronto • Forecasts for Ontario’s economy anticipate GDP growth of 2.6 percent in 2014 and 2.9 percent in 2015 with a recovering U.S. economy and a stronger manufacturing sector. • Downtown Toronto vacancy increased 0.9 percent from last quarter, ending the year at 6.5 percent. • Leasing activity continued to remain subdued as tenants wait in anticipation for the arrival of new office developments. Thus far, 750,000 square feet of new space has entered the market in Toronto’s office growth boom. Economy • Ontario’s economy is expected to accelerate over the next two years, with RBC Economics predicting GDP growth of 2.6 percent in 2014 and 2.9 percent in 2015, citing a stronger manufacturing sector and U.S. economy as catalysts. • The 2013 GDP growth of 1.3 percent was largely attributable to the vibrant service sector and limited by the weakness of the manufacturing sector. • The provincial unemployment rate is expected to drop 40 basis points to 7.1 percent by the end of 2014 and a further 20 basis points to 6.9 percent by 2015. Trends in Review and Outlook • Conditions in the downtown core will soon see the effects of the 5.0 million square feet of new Class A office space currently under construction. Eight developments are scheduled for completion with dates ranging from late 2014 through 2017. • The Mars Discovery Centre Phase II was completed and added to the downtown inventory in the fourth quarter, the only construction completed in 2013. This sciences-targeted development at 661 University Avenue added 750,000 square feet of space to the Downtown Toronto supply and served as a large contributor to the 90 basis point increase in vacancy over the quarter with 400,000 square feet of space still available in the building. • Vacancy rates, as the new developments come to market, are expected to continue to increase. In the Class A market, rates surged 130 basis points over the quarter to match downtown Toronto`s overall 6.5 percent rate. In the Class B market, rates increased a modest 30 basis points to 5.7 percent. • Surprisingly, despite the increase in vacancy in quarter four, average Class A and B rents showed small increases to $23.70 and $19.42 per square foot respectively. Through 2014 these rates are expected to decrease as landlords seek to attract tenants in a diverse and high supply market. Tenants could also see significant benefits in the form of cash allowances and free rent periods. • Downtown Toronto did experience positive absorption of 55,000 square feet in quarter four however this did little to offset the annual negative absorption total of 667,859 square feet. In comparison, total absorption for 2012 was positive 537,516 square feet. • As the market moves towards more tenant-favorable conditions, activity is expected to decline while some tenants wait to secure the best possible rates. Lower rates in the Core will present tempting relocation options for companies in the suburbs looking to consolidate and secure a downtown location. An influx of new companies into Downtown Toronto could mean competition for tenants already here and the positive economic outlook with ideal leasing conditions will make Toronto an attractive location for companies interested in entering Canada. National Office Report • Q4 2013 Property Clock Downtown South Downtown West King & Dufferin Peaking market Rising market Downtown Toronto Financial Core Falling market Bottoming market Downtown East Downtown North Market Vitals Market Vacancy (%) Absorption (s.f.) Net Asking Rate Downtown East 7.4% -17,474 $19.02 Downtown North 9.1% 144,430 $17.59 Downtown South 4.4% -55,619 $19.55 Downtown West 6.1% -172,389 $19.29 Financial Core 5.5% 138,458 $22.45 King & Dufferin 9.2% 18,406 $18.02 Arrows represent change from prior quarter Recent Deals Address Node Tenant 199 Bay Street Financial Core Stikeman Elliott LLP 199 Bay Street Financial Core Sentry Select 250 Yonge Street Downtown North LinkedIn 222 Bay Street Financial Core Microsoft Area (s.f.) 46,615 26,142 Jones Lang LaSalle Canada Research 8
  • 13. Suburban Toronto • In quarter four, the vacancy rate was 13.6 percent in Toronto West, 7.6 percent in Toronto North and 11.7 percent in Toronto East • Toronto East saw 257,753 square feet of negative net absorption, followed by Toronto North with negative 87,315 square feet and Toronto West with 79,564 square feet. • Don Mills & Eglinton was the weakest submarket with 361,2709 square feet of negative net absorption Economy • Ontario’s economy is expected to accelerate over the next two years. RBC Economics predicts GDP growth of 2.6 percent in 2014 and 2.9 percent in 2015, citing a stronger manufacturing sector and U.S. economy as catalysts. • Ontario’s unemployment rate is expected to drop 40 basis points to 7.1 percent by the end of 2014 and a further 20 basis points to 6.9 percent by 2015. • The 2013 GDP growth of 1.3 percent was largely attributable to the vibrant service sector and limited by the weakness of the manufacturing sector. Trends in Review and Outlook • Vacancy in the Greater Toronto Area (GTA) suburban market continued to trend upwards reaching 12.0 percent in the fourth quarter of 2013. From 2009 to 2012 vacancy in the suburban market has ranged from 10.0 percent and 11.0 percent, which was up from the low of 7.8 percent in 2008. • The Airport Area was another weak submarket with 230,580 square feet of negative net absorption, the majority of which came from the Airport Corporate Centre. • Toronto West leads the suburbs with 1.2 million square feet of available sublet space, followed by the East with 0.5 million square feet and the North with 0.3 million square feet. • Meadowvale was the strongest submarket with almost 200,000 square feet of positive absorption. • Although North Yonge remained one of the tightest suburban markets in terms of vacancy, the vacancy rate jumped 170 basis points to 7.4 percent in quarter four. • GTA West currently has 1.6 million square feet of office space currently under construction, of which 661,536 square feet, or 42.2 percent, is available for lease. • The vacancy rate in the GTA North increased by 130 basis points in quarter four to 7.6 percent, which is the highest rate since Q1 2010. This vacancy increase was primarily due to the completion of the two new buildings in Vaughan, which totaled 105,000 square feet of new office space. • The P&G building at 4711 Yonge Street is one of the largest and newest subleases to hit the market with approximately 100,000 square feet over five non-contiguous floors. • The GTA West is the dominant sublease market with 53.0 percent of sublease availabilities, followed by the GTA East with 31.0 percent and the GTA North with 16.0 percent. • Net rent remained relatively steady, with an net asking rate of $14.75 per square foot in the GTA West, $16.43 in the GTA North and $12.64 in the GTA East. National Office Report • Q4 2013 Property Clock North Yonge Markham Peaking market Rising market Falling market Bottoming market Oakville/Burlington Meadowvale Airport Area Mississauga City Centre Suburban Toronto Market Vitals Market Vacancy ( %) Absorption (s.f.) Net Asking Rate Meadowvale 10.1% 199,088 $15.95 Airport Area 18.8% -230,580 $13.52 Mississauga City Centre 15.5% -20,146 $16.44 North Yonge 7.4% -140,791 $18.20 Markham 10.1% -87,520 $14.91 Oakville/Burlington 15.7% 135,149 $16.48 Arrows represent change from prior quarter Recent Deals Address Node Tenant Area (s.f.) 2920 Matheson Blvd E Airport Corporate Centre Bayer 134,000 7100 West Credit Ave. Meadowvale WorleyParsons 95,800 3450-3470 Superior Crt Oakville Amerisource Bergen 60,000 75 Courtney Park Dr W Heartland KAO Group 38,000 Jones Lang LaSalle Canada Research 9
  • 14. Vancouver • Metro Vancouver office vacancy increased by 170 basis points over the previous quarter to 8.9 percent. • The Suburban market experienced its fifth consecutive quarter with negative net absorption, increasing the vacancy rate to 12.8 percent. • Downtown sublease availability increased from 1.8 percent to 2.4 percent, which is significantly higher than the 10 year average availability rate of 1.3 percent. • In comparison to other major markets, there continues to be limited options for multi-floor tenants in the Downtown Core looking for Class A office space. Economy • British Columbia’s GDP growth is expected to be 2.7 percent in 2014, followed by one of the highest in Canada in 2015 at 3.1 percent. • The unemployment rate in Vancouver has dropped 40 basis points over the previous year to 6.3 percent. This trend is on pace to continue as real wage gains supported by low inflation and federal shipbuilding contracts are expected to boost consumer spending and job creation. • Improving economic conditions in the United States combined with strong international demand for B.C.’s natural resource industries should increase consumer and business confidence moving into 2014. Trends in Review and Outlook • Demand for office space throughout Metro Vancouver remained relatively slow during the fourth quarter. • Metro Vancouver experienced year-to-date negative net absorption for the first time since 2009, with approximately 300,000 square feet of negative net absorption in the fourth quarter alone. • As several larger Class A tenants in the Downtown Core prepare to move into new buildings upon completion, significant backfill opportunities remain available. • Seven new Downtown office developments totaling approximately 2.7 million square feet are currently 43.0 percent pre-leased. • The 445,000 square foot TELUS Garden is now 93.0 percent preleased following a significant pre-lease to a technology company. • Law firm Miller Thomson became the first tenant to commit to Cadillac Fairview’s redevelopment at 725 Granville and will take 48,000 square feet of a 75,000 square foot floor plate upon completion. • Credit Suisse building 369,000 square foot LEED Platinum Standard tower on Howe Street despite 0.0 percent pre-leased. • Cadillac Fairview announced a new 350,000 square feet waterfront office tower on their site next to The Station on West Cordova Street. • Richmond vacancy increased by 60 basis points to 14.2 percent during the fourth quarter, and the submarket is currently responsible for 33.7 percent of all sublease space available in the suburban market. • Notable transactions in the fourth quarter include the Arts and Crafts Building on Seymour Street for $15,200,000 ($434 p.s.f.) and 1770 West 7th Avenue in the Broadway Corridor for $32,625,000 ($436 p.s.f.) • The Vancouver Periphery experienced limited volatility during the fourth quarter of 2013. Year-to-date total net absorption was positive 6,757 square feet and office space availability only marginally increased from 7.4 percent to 7.8 percent during the year. There was 72,527 square feet of new office supply added to the market during the year, 100 percent of which has been fully leased. National Office Report • Q4 2013 Property Clock Downtown Vancouver Broadway Corridor Peaking market Burnaby New Westminster Falling market Surrey North Shore Bottoming market Rising market Richmond Langley Market Vitals Market Vacancy (%) Absorption (s.f.) Net Asking Rate Downtown 6.0% -202,576 $23.58 Broadway Corridor 6.9% -25,182 $20.88 Burnaby 9.1% -181,453 $16.90 Richmond 14.2% 36,785 $14.59 Surrey 25.5% -120,121 $16.13 North Shore 7.1% -6,610 $19.67 New Westminster 7.5% -8,216 $16.76 Langley 20.5% 24,641 $17.87 Arrows represent change from prior quarter Recent Deals Address Node Tenant Area (s.f.) 520 West Georgia Street Downtown Confidential Tenant 156,000 550 Burrard Street Downtown Teekay Corporation 52,900 1700 West 75th Avenue Broadway Corridor Canfor 50,000 10271 Shellbridge Way Richmond Top Producer 48,600 Jones Lang LaSalle Canada Research 10
  • 15. Canadian Office Market Statistics Key Office Markets Fourth Quarter 2013 Inventory (s.f.) Quarterly total net absorption (s.f., including subleases) YTD total net absorption (s.f., including subleases) YTD total net absorption ( % of inventory) Total Vacancy ( %) Average Gross marketed rent ($ PSF) Under Construction and Committed (s.f.) 18,492,394 427,998 727,283 3.9% 6.4% $21.70 173,829 2,309,170 4,551 26,357 1.4% 13.4% $26.90 0 44,859,518 100,011 428,189 1.0% 5.5% $31.22 1,446,595 9,372,736 490 393,653 4.2% 3.5% $50.08 930,598 63,784,522 1,290,511 -102,708 -0.2% 7.7% $45.21 7,024,021 28,896,317 -68,664 65,941 0.2% 2.9% $55.44 5,131,839 23,228,350 90,522 167,850 0.7% 7.5% $33.84 338,926 11,023,249 85,197 198,637 1.8% 6.1% $39.28 0 52,247,799 -513,873 -308,558 -0.6% 8.9% $38.03 4,248,557 13,336,532 -179,706 -284,146 -2.1% 5.3% $55.76 1,937,977 171,653,463 -252,192 -1,002,574 -0.6% 9.2% $29.48 7,084,489 45,120,320 111,181 -297,699 -0.7% 6.5% $47.43 5,108,908 10,642,786 12,498 86,144 0.81% 6.2% $23.71 85,000 3,477,581 10,618 54,771 1.6% 3.5% $30.65 85,000 92,619,056 23,979 248,815 0.3% 10.2% $26.55 2,750,545 23,124,284 -185,934 -291,385 -1.3% 7.5% $40.57 1,226,923 9,738,479 310,408 -91,444 -0.8% 8.7% $27.32 307,126 1,375,075 114,955 -3,664 -0.3% 8.4% $34.14 280,126 487,266,367 1,489,862 -1,226,221 0.0% 8.5% $31.80* 23,459,088 Quebec City Downtown 'A' Ottawa Downtown 'A' Calgary Downtown 'A' Edmonton Downtown ‘A’ Vancouver Downtown 'A' Toronto Downtown 'A' Winnipeg Downtown 'A' Montreal Downtown 'A' Halifax Downtown ‘A’ Canadian major market total *Weighted Average Source: Altus Insite, Jones Lang LaSalle Research National Office Report • Q4 2013 Jones Lang LaSalle Canada Research 11
  • 16. About Jones Lang LaSalle Jones Lang LaSalle (NYSE:JLL) is a professional services and investment management firm offering specialized real estate services to clients seeking increased value by owning, occupying and investing in real estate. With annual revenue of $3.9 billion, Jones Lang LaSalle operates in 70 countries from more than 1,000 locations worldwide. On behalf of its clients, the firm provides management and real estate outsourcing services to a property portfolio of 2.6 billion square feet and completed $63 billion in sales, acquisitions and finance transactions in 2012. Its investment management business, LaSalle Investment Management, has $47.7 billion of real estate assets under management. For further information, visit www.jll.com. About Jones Lang LaSalle Research Jones Lang LaSalle’s research team delivers intelligence, analysis, and insight through market-leading reports and services that illuminate today’s commercial real estate dynamics and identify tomorrow’s challenges and opportunities. Our 400 professional researchers track and analyze economic and property trends and forecast future conditions in over 60 countries, producing unrivalled local and global perspectives. Our research and expertise, fueled by real-time information and innovative thinking around the world, creates a competitive advantage for our clients and drives successful strategies and optimal real estate decisions. TORONTO 199 Bay Street, Suite 4610 Toronto, Ontario M5L 1G3 Tel: +1 416 304 6000 Fax: +1 416 304 6001 MISSISSAUGA 110 Matheson Blvd W, Suite 107 Mississauga, ON L5R 4G7 Tel +1 905 502 6116 Fax +1 905 502 5466 MONTRÉAL 1, Place Ville Marie, Suite 2121 Montréal, QC H3B 2C6 Tel +1 514 849 8849 Fax +1 514 849 6919 OTTAWA 275 Slater Street, Suite 933 Ottawa, ON K1P 5H9 Tel +1 613 288 2272 Fax +1 613 688 3010 OFFICE LOCATIONS CALGARY 300, 129 – 8th Avenue SW Calgary , AB T2P 1B4 Tel +1 403 456 2104 Fax +1 587 880 9966 VANCOUVER 21st Floor, 400 Burrard Street Vancouver, BC V6C 3A6 Tel +1 604 998 6001 Fax +1 604 998 6018 For more information please contact: Thomas Forr National Research Coordinator +1 416 304 6047 thomas.forr@am.jll.com www.joneslanglasalle.ca/research www.joneslanglasalle.ca © 2014 Jones Lang LaSalle IP, Inc. All rights reserved. No part of this publication may be reproduced by any means, whether graphically, electronically, mechanically or otherwise howsoever, including without limitation photocopying and recording on magnetic tape, or included in any information store and/or retrieval system without prior written permission of Jones Lang LaSalle. The information contained in this document has been compiled from sources believed to be reliable. Jones Lang LaSalle or any of their affiliates accept no liability or responsibility for the accuracy or completeness of the information contained herein and no reliance should be placed on the information contained in this document. National Office Report • Q4 2013 Jones Lang LaSalle Canada Research 12