Market Watch MARCH 2014
•
0 j'aime•395 vues

8.5% price increase for the first quarter of 2014 vs 2013

Recommandé
Contenu connexe
Plus de Chaba Tamasi
Plus de Chaba Tamasi (16)
Dernier
Dernier (20)
Market Watch MARCH 2014
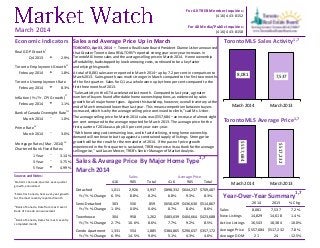
- 1. Sales and Average Price Up in March TORONTO, April 3, 2014 – Toronto Real Estate Board President Dianne Usher announced that Greater Toronto Area REALTORS® reported strong year-over-year increases in TorontoMLS home sales and the average selling price in March 2014. Home ownership affordability, backstopped by low borrowing costs, continued to be a key factor underlying this growth. A total of 8,081 sales were reported in March 2014 – up by 7.2 per cent in comparison to March 2013. Sales growth was much stronger in March compared to the first two months of the first quarter. Sales for Q1 as a whole were up by three per cent compared to the first three months of 2013. “Sales activity in the GTA accelerated last month. Compared to last year, a greater number of buyers found affordable home ownership options, as evidenced by sales growth for all major home types. Against this backdrop, however, overall inventory at the end of March remained lower than last year. This means competition between buyers increased, which is why the average selling price continued to climb,” said Ms. Usher. The average selling price for March 2014 sales was $557,684 – an increase of almost eight per cent compared to the average reported for March 2013. The average price for the first quarter of 2014 was up by 8.5 per cent year-over-year. “With borrowing costs remaining low, and in fact declining, strong home ownership demand will continue to butt up against a constrained supply of listings. Strong price growth will be the result for the remainder of 2014. If the pace of price growth experienced in the first quarter is sustained, TREB may revise its outlook for the average selling price,” said Jason Mercer, TREB’s Senior Manager of Market Analysis. 8,081 7,537 March 2014 March 2013 $557,684 $517,232 March 2014 March 2013 For All TREB Member Inquiries: (416) 443-8152 For All Media/Public Inquiries: (416) 443-8158March 2014 Real GDP Growthi Q4 2013 t 2.9% Toronto Employment Growthii February 2014 t 1.8% Toronto Unemployment Rate February 2014 u 8.3% Inflation (Yr./Yr. CPI Growth)ii February 2014 u 1.1% Bank of Canada Overnight Rateiii March 2014 q 1.0% Prime Rate iv March 2014 q 3.0% Mortgage Rates (Mar. 2014) iv Chartered Bank Fixed Rates 1 Year q 3.14% 3 Year q 3.75% 5 Year u 4.99% Sources and Notes: Economic Indicators i Statistics Canada, Quarter-over-quarter growth, annualized ii Statistics Canada, Year-over-year growth for the most recently reported month iii Bank of Canada, Rate from most recent Bank of Canada announcement iv Bank of Canada, Rates for most recently completed month Sales & Average Price By Major Home Type1,7 416 905 Total 416 905 Total Detached 1,011 2,926 3,937 $898,332 $644,237 $709,487 Yr./Yr. % Change 6.5% 8.8% 8.2% 6.8% 9.3% 8.3% Semi-Detached 303 556 859 $658,429 $436,630 $514,867 Yr./Yr. % Change 1.0% 0.0% 0.4% 8.7% 8.4% 8.6% Townhouse 304 958 1,262 $483,639 $404,664 $423,688 Yr./Yr. % Change 2.7% 10.6% 8.6% 7.7% 9.2% 8.5% Condo Apartment 1,331 554 1,885 $384,865 $290,637 $357,172 Yr./Yr. % Change 6.9% 14.5% 9.0% 5.1% 4.3% 4.6% March 2014 Sales Average Price 2014 2013 % Chg. Sales 8,081 7,537 7.2% New Listings 14,829 14,618 1.4% Active Listings 16,543 18,384 -10.0% Average Price $557,684 $517,232 7.8% Average DOM 21 24 -12.5% Year-Over-Year Summary 1,7 TorontoMLS Sales Activity1,7 TorontoMLS Average Price1,7
- 2. Price Range Detached Semi-Detached Att/Row/Twnhouse Condo Townhouse Condo Apt Link Co-op Apt Det Condo Co-ownership Apt Total $0 to $99,999 1 0 1 3 8 0 0 0 1 14 $100,000 to $199,999 28 1 1 33 209 0 3 0 0 275 $200,000 to $299,999 167 44 44 148 616 16 2 2 6 1,045 $300,000 to $399,999 411 186 179 230 553 22 0 0 2 1,583 $400,000 to $499,999 655 250 205 118 274 26 1 0 0 1,529 $500,000 to $599,999 661 184 123 31 104 22 0 2 1 1,128 $600,000 to $699,999 594 91 65 19 52 21 1 1 0 844 $700,000 to $799,999 387 37 22 10 26 4 0 2 0 488 $800,000 to $899,999 296 38 11 4 8 3 0 0 0 360 $900,000 to $999,999 194 13 2 2 8 0 0 0 0 219 $1,000,000 to $1,249,999 243 8 6 0 8 0 0 0 0 265 $1,250,000 to $1,499,999 117 3 1 3 8 0 0 0 0 132 $1,500,000 to $1,749,999 65 2 0 1 4 0 0 0 0 72 $1,750,000 to $1,999,999 33 0 0 0 1 0 0 0 0 34 $2,000,000 + 85 2 0 0 6 0 0 0 0 93 Total Sales 3,937 859 660 602 1,885 114 7 7 10 8,081 Share of Total Sales 48.7% 10.6% 8.2% 7.4% 23.3% 1.4% 0.1% 0.1% 0.1% - Average Price $709,487 $514,867 $470,472 $372,397 $357,172 $480,127 $285,071 $513,286 $283,960 $557,684 Price Range Detached Semi-Detached Att/Row/Twnhouse Condo Townhouse Condo Apt Link Co-op Apt Det Condo Co-ownership Apt Total $0 to $99,999 3 0 1 7 31 0 0 0 2 44 $100,000 to $199,999 79 5 3 84 490 0 6 0 4 671 $200,000 to $299,999 362 110 107 356 1,473 37 5 4 13 2,467 $300,000 to $399,999 924 439 421 444 1,338 51 1 4 3 3,625 $400,000 to $499,999 1,431 559 441 257 595 54 5 4 0 3,346 $500,000 to $599,999 1,419 364 271 67 247 61 1 2 1 2,433 $600,000 to $699,999 1,216 184 118 33 130 43 3 3 0 1,730 $700,000 to $799,999 837 75 56 26 54 8 0 2 0 1,058 $800,000 to $899,999 636 65 26 7 22 3 1 0 0 760 $900,000 to $999,999 400 23 8 4 18 0 2 0 0 455 $1,000,000 to $1,249,999 496 19 15 5 19 0 0 0 0 554 $1,250,000 to $1,499,999 254 10 5 3 13 0 0 0 0 285 $1,500,000 to $1,749,999 154 7 1 2 9 0 0 0 0 173 $1,750,000 to $1,999,999 92 2 1 1 7 0 0 0 0 103 $2,000,000 + 180 4 0 1 8 0 0 0 0 193 Total Sales 8,483 1,866 1,474 1,297 4,454 257 24 19 23 17,897 Share of Total Sales 47.4% 10.4% 8.2% 7.2% 24.9% 1.4% 0.1% 0.1% 0.1% - Average Price $707,264 $505,532 $471,532 $369,136 $351,213 $473,294 $408,265 $449,105 $241,452 $549,068 SALES BY PRICE RANGE AND HOUSE TYPE1,7 MARCH 2014 SALES BY PRICE RANGE AND HOUSE TYPE1,7 YEAR-TO-DATE, 2014 Market Watch, March 2014 2 Toronto Real Estate Board
- 3. ALL HOME TYPES, MARCH 2014 ALL TREB AREAS Number of Sales Dollar Volume 1 Average Price 1 Median Price 1 New Listings 2 SNLR (Trend) 8 Active Listings 3 Mos. Inv. (Trend)9 Avg. SP/LP 4 Avg. DOM 5 TREB Total 8,081 $4,506,646,216 $557,684 $473,000 14,829 56.7% 16,543 2.4 99% 21 Halton Region 681 $437,477,358 $642,404 $540,000 1,208 62.8% 1,391 2.3 98% 23 Burlington 125 $69,564,809 $556,518 $498,000 211 64.9% 268 2.5 98% 30 Halton Hills 90 $45,750,850 $508,343 $434,000 156 61.2% 188 2.7 98% 23 Milton 195 $101,867,400 $522,397 $464,500 350 64.9% 315 1.7 98% 19 Oakville 271 $220,294,299 $812,894 $680,000 491 61.0% 620 2.6 98% 22 Peel Region 1,690 $796,290,884 $471,178 $435,000 3,260 53.5% 3,482 2.5 98% 20 Brampton 735 $316,757,592 $430,963 $416,000 1,395 53.0% 1,379 2.5 98% 20 Caledon 65 $37,158,340 $571,667 $525,000 133 50.0% 244 4.0 97% 40 Mississauga 890 $442,374,952 $497,051 $455,000 1,732 54.3% 1,859 2.5 99% 19 City of Toronto 2,978 $1,779,060,317 $597,401 $480,000 5,625 54.4% 6,656 2.6 101% 22 York Region 1,557 $1,045,123,501 $671,242 $615,000 2,751 56.7% 2,886 2.5 99% 19 Aurora 93 $57,025,157 $613,174 $565,000 132 62.6% 149 2.5 98% 17 E. Gwillimbury 33 $19,461,190 $589,733 $489,990 36 62.6% 64 3.2 98% 43 Georgina 78 $27,500,550 $352,571 $345,900 114 67.3% 151 2.4 98% 26 King 31 $29,579,100 $954,165 $764,400 73 40.8% 148 6.7 95% 47 Markham 430 $299,279,179 $695,998 $640,000 760 58.9% 681 2.1 100% 17 Newmarket 130 $69,111,050 $531,623 $520,000 198 72.0% 170 1.5 100% 18 Richmond Hill 328 $240,674,634 $733,764 $677,250 614 52.1% 600 2.6 100% 16 Vaughan 377 $266,156,151 $705,984 $639,000 712 52.8% 744 2.7 98% 19 Whitchurch-Stouffville 57 $36,336,490 $637,482 $575,000 112 54.0% 179 3.3 98% 21 Durham Region 947 $360,112,928 $380,267 $359,000 1,553 66.3% 1,401 1.7 99% 18 Ajax 175 $73,711,965 $421,211 $395,088 260 68.7% 184 1.3 100% 16 Brock 15 $4,012,355 $267,490 $285,000 27 53.1% 68 5.9 95% 77 Clarington 161 $52,343,019 $325,112 $310,000 274 66.5% 239 1.7 100% 18 Oshawa 218 $65,478,082 $300,358 $279,000 388 69.9% 310 1.3 99% 14 Pickering 118 $54,077,937 $458,288 $440,500 169 64.4% 150 1.7 99% 17 Scugog 26 $9,667,614 $371,831 $355,000 59 54.1% 92 4.0 98% 43 Uxbridge 32 $16,869,900 $527,184 $490,000 38 58.5% 99 4.4 98% 36 Whitby 202 $83,952,057 $415,604 $393,950 338 66.5% 259 1.4 100% 14 Dufferin County 51 $18,395,400 $360,694 $325,000 80 67.2% 130 2.6 98% 27 Orangeville 51 $18,395,400 $360,694 $325,000 80 67.2% 130 2.6 98% 27 Simcoe County 177 $70,185,828 $396,530 $369,000 352 61.8% 597 3.4 98% 38 Adjala-Tosorontio 6 $3,268,000 $544,667 $447,500 19 54.6% 57 5.5 96% 71 Bradford West Gwillimbury 53 $24,573,900 $463,658 $450,000 101 60.8% 132 2.7 98% 30 Essa 21 $6,931,050 $330,050 $289,900 49 69.4% 75 3.1 98% 34 Innisfil 45 $17,083,388 $379,631 $337,000 83 56.8% 154 4.1 99% 38 New Tecumseth 52 $18,329,490 $352,490 $332,250 100 66.6% 179 3.2 98% 44 SUMMARY OF EXISTING HOME TRANSACTIONS ! TURN PAGE FOR CITY OF TORONTO TABLES OR CLICK HERE: Market Watch, March 2014 3 Toronto Real Estate Board
- 4. Market Watch, March 2014 July 2010Page 3 4 Toronto Real Estate Board ALL HOME TYPES, MARCH 2014 CITY OF TORONTO MUNICIPAL BREAKDOWN Number of Sales Dollar Volume 1 Average Price 1 Median Price 1 New Listings 2 SNLR (Trend) 8 Active Listings 3 Mos. Inv. (Trend)9 Avg. SP/LP 4 Avg. DOM 5 TREB Total 8,081 $4,506,646,216 $557,684 $473,000 14,829 56.7% 16,543 2.4 99% 21 City of Toronto Total 2,978 $1,779,060,317 $597,401 $480,000 5,625 54.4% 6,656 2.6 101% 22 Toronto West 757 $392,725,394 $518,792 $465,200 1,382 56.6% 1,669 2.5 101% 23 Toronto W01 61 $36,242,403 $594,138 $530,000 81 53.9% 107 2.5 101% 20 Toronto W02 71 $48,160,439 $678,316 $670,000 114 67.6% 92 1.3 105% 19 Toronto W03 65 $30,487,349 $469,036 $493,000 113 67.0% 85 1.5 105% 14 Toronto W04 63 $27,766,322 $440,735 $449,000 105 61.7% 114 2.1 101% 25 Toronto W05 102 $40,090,429 $393,043 $416,000 193 56.7% 220 2.9 99% 27 Toronto W06 88 $38,952,863 $442,646 $427,500 243 47.4% 355 3.8 100% 30 Toronto W07 22 $19,110,353 $868,652 $823,950 31 68.9% 27 1.4 100% 14 Toronto W08 164 $100,772,260 $614,465 $502,750 292 53.9% 396 2.7 100% 24 Toronto W09 41 $23,939,620 $583,893 $625,000 73 58.2% 95 2.4 99% 18 Toronto W10 80 $27,203,356 $340,042 $369,950 137 54.5% 178 2.8 98% 30 Toronto Central 1,325 $942,141,947 $711,051 $483,000 2,897 48.7% 3,850 3.1 100% 24 Toronto C01 357 $175,133,418 $490,570 $412,500 916 43.5% 1,325 3.8 99% 27 Toronto C02 51 $58,120,488 $1,139,617 $900,000 124 46.3% 229 3.9 101% 25 Toronto C03 51 $53,961,718 $1,058,073 $710,000 73 57.8% 99 2.4 100% 22 Toronto C04 97 $116,201,290 $1,197,951 $1,150,000 164 51.7% 212 2.6 101% 21 Toronto C06 29 $18,359,804 $633,097 $489,900 82 44.9% 91 3.5 100% 24 Toronto C07 110 $70,729,924 $642,999 $475,000 225 48.0% 279 3.2 99% 24 Toronto C08 124 $61,192,589 $493,489 $432,500 267 53.3% 343 2.7 99% 23 Toronto C09 24 $44,241,575 $1,843,399 $1,535,000 52 54.1% 77 2.9 98% 19 Toronto C10 52 $36,642,270 $704,659 $659,950 77 60.7% 87 2.0 100% 22 Toronto C11 56 $38,386,550 $685,474 $385,950 57 65.1% 63 1.7 101% 21 Toronto C12 40 $72,932,166 $1,823,304 $1,549,950 75 42.2% 131 4.7 96% 29 Toronto C13 60 $36,789,400 $613,157 $469,575 112 63.2% 115 1.8 103% 20 Toronto C14 137 $82,759,101 $604,081 $413,900 401 43.3% 498 3.6 98% 24 Toronto C15 137 $76,691,654 $559,793 $472,000 272 52.7% 301 2.6 100% 24 Toronto East 896 $444,192,976 $495,751 $485,950 1,346 63.7% 1,137 1.7 103% 16 Toronto E01 83 $55,960,404 $674,222 $648,888 97 63.3% 84 1.4 107% 12 Toronto E02 70 $51,911,013 $741,586 $659,000 105 63.7% 80 1.4 103% 11 Toronto E03 100 $60,494,910 $604,949 $586,250 150 64.7% 89 1.2 106% 13 Toronto E04 104 $43,953,717 $422,632 $462,504 151 64.9% 127 1.7 102% 16 Toronto E05 86 $41,194,935 $479,011 $386,500 123 70.1% 94 1.5 103% 14 Toronto E06 47 $26,657,590 $567,183 $532,000 64 58.6% 49 1.6 102% 14 Toronto E07 76 $30,856,998 $406,013 $355,000 134 62.6% 138 2.0 104% 22 Toronto E08 60 $27,175,542 $452,926 $437,500 99 59.2% 92 2.2 99% 24 Toronto E09 119 $44,025,053 $369,958 $365,000 188 61.8% 175 2.0 100% 19 Toronto E10 68 $30,313,188 $445,782 $438,000 109 59.9% 96 2.1 100% 19 Toronto E11 83 $31,649,626 $381,321 $380,000 126 68.3% 113 1.7 100% 17 SUMMARY OF EXISTING HOME TRANSACTIONS
- 5. ALL HOME TYPES, YEAR-TO-DATE 2014 ALL TREB AREAS Number of Sales Dollar Volume 1 Average Price 1 Median Price 1 New Listings 2 Avg. SP/LP 4 Avg. DOM 5 TREB Total 17,897 $9,826,668,918 $549,068 $460,888 34,440 99% 26 Halton Region 1,521 $947,966,432 $623,252 $526,000 2,766 98% 26 Burlington 278 $155,633,683 $559,833 $492,050 466 98% 34 Halton Hills 205 $99,388,045 $484,820 $445,000 366 98% 25 Milton 414 $206,986,889 $499,968 $459,500 751 98% 21 Oakville 624 $485,957,815 $778,779 $662,500 1,183 98% 26 Peel Region 3,772 $1,753,348,480 $464,833 $425,000 7,355 98% 26 Brampton 1,613 $681,696,324 $422,626 $402,500 3,065 98% 26 Caledon 166 $96,138,840 $579,150 $520,000 356 97% 41 Mississauga 1,993 $975,513,316 $489,470 $445,000 3,934 98% 25 City of Toronto 6,646 $3,903,785,750 $587,389 $464,500 13,583 100% 26 York Region 3,368 $2,228,149,501 $661,565 $603,250 6,220 99% 25 Aurora 186 $115,561,731 $621,300 $571,250 318 98% 21 E. Gwillimbury 80 $46,495,990 $581,200 $495,000 116 98% 53 Georgina 171 $57,996,612 $339,161 $335,000 281 98% 32 King 61 $54,663,600 $896,125 $752,000 174 96% 47 Markham 921 $625,764,358 $679,440 $623,000 1,635 100% 23 Newmarket 289 $148,582,490 $514,126 $493,000 444 99% 24 Richmond Hill 721 $544,611,848 $755,356 $700,000 1,376 100% 21 Vaughan 792 $544,668,885 $687,713 $632,000 1,574 98% 24 Whitchurch-Stouffville 147 $89,803,988 $610,911 $555,000 302 98% 26 Durham Region 2,060 $786,313,341 $381,706 $351,000 3,480 99% 22 Ajax 371 $150,584,332 $405,888 $385,000 582 100% 17 Brock 42 $10,842,563 $258,156 $235,000 78 96% 78 Clarington 337 $110,411,259 $327,630 $309,000 585 99% 23 Oshawa 494 $149,891,832 $303,425 $277,000 852 99% 20 Pickering 261 $116,146,130 $445,004 $412,000 422 99% 21 Scugog 55 $20,681,714 $376,031 $364,200 119 97% 50 Uxbridge 75 $40,052,850 $534,038 $485,000 125 96% 43 Whitby 425 $187,702,662 $441,653 $394,900 717 99% 17 Dufferin County 110 $39,773,900 $361,581 $331,000 197 98% 35 Orangeville 110 $39,773,900 $361,581 $331,000 197 98% 35 Simcoe County 420 $167,331,513 $398,408 $365,495 839 97% 46 Adjala-Tosorontio 25 $12,456,900 $498,276 $439,000 51 97% 76 Bradford West Gwillimbury 120 $54,562,100 $454,684 $427,500 235 98% 31 Essa 62 $21,108,305 $340,457 $297,000 115 97% 44 Innisfil 94 $36,266,088 $385,809 $346,500 212 98% 51 New Tecumseth 119 $42,938,120 $360,825 $325,000 226 97% 53 ! TURN PAGE FOR CITY OF TORONTO TABLES OR CLICK HERE: SUMMARY OF EXISTING HOME TRANSACTIONS Market Watch, March 2014 July 2010Page 3 5 Toronto Real Estate Board
- 6. Market Watch, March 2014 July 2010Page 3 6 Toronto Real Estate Board ALL HOME TYPES, YEAR-TO-DATE 2014 CITY OF TORONTO MUNICIPAL BREAKDOWN Number of Sales Dollar Volume 1 Average Price 1 Median Price 1 New Listings 2 Avg. SP/LP 4 Avg. DOM 5 TREB Total 17,897 $9,826,668,918 $549,068 $460,888 34,440 99% 26 City of Toronto Total 6,646 $3,903,785,750 $587,389 $464,500 13,583 100% 26 Toronto West 1,626 $811,765,466 $499,241 $441,500 3,273 100% 29 Toronto W01 120 $65,445,558 $545,380 $415,000 221 100% 30 Toronto W02 141 $92,851,813 $658,523 $647,000 232 105% 19 Toronto W03 125 $57,600,025 $460,800 $475,000 226 103% 18 Toronto W04 143 $59,922,012 $419,035 $429,000 258 100% 27 Toronto W05 223 $83,373,287 $373,871 $395,000 404 98% 34 Toronto W06 205 $92,866,693 $453,008 $408,000 568 100% 37 Toronto W07 50 $39,464,653 $789,293 $708,489 76 102% 20 Toronto W08 340 $212,298,417 $624,407 $502,750 754 99% 28 Toronto W09 91 $46,466,920 $510,625 $575,000 184 99% 27 Toronto W10 188 $61,476,089 $327,000 $366,950 350 98% 33 Toronto Central 3,118 $2,182,141,633 $699,853 $470,000 7,212 99% 29 Toronto C01 824 $406,793,034 $493,681 $407,000 2,313 99% 32 Toronto C02 129 $139,026,175 $1,077,722 $845,000 329 101% 27 Toronto C03 114 $132,956,006 $1,166,281 $762,500 215 99% 27 Toronto C04 208 $250,483,191 $1,204,246 $1,150,000 448 100% 22 Toronto C06 72 $42,158,204 $585,531 $484,950 168 100% 27 Toronto C07 247 $151,652,944 $613,980 $442,000 536 98% 30 Toronto C08 311 $145,726,757 $468,575 $408,000 649 98% 30 Toronto C09 61 $91,772,137 $1,504,461 $1,425,000 139 99% 29 Toronto C10 115 $82,479,508 $717,213 $630,000 203 101% 21 Toronto C11 123 $84,362,532 $685,874 $327,500 197 102% 23 Toronto C12 85 $143,849,165 $1,692,343 $1,367,500 219 96% 35 Toronto C13 154 $101,543,106 $659,371 $475,000 271 102% 23 Toronto C14 371 $237,945,619 $641,363 $443,000 917 98% 30 Toronto C15 304 $171,393,255 $563,794 $439,000 608 100% 26 Toronto East 1,902 $909,878,651 $478,380 $469,950 3,098 102% 20 Toronto E01 186 $117,972,591 $634,261 $631,000 293 106% 15 Toronto E02 146 $107,022,380 $733,030 $650,500 238 104% 14 Toronto E03 191 $117,172,390 $613,468 $585,000 309 105% 16 Toronto E04 232 $98,115,388 $422,911 $456,000 361 101% 20 Toronto E05 191 $83,620,709 $437,805 $350,000 300 102% 20 Toronto E06 96 $52,378,563 $545,610 $493,500 155 101% 15 Toronto E07 158 $62,073,742 $392,872 $345,000 302 103% 24 Toronto E08 118 $48,818,841 $413,719 $408,000 197 99% 27 Toronto E09 263 $93,201,618 $354,379 $338,000 435 100% 24 Toronto E10 133 $60,315,738 $453,502 $446,500 220 101% 25 Toronto E11 188 $69,186,691 $368,014 $358,450 288 100% 21 SUMMARY OF EXISTING HOME TRANSACTIONS
- 7. Market Watch, March 2014 Industrial Leasing July 2010Page 3 7 Toronto Real Estate Board ALL TREB AREAS Sales 1 Dollar Volume 1 Average Price 1 Median Price 1 New Listings 2 Active Listings 3 Avg. SP/LP 4 Avg. DOM 5 TREB Total 3,937 $2,793,250,021 $709,487 $605,000 7,184 7,745 99% 20- - - - - - - - Halton Region 412 $330,756,541 $802,807 $657,000 766 940 98% 24 Burlington 70 $50,482,710 $721,182 $637,450 138 169 98% 26 Halton Hills 67 $38,078,250 $568,332 $540,000 131 175 98% 23 Milton 97 $62,839,600 $647,831 $576,500 182 192 98% 25 Oakville 178 $179,355,981 $1,007,618 $818,250 315 404 97% 24- - - - - - - - Peel Region 768 $462,077,803 $601,664 $557,500 1,574 1,754 98% 20 Brampton 407 $203,397,974 $499,749 $479,000 837 884 98% 21 Caledon 47 $29,397,840 $625,486 $560,000 112 222 97% 47 Mississauga 314 $229,281,989 $730,197 $650,000 625 648 98% 16- - - - - - - - City of Toronto 1,011 $908,213,777 $898,332 $708,000 1,705 1,560 101% 16 - - - - - - - - York Region 905 $738,742,120 $816,290 $750,000 1,630 1,754 99% 20 Aurora 56 $40,433,371 $722,024 $650,500 86 100 98% 16 E. Gwillimbury 21 $14,932,300 $711,062 $678,000 31 60 98% 50 Georgina 67 $24,177,050 $360,851 $365,000 104 142 98% 28 King 26 $26,990,400 $1,038,092 $895,250 65 132 95% 52 Markham 221 $198,723,896 $899,203 $799,800 354 279 100% 15 Newmarket 83 $49,882,550 $600,995 $563,000 141 130 99% 20 Richmond Hill 191 $177,098,242 $927,216 $851,500 363 329 101% 14 Vaughan 199 $176,542,811 $887,150 $823,800 387 423 98% 21 Whitchurch-Stouffville 41 $29,961,500 $730,768 $632,000 99 159 98% 22- - - - - - - - Durham Region 664 $279,576,992 $421,050 $405,000 1,161 1,123 99% 19 Ajax 113 $53,343,888 $472,070 $460,000 189 129 100% 13 Brock 14 $3,851,355 $275,097 $290,000 26 66 95% 80 Clarington 111 $39,815,250 $358,696 $347,100 204 205 99% 20 Oshawa 159 $52,801,182 $332,083 $308,000 292 236 99% 14 Pickering 73 $40,082,237 $549,072 $515,000 116 110 99% 16 Scugog 25 $9,402,714 $376,109 $358,000 57 89 98% 45 Uxbridge 28 $15,643,900 $558,711 $503,500 34 90 98% 37 Whitby 141 $64,636,467 $458,415 $435,000 243 198 100% 15- - - - - - - - Dufferin County 33 $13,517,000 $409,606 $356,000 60 107 98% 29 Orangeville 33 $13,517,000 $409,606 $356,000 60 107 98% 29- - - - - - - - Simcoe County 144 $60,365,788 $419,207 $384,000 288 507 98% 40 Adjala-Tosorontio 6 $3,268,000 $544,667 $447,500 19 57 96% 71 Bradford West Gwillimbury 42 $20,834,000 $496,048 $479,250 79 109 98% 34 Essa 14 $5,073,300 $362,379 $378,500 35 63 98% 43 Innisfil 41 $15,986,388 $389,912 $338,000 79 151 99% 39 New Tecumseth 41 $15,204,100 $370,832 $354,000 76 127 97% 42 SUMMARY OF EXISTING HOME TRANSACTIONS DETACHED HOUSES, MARCH 2014 ! TURN PAGE FOR CITY OF TORONTO TABLES OR CLICK HERE:
- 8. Market Watch, March 2014 Industrial Leasing July 2010Page 3 8 Toronto Real Estate Board CITY OF TORONTO MUNICIPAL BREAKDOWN Sales1 Dollar Volume1 Average Price1 Median Price1 New Listings2 Active Listings3 Avg. SP/LP4 Avg. DOM5 TREB Total 3,937 $2,793,250,021 $709,487 $605,000 7,184 7,745 99% 20 City of Toronto Total 1,011 $908,213,777 $898,332 $708,000 1,705 1,560 101% 16 Toronto West 302 $220,489,299 $730,097 $622,550 493 461 101% 16 Toronto W01 11 $11,624,100 $1,056,736 $942,000 16 16 101% 14 Toronto W02 28 $25,020,600 $893,593 $875,000 45 25 106% 13 Toronto W03 30 $15,225,049 $507,502 $494,000 49 42 104% 15 Toronto W04 34 $19,296,000 $567,529 $521,500 49 42 103% 20 Toronto W05 27 $15,857,786 $587,325 $580,000 63 60 99% 27 Toronto W06 28 $15,451,463 $551,838 $518,500 38 26 102% 16 Toronto W07 16 $16,150,175 $1,009,386 $925,900 23 21 100% 15 Toronto W08 68 $66,891,950 $983,705 $806,250 111 138 100% 17 Toronto W09 24 $17,528,720 $730,363 $699,300 40 34 100% 11 Toronto W10 36 $17,443,456 $484,540 $467,500 59 57 99% 14 Toronto Central 313 $439,417,320 $1,403,889 $1,175,000 632 709 100% 18 Toronto C01 8 $7,555,686 $944,461 $815,038 8 5 106% 12 Toronto C02 12 $17,243,000 $1,436,917 $1,212,500 23 26 106% 8 Toronto C03 26 $38,051,680 $1,463,526 $1,265,500 44 59 99% 24 Toronto C04 73 $105,123,990 $1,440,055 $1,298,000 128 162 101% 14 Toronto C06 14 $13,260,504 $947,179 $870,002 37 30 100% 11 Toronto C07 38 $41,115,218 $1,081,979 $955,000 94 99 100% 18 Toronto C08 1 $1,200,000 $1,200,000 $1,200,000 1 2 100% 189 Toronto C09 10 $25,177,000 $2,517,700 $2,572,500 27 43 96% 23 Toronto C10 11 $11,795,500 $1,072,318 $990,000 15 17 100% 23 Toronto C11 19 $26,781,250 $1,409,539 $1,325,000 19 16 101% 16 Toronto C12 26 $64,064,166 $2,464,006 $2,474,000 49 87 96% 32 Toronto C13 15 $18,223,650 $1,214,910 $1,127,000 36 30 105% 10 Toronto C14 29 $37,978,876 $1,309,616 $1,185,000 96 89 98% 22 Toronto C15 31 $31,846,800 $1,027,316 $878,000 55 44 101% 13 Toronto East 396 $248,307,158 $627,038 $570,500 580 390 103% 13 Toronto E01 19 $16,077,551 $846,187 $800,888 23 20 105% 13 Toronto E02 23 $22,316,723 $970,292 $975,000 42 36 102% 12 Toronto E03 64 $41,891,788 $654,559 $617,550 98 56 104% 12 Toronto E04 49 $26,434,917 $539,488 $525,000 67 38 104% 12 Toronto E05 29 $21,604,437 $744,981 $785,000 35 21 105% 7 Toronto E06 38 $22,643,100 $595,871 $539,400 56 35 102% 12 Toronto E07 18 $11,585,788 $643,655 $645,500 31 23 105% 12 Toronto E08 31 $20,242,442 $652,982 $498,000 53 46 99% 20 Toronto E09 51 $25,329,175 $496,650 $495,000 67 33 102% 14 Toronto E10 41 $22,083,988 $538,634 $522,000 70 63 101% 19 Toronto E11 33 $18,097,249 $548,401 $550,000 38 19 100% 13 DETACHED HOUSES, MARCH 2014 SUMMARY OF EXISTING HOME TRANSACTIONS
- 9. Industrial Leasing Toronto Real Estate Board ALL TREB AREAS Sales 1 Dollar Volume 1 Average Price 1 Median Price 1 New Listings 2 Active Listings 3 Avg. SP/LP 4 Avg. DOM 5 TREB Total 859 $442,270,558 $514,867 $481,000 1,287 786 102% 13- - - - - - - - Halton Region 46 $20,993,100 $456,372 $441,000 78 50 99% 17 Burlington 6 $2,632,500 $438,750 $451,500 7 7 100% 44 Halton Hills 7 $2,848,900 $406,986 $400,000 10 4 100% 11 Milton 26 $11,522,700 $443,181 $443,500 49 26 99% 12 Oakville 7 $3,989,000 $569,857 $553,000 12 13 98% 22- - - - - - - - Peel Region 301 $130,019,028 $431,957 $425,000 480 318 99% 15 Brampton 155 $59,310,710 $382,650 $377,000 252 185 99% 17 Caledon 10 $4,235,400 $423,540 $426,000 8 5 98% 27 Mississauga 136 $66,472,918 $488,771 $486,500 220 128 100% 12- - - - - - - - City of Toronto 303 $199,504,136 $658,429 $616,000 466 265 106% 11 - - - - - - - - York Region 130 $68,258,487 $525,065 $529,450 162 93 100% 12 Aurora 7 $3,336,200 $476,600 $481,500 9 5 99% 9 E. Gwillimbury 4 $1,927,990 $481,998 $475,495 - 1 99% 58 Georgina 1 $330,000 $330,000 $330,000 1 - 100% 3 King - - - - 1 1 - - Markham 30 $16,416,088 $547,203 $543,000 51 23 102% 8 Newmarket 20 $8,436,300 $421,815 $423,750 22 13 100% 14 Richmond Hill 15 $8,745,400 $583,027 $580,000 18 16 101% 11 Vaughan 47 $26,500,019 $563,830 $540,000 57 29 100% 10 Whitchurch-Stouffville 6 $2,566,490 $427,748 $427,500 3 5 99% 15- - - - - - - - Durham Region 63 $18,863,567 $299,422 $299,900 85 42 101% 9 Ajax 16 $5,941,777 $371,361 $372,500 18 11 101% 9 Brock - - - - - - - - Clarington 6 $1,540,900 $256,817 $251,950 6 1 102% 6 Oshawa 25 $6,022,400 $240,896 $233,000 38 17 101% 8 Pickering 6 $2,210,700 $368,450 $359,350 12 8 103% 11 Scugog 1 $264,900 $264,900 $264,900 1 - 100% 8 Uxbridge 1 $340,000 $340,000 $340,000 - - 99% 32 Whitby 8 $2,542,890 $317,861 $307,500 10 5 100% 12- - - - - - - - Dufferin County 9 $2,418,000 $268,667 $257,000 7 7 97% 24 Orangeville 9 $2,418,000 $268,667 $257,000 7 7 97% 24- - - - - - - - Simcoe County 7 $2,214,240 $316,320 $289,990 9 11 99% 21 Adjala-Tosorontio - - - - - - - - Bradford West Gwillimbury 3 $1,134,000 $378,000 $385,000 4 5 99% 23 Essa 2 $562,250 $281,125 $281,125 2 2 100% 15 Innisfil - - - - - - - - New Tecumseth 2 $517,990 $258,995 $258,995 3 4 99% 23 ! TURN PAGE FOR CITY OF TORONTO TABLES OR CLICK HERE: SUMMARY OF EXISTING HOME TRANSACTIONS SEMI-DETACHED HOUSES, MARCH 2014 July 2010Page 3 Market Watch, March 2014 9
- 10. Industrial Leasing July 2010Page 3 Toronto Real Estate Board Market Watch, March 2014 CITY OF TORONTO MUNICIPAL BREAKDOWN Sales1 Dollar Volume1 Average Price1 Median Price1 New Listings2 Active Listings3 Avg. SP/LP4 Avg. DOM5 TREB Total 859 $442,270,558 $514,867 $481,000 1,287 786 102% 13 City of Toronto Total 303 $199,504,136 $658,429 $616,000 466 265 106% 11 Toronto West 86 $50,566,315 $587,980 $555,950 164 112 104% 15 Toronto W01 11 $8,570,023 $779,093 $800,000 10 7 103% 9 Toronto W02 17 $12,300,149 $723,538 $727,000 29 19 108% 7 Toronto W03 20 $10,363,800 $518,190 $530,500 42 21 107% 10 Toronto W04 7 $3,228,000 $461,143 $461,000 8 5 95% 33 Toronto W05 23 $11,357,943 $493,824 $475,993 55 49 100% 24 Toronto W06 4 $2,470,000 $617,500 $608,500 7 1 105% 9 Toronto W07 - - - - - - - - Toronto W08 3 $1,907,500 $635,833 $695,000 4 2 109% 10 Toronto W09 - - - - 2 2 - - Toronto W10 1 $368,900 $368,900 $368,900 7 6 100% 4 Toronto Central 86 $69,233,388 $805,039 $719,500 140 82 105% 8 Toronto C01 15 $12,759,800 $850,653 $800,000 19 12 102% 7 Toronto C02 8 $10,673,000 $1,334,125 $1,174,500 18 17 103% 8 Toronto C03 12 $8,879,700 $739,975 $686,350 16 8 108% 9 Toronto C04 3 $2,911,000 $970,333 $999,000 7 4 114% 6 Toronto C06 - - - - 2 1 - - Toronto C07 5 $3,025,500 $605,100 $570,000 8 5 100% 11 Toronto C08 5 $4,795,000 $959,000 $955,000 9 8 103% 17 Toronto C09 1 $860,000 $860,000 $860,000 4 5 109% 2 Toronto C10 6 $4,859,500 $809,917 $818,000 8 5 108% 14 Toronto C11 2 $1,826,000 $913,000 $913,000 2 1 115% 8 Toronto C12 2 $1,497,500 $748,750 $748,750 6 1 103% 9 Toronto C13 7 $4,486,000 $640,857 $600,000 9 5 110% 6 Toronto C14 - - - - - - - - Toronto C15 20 $12,660,388 $633,019 $615,625 32 10 104% 6 Toronto East 131 $79,704,433 $608,431 $588,080 162 71 108% 10 Toronto E01 40 $27,390,065 $684,752 $677,500 34 13 111% 10 Toronto E02 29 $19,840,000 $684,138 $651,000 41 15 106% 8 Toronto E03 24 $14,718,810 $613,284 $611,250 31 13 111% 9 Toronto E04 7 $3,179,000 $454,143 $460,000 11 6 103% 16 Toronto E05 5 $2,802,080 $560,416 $579,000 9 6 107% 6 Toronto E06 4 $1,794,990 $448,748 $442,495 3 2 100% 24 Toronto E07 4 $2,370,488 $592,622 $582,400 9 5 116% 4 Toronto E08 1 $444,000 $444,000 $444,000 1 1 99% 1 Toronto E09 4 $1,692,900 $423,225 $425,000 5 1 102% 8 Toronto E10 5 $1,940,000 $388,000 $375,000 8 3 102% 6 Toronto E11 8 $3,532,100 $441,513 $478,750 10 6 104% 11 SUMMARY OF EXISTING HOME TRANSACTIONS SEMI-DETACHED HOUSES, MARCH 2014 10
- 11. Industrial Leasing July 2010Page 3 Toronto Real Estate Board Market Watch, March 2014 ALL TREB AREAS Sales 1 Dollar Volume 1 Average Price 1 Median Price 1 New Listings 2 Active Listings 3 Avg. SP/LP 4 Avg. DOM 5 TREB Total 602 $224,182,835 $372,397 $350,000 919 916 99% 19- - - - - - - - Halton Region 48 $17,574,018 $366,125 $344,500 67 85 98% 20 Burlington 16 $5,709,900 $356,869 $320,000 19 26 98% 19 Halton Hills 7 $1,858,000 $265,429 $260,000 5 2 99% 22 Milton 3 $737,000 $245,667 $245,000 10 13 99% 17 Oakville 22 $9,269,118 $421,324 $402,500 33 44 98% 21- - - - - - - - Peel Region 224 $79,662,827 $355,638 $353,500 319 292 99% 19 Brampton 48 $13,697,200 $285,358 $281,500 71 82 98% 23 Caledon - - - - - - - - Mississauga 176 $65,965,627 $374,805 $368,750 248 210 99% 17- - - - - - - - City of Toronto 191 $78,660,604 $411,836 $371,000 325 359 100% 20 - - - - - - - - York Region 77 $32,858,686 $426,736 $429,000 117 98 101% 15 Aurora 5 $2,161,286 $432,257 $350,000 12 15 101% 26 E. Gwillimbury - - - - - - - - Georgina 1 $254,500 $254,500 $254,500 1 1 100% 11 King - - - - - 1 - - Markham 36 $15,724,200 $436,783 $438,400 54 43 101% 12 Newmarket 5 $2,130,000 $426,000 $348,000 6 5 97% 25 Richmond Hill 16 $6,515,400 $407,213 $407,950 22 17 100% 18 Vaughan 12 $5,563,300 $463,608 $479,000 21 15 102% 10 Whitchurch-Stouffville 2 $510,000 $255,000 $255,000 1 1 98% 23- - - - - - - - Durham Region 58 $14,592,800 $251,600 $258,500 82 72 99% 19 Ajax 8 $2,476,500 $309,563 $303,250 12 10 100% 13 Brock 1 $161,000 $161,000 $161,000 1 2 96% 28 Clarington 5 $1,075,900 $215,180 $210,000 11 6 100% 14 Oshawa 14 $2,582,700 $184,479 $179,550 25 29 99% 22 Pickering 19 $5,484,300 $288,647 $295,000 17 11 99% 19 Scugog - - - - - - - - Uxbridge 1 $285,000 $285,000 $285,000 2 5 95% 62 Whitby 10 $2,527,400 $252,740 $254,500 14 9 100% 14- - - - - - - - Dufferin County 2 $431,900 $215,950 $215,950 6 6 99% 18 Orangeville 2 $431,900 $215,950 $215,950 6 6 99% 18- - - - - - - - Simcoe County 2 $402,000 $201,000 $201,000 3 4 98% 67 Adjala-Tosorontio - - - - - - - - Bradford West Gwillimbury - - - - 1 1 - - Essa - - - - - - - - Innisfil - - - - - - - - New Tecumseth 2 $402,000 $201,000 $201,000 2 3 98% 67 ! TURN PAGE FOR CITY OF TORONTO TABLES OR CLICK HERE: SUMMARY OF EXISTING HOME TRANSACTIONS CONDOMINIUM TOWNHOUSES, MARCH 2014 11
- 12. Industrial Leasing July 2010Page 3 Toronto Real Estate Board Market Watch, March 2014 12 CITY OF TORONTO MUNICIPAL BREAKDOWN Sales1 Dollar Volume1 Average Price1 Median Price1 New Listings2 Active Listings3 Avg. SP/LP4 Avg. DOM5 TREB Total 602 $224,182,835 $372,397 $350,000 919 916 99% 19 City of Toronto Total 191 $78,660,604 $411,836 $371,000 325 359 100% 20 Toronto West 55 $18,699,500 $339,991 $307,900 77 103 99% 27 Toronto W01 6 $2,452,000 $408,667 $355,000 4 1 100% 16 Toronto W02 6 $2,604,100 $434,017 $447,500 11 5 101% 34 Toronto W03 2 $505,000 $252,500 $252,500 3 4 101% 20 Toronto W04 9 $2,635,900 $292,878 $281,000 12 10 99% 24 Toronto W05 12 $2,880,000 $240,000 $257,000 16 31 97% 35 Toronto W06 1 $488,000 $488,000 $488,000 3 8 98% 11 Toronto W07 - - - - - - - - Toronto W08 9 $3,078,500 $342,056 $342,000 13 14 97% 24 Toronto W09 4 $2,547,000 $636,750 $712,250 6 12 99% 32 Toronto W10 6 $1,509,000 $251,500 $250,000 9 18 99% 22 Toronto Central 67 $35,998,896 $537,297 $477,000 130 134 100% 15 Toronto C01 23 $10,761,275 $467,882 $469,000 36 38 101% 14 Toronto C02 1 $1,600,000 $1,600,000 $1,600,000 1 4 97% 55 Toronto C03 - - - - - 4 - - Toronto C04 - - - - - 1 - - Toronto C06 1 $489,900 $489,900 $489,900 - 2 100% 98 Toronto C07 4 $2,009,000 $502,250 $525,000 10 9 98% 15 Toronto C08 3 $1,779,000 $593,000 $670,000 5 7 101% 14 Toronto C09 2 $2,970,000 $1,485,000 $1,485,000 1 - 100% 5 Toronto C10 4 $2,736,170 $684,043 $683,500 3 2 97% 21 Toronto C11 2 $620,000 $310,000 $310,000 - - 97% 14 Toronto C12 3 $1,810,100 $603,367 $690,000 8 10 102% 14 Toronto C13 3 $1,652,000 $550,667 $599,000 8 7 103% 6 Toronto C14 6 $3,480,401 $580,067 $588,944 25 24 100% 9 Toronto C15 15 $6,091,050 $406,070 $371,000 33 26 102% 14 Toronto East 69 $23,962,208 $347,278 $335,000 118 122 100% 18 Toronto E01 2 $1,029,300 $514,650 $514,650 5 8 103% 11 Toronto E02 8 $4,737,390 $592,174 $565,950 5 5 100% 16 Toronto E03 - - - - 1 2 - - Toronto E04 8 $2,909,700 $363,713 $354,500 17 13 99% 24 Toronto E05 17 $5,917,018 $348,060 $347,000 19 13 101% 13 Toronto E06 - - - - - - - - Toronto E07 4 $1,616,000 $404,000 $384,500 7 4 108% 14 Toronto E08 6 $1,996,000 $332,667 $353,000 14 12 101% 12 Toronto E09 6 $1,502,000 $250,333 $252,500 13 14 96% 14 Toronto E10 8 $1,785,900 $223,238 $255,000 14 19 97% 28 Toronto E11 10 $2,468,900 $246,890 $242,000 23 32 98% 24 SUMMARY OF EXISTING HOME TRANSACTIONS CONDOMINIUM TOWNHOUSES, MARCH 2014
- 13. Industrial Leasing July 2010Page 3 Toronto Real Estate Board Market Watch, March 2014 ALL TREB AREAS Sales 1 Dollar Volume 1 Average Price 1 Median Price 1 New Listings 2 Active Listings 3 Avg. SP/LP 4 Avg. DOM 5 TREB Total 1,885 $673,268,721 $357,172 $317,000 4,218 6,231 98% 30- - - - - - - - Halton Region 57 $16,580,799 $290,891 $275,000 101 171 98% 37 Burlington 20 $5,520,499 $276,025 $259,500 28 49 98% 48 Halton Hills 3 $640,000 $213,333 $240,000 3 2 98% 64 Milton 9 $2,552,800 $283,644 $285,000 21 27 98% 28 Oakville 25 $7,867,500 $314,700 $275,000 49 93 98% 27- - - - - - - - Peel Region 256 $66,350,206 $259,180 $247,750 662 956 97% 31 Brampton 42 $8,598,700 $204,731 $193,250 91 118 97% 37 Caledon - - - - 1 6 - - Mississauga 214 $57,751,506 $269,867 $257,500 570 832 97% 30- - - - - - - - City of Toronto 1,331 $512,255,828 $384,865 $340,000 2,941 4,325 98% 29 - - - - - - - - York Region 186 $65,503,188 $352,168 $327,000 444 696 98% 34 Aurora 10 $4,258,500 $425,850 $395,000 9 20 97% 26 E. Gwillimbury - - - - 1 1 - - Georgina 2 $443,500 $221,750 $221,750 1 6 99% 26 King 2 $849,800 $424,900 $424,900 2 10 100% 41 Markham 65 $22,872,559 $351,886 $332,500 161 247 98% 36 Newmarket 5 $1,443,400 $288,680 $297,000 3 4 98% 27 Richmond Hill 43 $12,869,680 $299,295 $295,000 118 181 97% 35 Vaughan 58 $22,360,749 $385,530 $349,000 147 218 98% 33 Whitchurch-Stouffville 1 $405,000 $405,000 $405,000 2 9 98% 70- - - - - - - - Durham Region 52 $11,744,700 $225,860 $202,250 63 60 98% 22 Ajax 9 $2,068,000 $229,778 $218,000 7 7 98% 33 Brock - - - - - - - - Clarington 12 $2,387,500 $198,958 $188,500 9 5 98% 22 Oshawa 12 $2,286,300 $190,525 $170,200 18 12 97% 14 Pickering 12 $3,309,400 $275,783 $286,500 12 11 98% 21 Scugog - - - - 1 3 - - Uxbridge 1 $186,000 $186,000 $186,000 1 3 96% 6 Whitby 6 $1,507,500 $251,250 $255,000 15 19 98% 26- - - - - - - - Dufferin County 1 $299,000 $299,000 $299,000 - 5 100% 20 Orangeville 1 $299,000 $299,000 $299,000 - 5 100% 20- - - - - - - - Simcoe County 2 $535,000 $267,500 $267,500 7 18 96% 158 Adjala-Tosorontio - - - - - - - - Bradford West Gwillimbury 1 $235,000 $235,000 $235,000 2 3 96% 15 Essa - - - - - - - - Innisfil - - - - - - - - New Tecumseth 1 $300,000 $300,000 $300,000 5 15 96% 301 ! TURN PAGE FOR CITY OF TORONTO TABLES OR CLICK HERE: SUMMARY OF EXISTING HOME TRANSACTIONS CONDOMINIUM APARTMENT, MARCH 2014 13
- 14. Industrial Leasing July 2010Page 3 Toronto Real Estate Board Market Watch, March 2014 14 CITY OF TORONTO MUNICIPAL BREAKDOWN Sales1 Dollar Volume1 Average Price1 Median Price1 New Listings2 Active Listings3 Avg. SP/LP4 Avg. DOM5 TREB Total 1,885 $673,268,721 $357,172 $317,000 4,218 6,231 98% 30 City of Toronto Total 1,331 $512,255,828 $384,865 $340,000 2,941 4,325 98% 29 Toronto West 276 $83,044,302 $300,885 $285,000 597 958 98% 34 Toronto W01 26 $9,452,280 $363,549 $340,445 48 81 98% 28 Toronto W02 17 $6,438,090 $378,711 $355,000 25 41 100% 33 Toronto W03 10 $2,803,500 $280,350 $277,750 17 17 97% 23 Toronto W04 12 $2,036,422 $169,702 $175,500 33 55 96% 35 Toronto W05 32 $6,863,700 $214,491 $171,000 44 68 97% 29 Toronto W06 52 $18,756,600 $360,704 $316,250 188 313 97% 40 Toronto W07 1 $340,000 $340,000 $340,000 3 4 99% 11 Toronto W08 81 $26,767,310 $330,461 $304,250 161 240 98% 30 Toronto W09 12 $3,448,900 $287,408 $292,000 23 46 96% 28 Toronto W10 33 $6,137,500 $185,985 $178,000 55 93 96% 51 Toronto Central 815 $366,319,237 $449,471 $385,000 1,935 2,853 98% 29 Toronto C01 294 $130,827,545 $444,992 $389,500 835 1,262 98% 30 Toronto C02 28 $26,413,600 $943,343 $752,900 77 176 98% 37 Toronto C03 12 $6,772,838 $564,403 $532,500 11 22 100% 31 Toronto C04 15 $5,710,500 $380,700 $309,000 25 35 97% 35 Toronto C06 14 $4,609,400 $329,243 $311,500 42 57 97% 32 Toronto C07 59 $21,968,900 $372,354 $369,700 110 163 98% 30 Toronto C08 110 $49,784,689 $452,588 $415,000 242 316 98% 22 Toronto C09 10 $14,624,575 $1,462,458 $1,066,000 15 19 102% 18 Toronto C10 28 $15,121,200 $540,043 $427,500 48 61 98% 23 Toronto C11 33 $9,159,300 $277,555 $260,000 36 46 99% 25 Toronto C12 9 $5,560,400 $617,822 $529,000 12 31 98% 28 Toronto C13 33 $10,965,050 $332,274 $318,000 56 70 98% 30 Toronto C14 100 $39,217,824 $392,178 $365,750 277 376 98% 26 Toronto C15 70 $25,583,416 $365,477 $346,839 149 219 98% 37 Toronto East 240 $62,892,289 $262,051 $245,000 409 514 98% 26 Toronto E01 14 $6,146,100 $439,007 $397,950 27 38 99% 15 Toronto E02 8 $3,788,900 $473,613 $455,500 14 22 102% 19 Toronto E03 9 $2,385,100 $265,011 $195,000 17 17 99% 27 Toronto E04 31 $6,686,000 $215,677 $209,000 43 59 98% 25 Toronto E05 31 $8,525,600 $275,019 $286,000 52 52 98% 22 Toronto E06 5 $2,219,500 $443,900 $425,500 5 9 99% 22 Toronto E07 39 $9,808,734 $251,506 $250,000 76 103 98% 33 Toronto E08 20 $3,643,100 $182,155 $166,500 27 32 96% 36 Toronto E09 57 $15,105,978 $265,017 $263,000 101 124 98% 26 Toronto E10 4 $728,900 $182,225 $179,000 6 8 98% 27 Toronto E11 22 $3,854,377 $175,199 $178,250 41 50 97% 25 SUMMARY OF EXISTING HOME TRANSACTIONS CONDOMINIUM APARTMENT, MARCH 2014
- 15. Industrial Leasing July 2010Page 3 Toronto Real Estate Board Market Watch, March 2014 ALL TREB AREAS Sales 1 Dollar Volume 1 Average Price 1 Median Price 1 New Listings 2 Active Listings 3 Avg. SP/LP 4 Avg. DOM 5 TREB Total 114 $54,734,506 $480,127 $479,000 202 114 102% 9- - - - - - - - Halton Region 3 $1,350,600 $450,200 $454,600 13 12 98% 16 Burlington - - - - 2 2 - - Halton Hills - - - - 1 1 - - Milton 2 $916,600 $458,300 $458,300 3 3 97% 22 Oakville 1 $434,000 $434,000 $434,000 7 6 99% 5- - - - - - - - Peel Region 13 $5,794,600 $445,738 $455,000 24 15 100% 7 Brampton 5 $2,042,100 $408,420 $419,200 11 8 101% 5 Caledon 1 $445,000 $445,000 $445,000 1 - 99% 6 Mississauga 7 $3,307,500 $472,500 $479,000 12 7 100% 8- - - - - - - - City of Toronto 14 $7,640,306 $545,736 $545,500 17 8 102% 9 - - - - - - - - York Region 44 $26,876,400 $610,827 $605,000 82 44 103% 9 Aurora 2 $1,100,000 $550,000 $550,000 2 1 98% 12 E. Gwillimbury - - - - - - - - Georgina 2 $697,500 $348,750 $348,750 2 1 99% 16 King - - - - - - - - Markham 33 $20,810,900 $630,633 $615,000 55 26 104% 8 Newmarket - - - - - - - - Richmond Hill 2 $1,204,000 $602,000 $602,000 15 12 102% 16 Vaughan 5 $3,064,000 $612,800 $608,500 8 4 101% 9 Whitchurch-Stouffville - - - - - - - -- - - - - - - - Durham Region 31 $10,216,200 $329,555 $327,000 48 21 100% 8 Ajax - - - - 3 3 - - Brock - - - - - - - - Clarington 14 $4,094,900 $292,493 $284,500 25 12 100% 8 Oshawa 3 $849,000 $283,000 $285,000 3 3 102% 6 Pickering 3 $1,148,500 $382,833 $381,500 3 - 103% 6 Scugog - - - - - - - - Uxbridge 1 $415,000 $415,000 $415,000 - - 99% 19 Whitby 10 $3,708,800 $370,880 $369,200 14 3 99% 9- - - - - - - - Dufferin County 2 $650,500 $325,250 $325,250 - - 97% 34 Orangeville 2 $650,500 $325,250 $325,250 - - 97% 34- - - - - - - - Simcoe County 7 $2,205,900 $315,129 $337,000 18 14 99% 9 Adjala-Tosorontio - - - - - - - - Bradford West Gwillimbury 4 $1,405,900 $351,475 $349,500 7 5 99% 9 Essa 3 $800,000 $266,667 $260,000 9 7 98% 9 Innisfil - - - - - - - - New Tecumseth - - - - 2 2 - - SUMMARY OF EXISTING HOME TRANSACTIONS LINK, MARCH 2014 ! TURN PAGE FOR CITY OF TORONTO TABLES OR CLICK HERE: 15
- 16. Industrial Leasing July 2010Page 3 Toronto Real Estate Board Market Watch, March 2014 16 CITY OF TORONTO MUNICIPAL BREAKDOWN Sales1 Dollar Volume1 Average Price1 Median Price1 New Listings2 Active Listings3 Avg. SP/LP4 Avg. DOM5 TREB Total 114 $54,734,506 $480,127 $479,000 202 114 102% 9 City of Toronto Total 14 $7,640,306 $545,736 $545,500 17 8 102% 9 Toronto West - - - - 4 3 - - Toronto W01 - - - - - - - - Toronto W02 - - - - - - - - Toronto W03 - - - - - - - - Toronto W04 - - - - - - - - Toronto W05 - - - - 1 1 - - Toronto W06 - - - - - - - - Toronto W07 - - - - - - - - Toronto W08 - - - - - - - - Toronto W09 - - - - 1 1 - - Toronto W10 - - - - 2 1 - - Toronto Central 3 $1,812,506 $604,169 $617,506 3 2 100% 7 Toronto C01 - - - - - - - - Toronto C02 - - - - - - - - Toronto C03 - - - - - - - - Toronto C04 - - - - - - - - Toronto C06 - - - - - - - - Toronto C07 2 $1,302,506 $651,253 $651,253 1 1 100% 10 Toronto C08 - - - - - - - - Toronto C09 - - - - - - - - Toronto C10 - - - - - - - - Toronto C11 - - - - - - - - Toronto C12 - - - - - - - - Toronto C13 - - - - - - - - Toronto C14 - - - - - - - - Toronto C15 1 $510,000 $510,000 $510,000 2 1 98% 0 Toronto East 11 $5,827,800 $529,800 $521,000 10 3 103% 10 Toronto E01 1 $518,000 $518,000 $518,000 - - 93% 18 Toronto E02 - - - - - - - - Toronto E03 - - - - - - - - Toronto E04 - - - - - - - - Toronto E05 3 $1,884,800 $628,267 $643,000 3 - 104% 11 Toronto E06 - - - - - - - - Toronto E07 6 $3,065,000 $510,833 $505,500 5 2 103% 9 Toronto E08 - - - - - - - - Toronto E09 - - - - - - - - Toronto E10 1 $360,000 $360,000 $360,000 1 - 101% 4 Toronto E11 - - - - 1 1 - - SUMMARY OF EXISTING HOME TRANSACTIONS LINK, MARCH 2014
- 17. Industrial Leasing July 2010Page 3 Toronto Real Estate Board Market Watch, March 2014 ALL TREB AREAS Sales 1 Dollar Volume 1 Average Price 1 Median Price 1 New Listings 2 Active Listings 3 Avg. SP/LP 4 Avg. DOM 5 TREB Total 660 $310,511,475 $470,472 $445,000 983 685 101% 13- - - - - - - - Halton Region 114 $50,049,400 $439,030 $428,450 182 132 100% 13 Burlington 12 $5,046,300 $420,525 $428,450 17 15 98% 18 Halton Hills 6 $2,325,700 $387,617 $389,350 6 4 101% 8 Milton 58 $23,298,700 $401,702 $405,500 85 54 99% 12 Oakville 38 $19,378,700 $509,966 $501,500 74 59 100% 13- - - - - - - - Peel Region 124 $50,167,320 $404,575 $400,050 196 139 99% 14 Brampton 76 $28,445,908 $374,288 $372,000 132 98 99% 14 Caledon 6 $2,368,100 $394,683 $395,000 10 10 100% 17 Mississauga 42 $19,353,312 $460,793 $466,500 54 31 100% 12- - - - - - - - City of Toronto 113 $68,365,566 $605,005 $570,000 149 105 103% 14 - - - - - - - - York Region 214 $112,248,620 $524,526 $528,500 316 201 101% 10 Aurora 13 $5,735,800 $441,215 $436,000 14 8 100% 10 E. Gwillimbury 8 $2,600,900 $325,113 $323,950 4 2 98% 16 Georgina 5 $1,598,000 $319,600 $326,000 5 1 98% 12 King 3 $1,738,900 $579,633 $639,900 5 4 100% 7 Markham 44 $24,095,536 $547,626 $537,500 85 63 103% 9 Newmarket 17 $7,218,800 $424,635 $418,500 26 18 101% 8 Richmond Hill 61 $34,241,912 $561,343 $564,000 78 45 100% 10 Vaughan 56 $32,125,272 $573,666 $571,250 92 55 100% 10 Whitchurch-Stouffville 7 $2,893,500 $413,357 $400,000 7 5 99% 13- - - - - - - - Durham Region 77 $24,663,669 $320,307 $326,000 114 83 100% 15 Ajax 27 $9,426,800 $349,141 $349,000 31 24 99% 22 Brock - - - - - - - - Clarington 13 $3,428,569 $263,736 $260,000 19 10 101% 7 Oshawa 5 $936,500 $187,300 $218,000 12 13 100% 23 Pickering 5 $1,842,800 $368,560 $393,000 9 10 102% 15 Scugog - - - - - - - - Uxbridge - - - - 1 1 - - Whitby 27 $9,029,000 $334,407 $329,900 42 25 100% 10- - - - - - - - Dufferin County 4 $1,079,000 $269,750 $270,750 7 5 98% 20 Orangeville 4 $1,079,000 $269,750 $270,750 7 5 98% 20- - - - - - - - Simcoe County 14 $3,937,900 $281,279 $278,500 19 20 99% 19 Adjala-Tosorontio - - - - - - - - Bradford West Gwillimbury 3 $965,000 $321,667 $325,000 8 9 99% 19 Essa 2 $495,500 $247,750 $247,750 3 3 99% 23 Innisfil 4 $1,097,000 $274,250 $273,250 4 3 99% 24 New Tecumseth 5 $1,380,400 $276,080 $277,000 4 5 100% 12 ! TURN PAGE FOR CITY OF TORONTO TABLES OR CLICK HERE: SUMMARY OF EXISTING HOME TRANSACTIONS ATTACHED/ROW/TOWNHOUSE, MARCH 2014 17
- 18. Industrial Leasing July 2010Page 3 Toronto Real Estate Board Market Watch, March 2014 18 CITY OF TORONTO MUNICIPAL BREAKDOWN Sales1 Dollar Volume1 Average Price1 Median Price1 New Listings2 Active Listings3 Avg. SP/LP4 Avg. DOM5 TREB Total 660 $310,511,475 $470,472 $445,000 983 685 101% 13 City of Toronto Total 113 $68,365,566 $605,005 $570,000 149 105 103% 14 Toronto West 34 $19,244,978 $566,029 $560,100 42 24 102% 13 Toronto W01 5 $3,693,000 $738,600 $755,000 3 2 102% 16 Toronto W02 3 $1,797,500 $599,167 $605,000 4 1 104% 28 Toronto W03 3 $1,590,000 $530,000 $540,000 2 1 122% 7 Toronto W04 1 $570,000 $570,000 $570,000 3 2 99% 8 Toronto W05 7 $3,044,000 $434,857 $415,000 11 7 100% 16 Toronto W06 3 $1,786,800 $595,600 $624,000 7 6 99% 13 Toronto W07 4 $2,477,178 $619,295 $617,500 3 1 101% 10 Toronto W08 3 $2,127,000 $709,000 $713,000 3 1 101% 9 Toronto W09 1 $415,000 $415,000 $415,000 1 - 104% 2 Toronto W10 4 $1,744,500 $436,125 $435,250 5 3 97% 13 Toronto Central 31 $25,771,500 $831,339 $820,000 43 46 102% 23 Toronto C01 16 $12,809,112 $800,570 $739,750 17 8 103% 22 Toronto C02 2 $2,190,888 $1,095,444 $1,095,444 4 4 101% 5 Toronto C03 - - - - 1 3 - - Toronto C04 1 $779,000 $779,000 $779,000 2 8 97% 173 Toronto C06 - - - - 1 1 - - Toronto C07 2 $1,308,800 $654,400 $654,400 2 2 102% 2 Toronto C08 4 $3,274,000 $818,500 $842,000 8 7 104% 15 Toronto C09 - - - - - - - - Toronto C10 2 $1,865,000 $932,500 $932,500 3 2 97% 7 Toronto C11 - - - - - - - - Toronto C12 - - - - - 2 - - Toronto C13 2 $1,462,700 $731,350 $731,350 3 2 106% 6 Toronto C14 2 $2,082,000 $1,041,000 $1,041,000 2 7 98% 40 Toronto C15 - - - - - - - - Toronto East 48 $23,349,088 $486,439 $475,000 64 35 105% 9 Toronto E01 7 $4,799,388 $685,627 $638,888 8 5 111% 10 Toronto E02 2 $1,228,000 $614,000 $614,000 3 2 103% 8 Toronto E03 3 $1,499,212 $499,737 $501,212 3 1 121% 8 Toronto E04 9 $4,744,100 $527,122 $525,000 12 10 98% 6 Toronto E05 1 $461,000 $461,000 $461,000 5 2 110% 6 Toronto E06 - - - - - 3 - - Toronto E07 5 $2,410,988 $482,198 $475,000 6 1 112% 5 Toronto E08 2 $850,000 $425,000 $425,000 3 1 106% 2 Toronto E09 1 $395,000 $395,000 $395,000 2 3 99% 7 Toronto E10 8 $3,264,400 $408,050 $397,250 9 2 99% 14 Toronto E11 10 $3,697,000 $369,700 $360,000 13 5 101% 9 SUMMARY OF EXISTING HOME TRANSACTIONS ATTACHED/ROW/TOWNHOUSE, MARCH 2014
- 19. Industrial Leasing July 2010Page 3 Toronto Real Estate Board Market Watch, March 2014 ALL TREB AREAS Sales 1 Dollar Volume 1 Average Price 1 Median Price 1 New Listings 2 Active Listings 3 Avg. SP/LP 4 Avg. DOM 5 TREB Total 7 $1,995,500 $285,071 $242,100 16 22 100% 43- - - - - - - - Halton Region 1 $172,900 $172,900 $172,900 - - 100% 159 Burlington 1 $172,900 $172,900 $172,900 - - 100% 159 Halton Hills - - - - - - - - Milton - - - - - - - - Oakville - - - - - - - -- - - - - - - - Peel Region 1 $242,100 $242,100 $242,100 2 1 101% 0 Brampton - - - - - - - - Caledon - - - - - - - - Mississauga 1 $242,100 $242,100 $242,100 2 1 101% 0- - - - - - - - City of Toronto 5 $1,580,500 $316,100 $257,500 14 21 100% 29 - - - - - - - - York Region - - - - - - - - Aurora - - - - - - - - E. Gwillimbury - - - - - - - - Georgina - - - - - - - - King - - - - - - - - Markham - - - - - - - - Newmarket - - - - - - - - Richmond Hill - - - - - - - - Vaughan - - - - - - - - Whitchurch-Stouffville - - - - - - - -- - - - - - - - Durham Region - - - - - - - - Ajax - - - - - - - - Brock - - - - - - - - Clarington - - - - - - - - Oshawa - - - - - - - - Pickering - - - - - - - - Scugog - - - - - - - - Uxbridge - - - - - - - - Whitby - - - - - - - -- - - - - - - - Dufferin County - - - - - - - - Orangeville - - - - - - - -- - - - - - - - Simcoe County - - - - - - - - Adjala-Tosorontio - - - - - - - - Bradford West Gwillimbury - - - - - - - - Essa - - - - - - - - Innisfil - - - - - - - - New Tecumseth - - - - - - - - SUMMARY OF EXISTING HOME TRANSACTIONS CO-OP APARTMENT, MARCH 2014 ! TURN PAGE FOR CITY OF TORONTO TABLES OR CLICK HERE: 19
- 20. Industrial Leasing July 2010Page 3 Toronto Real Estate Board Market Watch, March 2014 20 CITY OF TORONTO MUNICIPAL BREAKDOWN Sales1 Dollar Volume1 Average Price1 Median Price1 New Listings2 Active Listings3 Avg. SP/LP4 Avg. DOM5 TREB Total 7 $1,995,500 $285,071 $242,100 16 22 100% 43 City of Toronto Total 5 $1,580,500 $316,100 $257,500 14 21 100% 29 Toronto West 1 $143,000 $143,000 $143,000 3 5 103% 15 Toronto W01 - - - - - - - - Toronto W02 - - - - - 1 - - Toronto W03 - - - - - - - - Toronto W04 - - - - - - - - Toronto W05 - - - - 1 1 - - Toronto W06 - - - - - 1 - - Toronto W07 1 $143,000 $143,000 $143,000 2 1 103% 15 Toronto W08 - - - - - 1 - - Toronto W09 - - - - - - - - Toronto W10 - - - - - - - - Toronto Central 3 $1,287,500 $429,167 $420,000 9 14 100% 26 Toronto C01 1 $420,000 $420,000 $420,000 1 - 101% 9 Toronto C02 - - - - - - - - Toronto C03 1 $257,500 $257,500 $257,500 1 1 99% 30 Toronto C04 - - - - 1 1 - - Toronto C06 - - - - - - - - Toronto C07 - - - - - - - - Toronto C08 - - - - 1 2 - - Toronto C09 1 $610,000 $610,000 $610,000 4 9 99% 39 Toronto C10 - - - - - - - - Toronto C11 - - - - - - - - Toronto C12 - - - - - - - - Toronto C13 - - - - - - - - Toronto C14 - - - - - - - - Toronto C15 - - - - 1 1 - - Toronto East 1 $150,000 $150,000 $150,000 2 2 97% 50 Toronto E01 - - - - - - - - Toronto E02 - - - - - - - - Toronto E03 - - - - - - - - Toronto E04 - - - - 1 1 - - Toronto E05 - - - - - - - - Toronto E06 - - - - - - - - Toronto E07 - - - - - - - - Toronto E08 - - - - - - - - Toronto E09 - - - - - - - - Toronto E10 1 $150,000 $150,000 $150,000 1 1 97% 50 Toronto E11 - - - - - - - - SUMMARY OF EXISTING HOME TRANSACTIONS CO-OP APARTMENT, MARCH 2014
- 21. Industrial Leasing July 2010Page 3 Toronto Real Estate Board Market Watch, March 2014 ALL TREB AREAS Sales 1 Dollar Volume 1 Average Price 1 Median Price 1 New Listings 2 Active Listings 3 Avg. SP/LP 4 Avg. DOM 5 TREB Total 7 $3,593,000 $513,286 $560,000 14 32 96% 45- - - - - - - - Halton Region - - - - 1 1 - - Burlington - - - - - - - - Halton Hills - - - - - - - - Milton - - - - - - - - Oakville - - - - 1 1 - -- - - - - - - - Peel Region 3 $1,977,000 $659,000 $705,000 3 7 97% 37 Brampton 2 $1,265,000 $632,500 $632,500 1 4 96% 35 Caledon 1 $712,000 $712,000 $712,000 1 1 98% 43 Mississauga - - - - 1 2 - -- - - - - - - - City of Toronto - - - - 2 1 - - - - - - - - - - York Region 1 $636,000 $636,000 $636,000 - - 94% 63 Aurora - - - - - - - - E. Gwillimbury - - - - - - - - Georgina - - - - - - - - King - - - - - - - - Markham 1 $636,000 $636,000 $636,000 - - 94% 63 Newmarket - - - - - - - - Richmond Hill - - - - - - - - Vaughan - - - - - - - - Whitchurch-Stouffville - - - - - - - -- - - - - - - - Durham Region 2 $455,000 $227,500 $227,500 - - 96% 60 Ajax 2 $455,000 $227,500 $227,500 - - 96% 60 Brock - - - - - - - - Clarington - - - - - - - - Oshawa - - - - - - - - Pickering - - - - - - - - Scugog - - - - - - - - Uxbridge - - - - - - - - Whitby - - - - - - - -- - - - - - - - Dufferin County - - - - - - - - Orangeville - - - - - - - -- - - - - - - - Simcoe County 1 $525,000 $525,000 $525,000 8 23 98% 18 Adjala-Tosorontio - - - - - - - - Bradford West Gwillimbury - - - - - - - - Essa - - - - - - - - Innisfil - - - - - - - - New Tecumseth 1 $525,000 $525,000 $525,000 8 23 98% 18 ! TURN PAGE FOR CITY OF TORONTO TABLES OR CLICK HERE: SUMMARY OF EXISTING HOME TRANSACTIONS DETACHED CONDOMINIUM, MARCH 2014 21
- 22. Industrial Leasing July 2010Page 3 Toronto Real Estate Board Market Watch, March 2014 22 CITY OF TORONTO MUNICIPAL BREAKDOWN Sales1 Dollar Volume1 Average Price1 Median Price1 New Listings2 Active Listings3 Avg. SP/LP4 Avg. DOM5 TREB Total 7 $3,593,000 $513,286 $560,000 14 32 96% 45 City of Toronto Total - - - - 2 1 - - Toronto West - - - - - - - - Toronto W01 - - - - - - - - Toronto W02 - - - - - - - - Toronto W03 - - - - - - - - Toronto W04 - - - - - - - - Toronto W05 - - - - - - - - Toronto W06 - - - - - - - - Toronto W07 - - - - - - - - Toronto W08 - - - - - - - - Toronto W09 - - - - - - - - Toronto W10 - - - - - - - - Toronto Central - - - - 1 1 - - Toronto C01 - - - - - - - - Toronto C02 - - - - - - - - Toronto C03 - - - - - - - - Toronto C04 - - - - - - - - Toronto C06 - - - - - - - - Toronto C07 - - - - - - - - Toronto C08 - - - - - - - - Toronto C09 - - - - 1 1 - - Toronto C10 - - - - - - - - Toronto C11 - - - - - - - - Toronto C12 - - - - - - - - Toronto C13 - - - - - - - - Toronto C14 - - - - - - - - Toronto C15 - - - - - - - - Toronto East - - - - 1 - - - Toronto E01 - - - - - - - - Toronto E02 - - - - - - - - Toronto E03 - - - - - - - - Toronto E04 - - - - - - - - Toronto E05 - - - - - - - - Toronto E06 - - - - - - - - Toronto E07 - - - - - - - - Toronto E08 - - - - 1 - - - Toronto E09 - - - - - - - - Toronto E10 - - - - - - - - Toronto E11 - - - - - - - - SUMMARY OF EXISTING HOME TRANSACTIONS DETACHED CONDOMINIUM, MARCH 2014
- 23. Industrial Leasing July 2010Page 3 Toronto Real Estate Board Market Watch, March 2014 23 ALL TREB AREAS Sales 1 Dollar Volume 1 Average Price 1 Median Price 1 New Listings 2 Active Listings 3 Avg. SP/LP 4 Avg. DOM 5 TREB Total 10 $2,839,600 $283,960 $271,950 6 12 102% 44- - - - - - - - Halton Region - - - - - - - - Burlington - - - - - - - - Halton Hills - - - - - - - - Milton - - - - - - - - Oakville - - - - - - - -- - - - - - - - Peel Region - - - - - - - - Brampton - - - - - - - - Caledon - - - - - - - - Mississauga - - - - - - - -- - - - - - - - City of Toronto 10 $2,839,600 $283,960 $271,950 6 12 102% 44 - - - - - - - - York Region - - - - - - - - Aurora - - - - - - - - E. Gwillimbury - - - - - - - - Georgina - - - - - - - - King - - - - - - - - Markham - - - - - - - - Newmarket - - - - - - - - Richmond Hill - - - - - - - - Vaughan - - - - - - - - Whitchurch-Stouffville - - - - - - - -- - - - - - - - Durham Region - - - - - - - - Ajax - - - - - - - - Brock - - - - - - - - Clarington - - - - - - - - Oshawa - - - - - - - - Pickering - - - - - - - - Scugog - - - - - - - - Uxbridge - - - - - - - - Whitby - - - - - - - -- - - - - - - - Dufferin County - - - - - - - - Orangeville - - - - - - - -- - - - - - - - Simcoe County - - - - - - - - Adjala-Tosorontio - - - - - - - - Bradford West Gwillimbury - - - - - - - - Essa - - - - - - - - Innisfil - - - - - - - - New Tecumseth - - - - - - - - ! TURN PAGE FOR CITY OF TORONTO TABLES OR CLICK HERE: SUMMARY OF EXISTING HOME TRANSACTIONS CO-OWNERSHIP APARTMENT, MARCH 2014
- 24. Industrial Leasing July 2010Page 3 Toronto Real Estate Board Market Watch, March 2014 24 CITY OF TORONTO MUNICIPAL BREAKDOWN Sales1 Dollar Volume1 Average Price1 Median Price1 New Listings2 Active Listings3 Avg. SP/LP4 Avg. DOM5 TREB Total 10 $2,839,600 $283,960 $271,950 6 12 102% 44 City of Toronto Total 10 $2,839,600 $283,960 $271,950 6 12 102% 44 Toronto West 3 $538,000 $179,333 $220,000 2 3 99% 28 Toronto W01 2 $451,000 $225,500 $225,500 - - 99% 28 Toronto W02 - - - - - - - - Toronto W03 - - - - - - - - Toronto W04 - - - - - - - - Toronto W05 1 $87,000 $87,000 $87,000 2 3 98% 28 Toronto W06 - - - - - - - - Toronto W07 - - - - - - - - Toronto W08 - - - - - - - - Toronto W09 - - - - - - - - Toronto W10 - - - - - - - - Toronto Central 7 $2,301,600 $328,800 $293,000 4 9 102% 50 Toronto C01 - - - - - - - - Toronto C02 - - - - 1 2 - - Toronto C03 - - - - - 2 - - Toronto C04 5 $1,676,800 $335,360 $293,000 1 1 103% 58 Toronto C06 - - - - - - - - Toronto C07 - - - - - - - - Toronto C08 1 $359,900 $359,900 $359,900 1 1 100% 17 Toronto C09 - - - - - - - - Toronto C10 1 $264,900 $264,900 $264,900 - - 100% 45 Toronto C11 - - - - - - - - Toronto C12 - - - - - - - - Toronto C13 - - - - - 1 - - Toronto C14 - - - - 1 2 - - Toronto C15 - - - - - - - - Toronto East - - - - - - - - Toronto E01 - - - - - - - - Toronto E02 - - - - - - - - Toronto E03 - - - - - - - - Toronto E04 - - - - - - - - Toronto E05 - - - - - - - - Toronto E06 - - - - - - - - Toronto E07 - - - - - - - - Toronto E08 - - - - - - - - Toronto E09 - - - - - - - - Toronto E10 - - - - - - - - Toronto E11 - - - - - - - - SUMMARY OF EXISTING HOME TRANSACTIONS CO-OWNERSHIP APARTMENT, MARCH 2014
- 25. Industrial Leasing July 2010Page 3 Toronto Real Estate Board Market Watch, March 2014 25 FOCUS ON THE MLS® HOME PRICE INDEX INDEX AND BENCHMARK PRICE, MARCH 2014 ALL TREB AREAS Index Benchmark Yr./Yr. % Chg. Index Benchmark Yr./Yr. % Chg. Index Benchmark Yr./Yr. % Chg. Index Benchmark Yr./Yr. % Chg. Index Benchmark Yr./Yr. % Chg. TREB Total 163.1 $497,600 7.37% 164.0 $609,800 7.89% 169.7 $479,400 7.95% 158.8 $347,800 5.80% 153.2 $307,700 5.15% Halton Region 170.4 $559,000 5.97% 167.7 $621,900 5.60% 170.6 $442,800 6.29% 165.2 $327,000 2.74% - - - Burlington 178.8 $515,300 4.75% 182.1 $622,400 6.80% 167.0 $398,100 2.08% 173.5 $348,400 2.42% - - - Halton Hills 154.4 $449,600 1.91% 154.0 $492,700 2.46% 167.1 $411,500 6.30% 155.1 $279,600 -0.13% - - - Milton 164.3 $460,800 7.60% 151.3 $527,100 5.07% 167.1 $417,200 7.60% - - - - - - Oakville 177.3 $654,100 5.72% 177.0 $733,600 6.05% 177.4 $480,200 5.22% 166.3 $367,400 3.68% - - - Peel Region 156.0 $426,700 5.76% 156.8 $530,800 5.38% 158.5 $404,400 5.74% 160.8 $332,700 5.24% 142.1 $244,500 6.44% Brampton 149.5 $381,400 5.65% 149.6 $437,200 4.84% 151.1 $355,900 5.22% 145.0 $269,400 5.00% 125.6 $196,600 6.53% Caledon 143.7 $512,000 1.77% 143.9 $528,200 1.34% 160.1 $395,800 5.61% - - - - - - Mississauga 162.1 $453,100 6.36% 167.6 $624,500 6.62% 166.9 $456,100 6.31% 165.7 $355,800 5.34% 145.1 $254,100 6.61% City of Toronto 167.1 $547,600 7.67% 173.0 $750,000 9.84% 180.7 $599,300 9.18% 163.2 $394,700 6.74% 155.8 $321,700 4.63% York Region 172.8 $593,000 8.47% 173.1 $680,000 7.92% 177.5 $514,200 9.03% 157.4 $401,200 3.48% 152.7 $331,700 6.04% Aurora 165.6 $533,200 8.16% 166.2 $617,400 9.63% 169.0 $437,400 8.33% 135.9 $344,200 -4.03% 147.0 $305,400 1.87% E. Gwillimbury 150.8 $487,500 10.88% 150.7 $495,000 11.14% 163.7 $346,600 11.97% - - - - - - Georgina 149.0 $309,200 6.50% 153.2 $315,600 7.13% 161.9 $319,100 10.36% - - - - - - King 158.5 $671,900 3.66% 159.9 $674,700 3.56% - - - - - - - - - Markham 177.4 $611,100 8.17% 181.3 $745,600 8.11% 181.0 $539,000 9.30% 163.9 $407,200 5.00% 156.9 $362,800 5.66% Newmarket 157.8 $465,400 8.60% 156.2 $525,800 9.23% 163.6 $385,600 7.70% 151.6 $306,100 -3.50% 146.3 $246,400 -0.81% Richmond Hill 181.4 $656,800 8.43% 190.4 $806,700 8.55% 187.7 $568,600 8.37% 151.8 $429,200 5.56% 149.8 $312,000 4.10% Vaughan 172.5 $623,500 9.11% 165.4 $688,300 6.23% 178.5 $543,400 9.98% 165.4 $451,900 7.40% 150.9 $334,900 8.95% Whitchurch-Stouffville 169.7 $639,800 7.88% 170.2 $653,100 8.13% 153.0 $420,300 7.67% - - - - - - Durham Region 145.3 $341,900 8.27% 144.5 $376,800 8.16% 150.3 $301,000 8.52% 136.0 $223,500 8.02% 140.1 $250,600 8.35% Ajax 152.6 $377,100 8.61% 152.5 $408,400 7.47% 158.3 $340,400 7.61% 140.6 $256,900 8.99% 136.9 $232,500 8.65% Brock 127.0 $240,800 5.05% 127.5 $242,300 5.37% 140.6 $224,100 4.07% - - - - - - Clarington 140.3 $296,900 8.51% 135.9 $326,600 7.35% 144.1 $275,100 8.92% 155.5 $278,400 10.75% 139.6 $197,600 9.32% Oshawa 140.8 $269,500 8.89% 140.2 $298,500 9.36% 146.4 $245,200 8.85% 119.7 $160,200 6.97% 141.2 $169,000 4.98% Pickering 152.4 $412,300 8.62% 153.7 $480,800 8.85% 155.7 $362,900 8.12% 146.0 $263,400 7.43% 144.0 $282,000 10.94% Scugog 141.0 $365,900 4.75% 145.2 $373,900 4.99% 135.2 $283,000 10.10% - - - - - - Uxbridge 138.3 $422,900 7.63% 139.0 $430,500 7.50% 135.5 $332,500 7.28% - - - - - - Whitby 145.1 $378,600 7.80% 145.7 $418,600 8.41% 148.4 $327,400 9.04% 139.1 $255,000 9.36% 136.5 $266,300 3.80% Dufferin County 150.0 $343,800 6.99% 154.0 $350,900 7.32% 148.2 $277,800 4.37% - - - - - - Orangeville 150.0 $343,800 6.99% 154.0 $350,900 7.32% 148.2 $277,800 4.37% - - - - - - Simcoe County 146.0 $310,300 5.80% 142.0 $313,200 5.26% 152.0 $291,900 6.07% - - - - - - Adjala-Tosorontio 131.3 $413,500 7.53% 131.3 $414,000 7.53% - - - - - - - - - Bradford West Gwillimbury 160.8 $399,700 8.14% 145.4 $445,400 8.51% 166.0 $345,100 8.36% - - - - - - Essa 143.5 $325,400 6.22% 141.3 $349,500 6.96% 145.0 $247,000 4.02% - - - - - - Innisfil 144.7 $268,100 3.36% 145.2 $269,500 3.27% 155.9 $242,500 4.56% - - - - - - New Tecumseth 134.1 $309,700 6.09% 131.2 $337,900 6.23% 139.9 $267,600 5.82% - - - - - - Townhouse Apartment ! TURN PAGE FOR CITY OF TORONTO TABLES OR CLICK HERE: Composite Single-Family Detached Single-Family Attached CLICK HERE FOR MORE BACKGROUND INFORMATION ON THE MLS® HPI
- 26. Industrial Leasing July 2010Page 3 Toronto Real Estate Board Market Watch, March 2014 26 FOCUS ON THE MLS® HOME PRICE INDEX INDEX AND BENCHMARK PRICE, MARCH 2014 CITY OF TORONTO Index Benchmark Yr./Yr. % Chg. Index Benchmark Yr./Yr. % Chg. Index Benchmark Yr./Yr. % Chg. Index Benchmark Yr./Yr. % Chg. Index Benchmark Yr./Yr. % Chg. TREB Total 163.1 $497,600 7.37% 164.0 $609,800 7.89% 169.7 $479,400 7.95% 158.8 $347,800 5.80% 153.2 $307,700 5.15% City of Toronto 167.1 $547,600 7.67% 173.0 $750,000 9.84% 180.7 $599,300 9.18% 163.2 $394,700 6.74% 155.8 $321,700 4.63% Toronto W01 158.9 $648,400 -0.19% 162.0 $835,000 4.58% 169.7 $654,800 2.79% 207.2 $426,600 -4.30% 135.6 $316,400 -4.24% Toronto W02 190.5 $687,100 8.49% 186.5 $765,500 8.24% 216.2 $662,300 9.30% 144.4 $398,100 9.98% 132.1 $549,100 11.76% Toronto W03 175.0 $452,000 12.04% 178.6 $485,700 13.76% 181.9 $466,000 11.60% - - - 130.3 $241,700 2.84% Toronto W04 154.5 $404,600 11.96% 161.9 $510,900 12.20% 158.9 $462,700 12.38% 139.5 $339,400 -3.33% 137.2 $202,100 11.36% Toronto W05 145.8 $347,100 5.81% 160.3 $534,400 10.70% 148.2 $433,500 9.45% 143.2 $235,700 10.32% 121.9 $160,100 -9.50% Toronto W06 151.1 $438,600 5.52% 182.1 $578,000 14.60% 152.7 $463,000 8.92% 160.5 $472,900 -2.61% 124.1 $307,000 -3.12% Toronto W07 164.3 $700,200 14.34% 171.8 $742,500 14.15% 155.2 $636,400 11.10% 136.3 $501,000 -0.22% 114.4 $463,900 8.85% Toronto W08 148.6 $604,600 7.68% 159.9 $836,400 9.67% 165.6 $622,100 12.35% 141.6 $346,100 -4.58% 135.9 $273,600 6.84% Toronto W09 150.4 $386,500 8.28% 169.2 $633,000 9.80% 151.2 $428,000 8.86% 139.4 $353,600 -7.00% 122.6 $157,200 6.24% Toronto W10 145.2 $337,000 8.36% 159.5 $469,300 11.46% 155.6 $422,800 9.58% 121.1 $218,200 6.51% 126.3 $192,800 1.53% Toronto C01 184.0 $456,400 4.13% 204.2 $720,800 5.75% 213.4 $740,400 8.82% 176.0 $528,200 7.32% 179.1 $372,800 2.99% Toronto C02 173.7 $824,700 5.34% 157.5 $1,248,400 1.81% 177.6 $934,500 4.41% 169.4 $792,200 5.88% 174.8 $487,500 7.37% Toronto C03 179.2 $922,300 7.11% 175.8 $1,059,500 6.48% 185.4 $686,400 5.88% - - - 181.6 $479,800 11.62% Toronto C04 162.5 $1,006,800 5.73% 167.2 $1,168,800 6.43% 165.5 $791,200 6.50% 150.7 $563,000 5.83% 142.8 $339,500 2.29% Toronto C06 176.1 $696,900 8.37% 180.5 $772,600 9.33% 153.3 $563,800 2.47% 147.9 $403,600 11.71% 172.8 $382,100 7.66% Toronto C07 164.7 $565,700 7.72% 186.2 $852,400 10.05% 161.5 $574,000 5.42% 138.3 $406,000 9.67% 150.9 $355,500 4.65% Toronto C08 171.6 $441,800 5.34% 154.6 $480,500 -6.70% 172.3 $713,200 1.06% 185.9 $563,800 8.27% 171.9 $379,200 6.24% Toronto C09 134.9 $1,001,800 8.35% 123.9 $1,556,400 5.81% 147.4 $1,199,500 8.70% 165.7 $855,300 14.12% 142.3 $471,500 10.40% Toronto C10 184.0 $717,800 8.30% 169.0 $1,037,100 9.24% 172.2 $850,500 6.49% 212.9 $488,200 5.08% 191.2 $458,100 9.63% Toronto C11 158.5 $567,900 18.37% 164.3 $1,100,000 14.10% 189.4 $831,100 17.06% 116.6 $186,000 3.09% 152.9 $217,600 24.61% Toronto C12 155.3 $1,330,900 3.40% 147.9 $1,589,500 1.86% 174.9 $755,700 8.10% 162.6 $550,800 5.31% 175.1 $550,700 7.62% Toronto C13 155.8 $574,800 4.70% 169.9 $910,300 5.79% 161.0 $516,600 4.82% 149.6 $426,000 4.62% 139.5 $276,000 2.27% Toronto C14 172.6 $586,500 3.23% 194.3 $1,054,200 7.88% 184.2 $898,600 4.96% 224.3 $757,900 8.20% 160.8 $404,400 0.88% Toronto C15 163.9 $548,000 7.97% 186.0 $871,900 8.08% 170.2 $555,400 7.18% 176.1 $433,900 7.97% 138.6 $323,900 9.05% Toronto E01 201.7 $626,400 10.28% 195.6 $659,000 8.79% 209.6 $657,600 11.79% 222.6 $450,100 12.37% 189.0 $448,300 6.60% Toronto E02 186.9 $695,200 15.09% 172.4 $759,300 11.88% 195.6 $652,400 15.26% 170.0 $568,300 6.78% 175.6 $464,700 10.16% Toronto E03 172.7 $532,000 10.07% 174.1 $584,900 9.15% 175.9 $572,800 11.05% - - - 136.1 $203,600 7.59% Toronto E04 172.3 $432,500 15.95% 179.6 $530,300 14.18% 175.0 $424,600 14.16% 168.1 $363,300 13.12% 166.7 $252,500 21.50% Toronto E05 161.6 $432,200 10.61% 185.9 $656,400 15.90% 182.4 $502,700 15.22% 160.7 $349,400 8.29% 134.5 $264,200 3.54% Toronto E06 180.9 $511,200 9.97% 182.1 $520,400 9.83% 183.7 $434,500 8.83% - - - 162.8 $359,000 12.66% Toronto E07 172.0 $424,000 11.62% 190.9 $624,800 19.46% 180.4 $471,500 14.18% 173.4 $374,900 9.13% 149.0 $255,100 5.37% Toronto E08 158.7 $388,900 9.52% 172.8 $539,500 9.44% 158.1 $404,600 6.04% 164.5 $333,000 15.12% 128.2 $204,700 7.82% Toronto E09 156.3 $377,400 10.54% 168.7 $480,100 12.39% 162.2 $398,100 13.27% 151.7 $279,600 16.16% 142.2 $266,700 6.84% Toronto E10 161.4 $456,900 7.82% 163.1 $522,100 6.53% 157.0 $408,300 1.49% 169.5 $296,900 19.45% 125.3 $202,000 21.30% Toronto E11 153.8 $339,100 7.03% 171.2 $475,400 6.14% 163.7 $371,400 7.49% 124.6 $244,800 6.95% 131.1 $195,700 12.53% ApartmentComposite Single-Family Detached Single-Family Attached Townhouse CLICK HERE FOR MORE BACKGROUND INFORMATION ON THE MLS® HPI
- 27. July 2010Page 3 Toronto Real Estate Board Market Watch, March 2014 27 YEAR SALES AVERAGE PRICE 2003 78,898 $293,067 2004 83,501 $315,231 2005 84,145 $335,907 2006 83,084 $351,941 2007 93,193 $376,236 2008 74,552 $379,347 2009 87,308 $395,460 2010 85,545 $431,276 2011 89,096 $465,014 2012 85,496 $497,130 2013 87,065 $523,011 January 4,229 $482,080 February 5,613 $509,396 March 7,537 $517,232 April 9,535 $524,868 May 9,946 $540,544 June 8,822 $529,616 July 8,367 $512,286 August 7,392 $501,739 September 7,258 $532,631 October 7,947 $539,431 November 6,357 $538,878 December 4,062 $520,181 Annual 87,065 $523,011 January 4,108 $526,814 February 5,708 $552,885 March 8,081 $557,684 April - - May - - June - - July - - August - - September - - October - - November - - December - - Year-to-Date 17,897 $549,068 HISTORIC ANNUAL STATISTICS1,6,7 2014 MONTHLY STATISTICS1,7 2013 MONTHLY STATISTICS1,7 *For historic annual sales and average price data over a longer time frame go to: http://www.torontorealestateboard.com/market_news/market_watch/histori c_stats/pdf/TREB_historic_statistics.pdf NOTES 8 SNLR = Sales-to-New Listings Ratio. Calculated using a 12-month moving average (sales/new listings). 9 Mos. Inv. = Months of Inventory. Calculated using a 12-month moving average (active listings/sales). 7 Past monthly and year-to-date figures are revised on a monthly basis. 1 Sales, dollar volume, average sale prices and median sale prices are based on firm transactions entered into the TorontoMLS® system between the first and last day of the month/period being reported. 2 New listings entered into the TorontoMLS® system between the first and last day of the month/period being reported. 3 Active listings at the end of the last day of the month/period being reported. 4 Ratio of the average selling price to the average listing price for firm transactions entered into the TorontoMLS® system between the first and last day of the month/period being reported. 5 Average number of days on the market for firm transactions entered into the TorontoMLS® system between the first and last day of the month/period being reported. 6 Due to past changes to TREB's service area, caution should be exercised when making historical comparisons. Copyright® 2014 Toronto Real Estate Board