Research Report for UNH as of 7/27/11 - Chaikin Power Tools
•
0 j'aime•199 vues

To order a free Chaikin Power Gauge stock research report for UNH go to http://www.chaikinpowertools.com/reports

Recommandé
Recommandé
Contenu connexe
Plus de Dan Oconnor
Plus de Dan Oconnor (7)
Dernier
Dernier (20)
Research Report for UNH as of 7/27/11 - Chaikin Power Tools
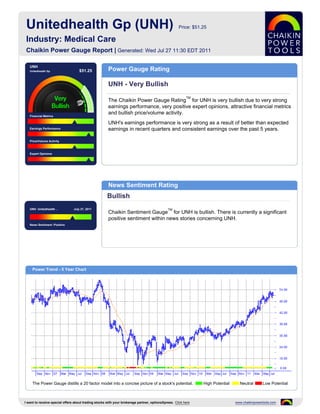
- 1. Unitedhealth Gp (UNH) Price: $51.25 Industry: Medical Care Chaikin Power Gauge Report | Generated: Wed Jul 27 11:30 EDT 2011 UNH Unitedhealth Gp $51.25 Power Gauge Rating UNH - Very Bullish TM The Chaikin Power Gauge Rating for UNH is very bullish due to very strong earnings performance, very positive expert opinions, attractive financial metrics and bullish price/volume activity. Financial Metrics UNH's earnings performance is very strong as a result of better than expected Earnings Performance earnings in recent quarters and consistent earnings over the past 5 years. Price/Volume Activity Expert Opinions News Sentiment Rating Bullish UNH Unitedhealth .. July 27, 2011 TM Chaikin Sentiment Gauge for UNH is bullish. There is currently a significant positive sentiment within news stories concerning UNH. News Sentiment :Positive Power Trend - 5 Year Chart The Power Gauge distills a 20 factor model into a concise picture of a stock's potential. High Potential Neutral Low Potential I want to receive special offers about trading stocks with your brokerage partner, optionsXpress. Click here www.chaikinpowertools.com
- 2. Financials & Earnings Financial Metrics Financial Metrics Rating LT Debt/Equity Ratio Bullish Price to Book Value UNH's financial metrics are very good. The company yields a high return on shareholder's equity and generates high free cash flow relative to market Return on Equity capitalization. The rank is based on a high long term debt to equity ratio, high return on equity Price to Sales Ratio and relatively high cash flow. Business Value Assets and Liabilities Valuation Returns Ratio TTM Ratio TTM Ratio TTM Current Ratio 0.84 Price/Book 2.18 Return on Invest 14.0% LT Debt/Equity 0.34 Price/Sales 0.59 Return on Equity 18.7% Earnings Performance Earnings Performance Rating Earnings Growth Very Bullish Earnings Surprise UNH's earnings performance has been very strong. The company has outperformed analysts' earnings estimates and has a stable 5 year earnings trend. Earnings Trend The rank is based on better than expected earnings in recent quarters, a Projected P/E Ratio relatively high projected P/E ratio and consistent earnings over the past 5 years. Earnings Consistency 5 Year Revenue and Earnings Growth EPS Estimates 12/06 12/07 12/08 12/09 12/10 Factor Actual EPS Prev EST EPS Current Change Revenue(M) 18,157.00 75,431.00 81,186.00 87,138.00 94,155.00 Quarterly EPS $1.14 $1.11 -0.03 Rev % Growth -59.98% 315.44% 7.63% 7.33% 8.05% Yearly EPS $4.10 $4.34 +0.24 EPS $0.86 $3.55 $2.40 $3.24 $4.10 Factor Actual EPS Growth Est EPS Growth Change EPS % Growth -65.32% 312.79% -32.39% 35.00% 26.54% 3-5 year EPS 55.70% 12.12% -43.58 EPS Surprise EPS Quarterly Results Estimate Actual Difference % Difference FY Qtr 1 Qtr 2 Qtr 3 Qtr 4 Total Latest Qtr $0.95 $1.16 $0.21 22.11 12/09 $0.81 $0.73 $0.89 $0.81 $3.24 1 Qtr Ago $0.89 $1.22 $0.33 37.08 12/10 $1.03 $0.99 $1.14 $0.94 $4.10 2 Qtr Ago $0.84 $0.94 $0.10 11.90 12/11 $1.22 $1.16 - - - 3 Qtr Ago $0.84 $1.14 $0.30 35.71 Fiscal Year End Month is December. I want to receive special offers about trading stocks with your brokerage partner, optionsXpress. Click here www.chaikinpowertools.com
- 3. Price Trend & Expert Opinions Price/Volume Activity Price/Volume Activity Rating Relative Strength vs Market Bullish Chaikin Money Flow Price and volume activity for UNH is bullish. UNH has outperformed the S&P 500 over 26 weeks and is experiencing sustained buying. Price Trend The rank for UNH is based on its price strength versus the market, positive Price Trend ROC Chaikin money flow, a positive Chaikin price trend and a negative Chaikin price trend ROC. Volume Trend Relative Strength vs S&P500 Index Chaikin Money Flow Chart shows whether UNH is performing better or worse than the market. Chaikin Money Flow analyzes supply and demand for a company's stock. Price Activity Price Activity Volume Activity Factor Value Factor Value Factor Value 52 Week High 53.13 % Change Price - 4 Weeks 1.59% Average Volume 20 Days 6,476,420 52 Week Low 30.33 % Change Price - 24 Weeks 20.64% Average Volume 90 Days 6,978,112 % Change YTD Rel S&P 500 36.59% % Change Price - 4 Wks Rel to S&P -3.26% Chaikin Money Flow Persistency 73% % Change Price - 24 Wks Rel to S&P 18.73% Expert Opinions Expert Opinions Earnings Estimate Revisions Very Bullish Short Interest Expert opinions about UNH are very positive. Analysts are raising their EPS estimates for UNH and shorting of UNH is low. Insider Activity The rank for UNH is based on analysts revising earnings estimates upward, a low short interest ratio, insiders purchasing stock, optimistic analyst opinions and Analyst Opinions price strength of the stock versus the Medical Care industry group. Relative Strength vs Industry Earnings Estimate Revisions Analyst Recommendations EPS Estimates Revision Summary Current 7 Days Ago % Change Factor Value Last Week Last 4 Weeks Current Qtr 1.11 1.09 +1.83% Mean this Week Strong Buy Up Down Up Down Next Qtr 0.87 0.91 -4.40% Mean Last Week Strong Buy Curr Qtr 5 1 12 3 Curr Yr 4 0 18 1 Current 30 Days Ago % Change Change 0.00 Next Qtr 1 8 4 15 Current FY 4.34 4.18 0.16 Mean 5 Weeks Ago Buy Next Yr 10 0 19 0 I want to receive special offers about trading stocks with your brokerage partner, optionsXpress. Click here www.chaikinpowertools.com
- 4. The Company & Its Competitors UNH's Competitors in Medical Care News Headlines for UNH Company Power Historic EPS Projected EPS Profit Margin PEG PE Revenue(M) Insurer Aetna reports on 2Q performance Gauge growth growth Wednesday - Jul 25, 2011 UNH 55.70% 12.12% 5.01% 0.97 11.49 94,155 UnitedHealth beats expectations, raises CVH 13.07% 9.97% 3.83% 1.22 9.33 11,588 guidance - Jul 20, 2011 Profit Up 13%, UnitedHealth Raises Outlook - MHS 11.82% 14.00% 2.12% 1.13 17.36 65,968 Jul 19, 2011 AET 8.91% 10.25% 5.26% 0.95 10.79 34,246 Summary Box: UnitedHealth 2Q profit climbs 13 pct - Jul 19, 2011 AGP 20.42% 15.00% 5.05% 1.07 12.01 5,806 Aetna completes $600M Prodigy Health HNT 3.05% 10.00% 0.58% 0.99 11.08 13,620 acquisition - Jun 28, 2011 HUM 19.49% 8.00% 3.34% 1.40 10.81 33,868 WLP 6.06% 10.67% 5.03% 0.97 10.38 58,802 Company Details Company Profile UNITEDHEALTH GP UnitedHealth Group Inc. offers health care coverage and related services to help people UNITEDHEALTH GROUP achieve improved health and well-being through all stages of life. The company's CENTER 9900 BREN ROAD EAST products and services reflect a number of core capabilities, including medical information MINNEAPOLIS, MN 55343 management, health benefit administration, care coordination, risk assessment and USA pricing, health benefit design and provider contracting. With these capabilities, it is able to Phone: 9529361300 provide comprehensive health care management services through organized health Fax: 952-936-1949 systems and insurance products. Website: http://http://www.unitedhealthgroup. com/ Full Time Employees: 87,000 Sector: Medical Power Gauge Ratings are created using a relative ranking system that assigns a rank of 0 to 100 (100 being the highest) to each stock in the universe. Rank is calculated by evaluating each of the stocks factors and combining them into a single number using a weighting formula. A stock's rank ranges from 100-0, where 100 is the strongest, and a rank of 95 indicates the stock is better than 95% of the stocks in the universe. Chaikin Stock Research(CSR) is not registered as a securities broker dealer or investment advisor with either the U.S. Securities and Exchange Commission or with any state securities regulatory authority. CSR is not responsible for trades executed by users of this research report, our web site or mobile app based on the information included herein. The information presented in this report does not represent a recommendation to buy or sell stocks or any financial instrument nor is it intended as an endorsement of any security or investment. The information in this report is generic by nature and is not personalized to the specific financial situation of any individual. The user bears complete responsibility for their own investment research and should seek the advice of a qualified investment professional before making any investment decisions. Copyright (c) 1978-(Present) by ZACKS Investment Research, Inc ("ZACKS"). The information, data, analyses and opinions contained herein (1) includes the confidential and proprietary information of ZACKS, (2) may not be copied or redistributed, for any purpose, (3) does not constitute investment advice offered by ZACKS, (4) are provided solely for informational purposes, and (5) are not warranted or represented to be correct, complete, accurate or timely. ZACKS shall not be responsible for investment decisions, damages or other losses resulting from, or related to, use of this information, data, analyses or opinions. Past performance is no guarantee of future performance. ZACKS is not affiliated with Chaikin Power Tools. This report from Chaikin Power Tools is for informational purposes only and is not a recommendation to buy or sell securities. LM 2.3 DS 3.0 LS 2.1 Data Provided by ZACKS Investment Research, Inc., www.zacks.com Special offers to trade stocks from optionsXpress: www.chaikinpowertools.com