Stock Research Report for IAG as of 9/22/11 - Chaikin Power Tools
•
1 like•172 views

To order a free Chaikin Power Gauge stock research report for IAG go to http://www.chaikinpowertools.com/reports

Recommended
More Related Content
Viewers also liked
More from Dan Oconnor
More from Dan Oconnor (10)
Recently uploaded
Recently uploaded (20)
Stock Research Report for IAG as of 9/22/11 - Chaikin Power Tools
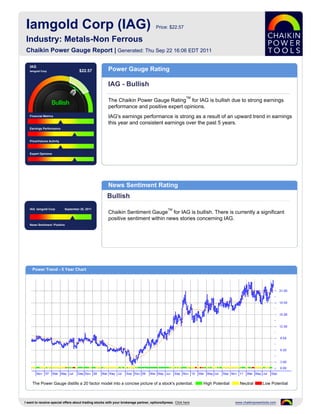
- 1. Iamgold Corp (IAG) Price: $22.57 Industry: Metals-Non Ferrous Chaikin Power Gauge Report | Generated: Thu Sep 22 16:06 EDT 2011 IAG Iamgold Corp $22.57 Power Gauge Rating IAG - Bullish TM The Chaikin Power Gauge Rating for IAG is bullish due to strong earnings performance and positive expert opinions. Financial Metrics IAG's earnings performance is strong as a result of an upward trend in earnings this year and consistent earnings over the past 5 years. Earnings Performance Price/Volume Activity Expert Opinions News Sentiment Rating Bullish IAG Iamgold Corp September 20, 2011 TM Chaikin Sentiment Gauge for IAG is bullish. There is currently a significant positive sentiment within news stories concerning IAG. News Sentiment :Positive Power Trend - 5 Year Chart The Power Gauge distills a 20 factor model into a concise picture of a stock's potential. High Potential Neutral Low Potential I want to receive special offers about trading stocks with your brokerage partner, optionsXpress. Click here www.chaikinpowertools.com
- 2. Financials & Earnings Financial Metrics Financial Metrics Rating LT Debt/Equity Ratio Neutral Price to Book Value IAG's financial metrics are neutral. The company does not hold much long term debt and may be overvalued. Return on Equity The rank is based on a low long term debt to equity ratio, high price to book value ratio, high return on equity and low price to sales ratio. Price to Sales Ratio Business Value Assets and Liabilities Valuation Returns Ratio TTM Ratio TTM Ratio TTM Current Ratio 5.12 Price/Book 2.51 Return on Invest 13.6% LT Debt/Equity 0.00 Price/Sales 7.26 Return on Equity 13.6% Earnings Performance Earnings Performance Rating Earnings Growth Bullish Earnings Surprise IAG's earnings performance has been strong. The company experienced superior earnings growth in the past 12 months and has a stable 5 year earnings trend. Earnings Trend The rank is based on worse than expected earnings in recent quarters, an upward trend in earnings this year, a relatively high projected P/E ratio and Projected P/E Ratio consistent earnings over the past 5 years. Earnings Consistency 5 Year Revenue and Earnings Growth EPS Estimates 12/06 12/07 12/08 12/09 12/10 Factor Actual EPS Prev EST EPS Current Change Revenue(M) 303.34 678.13 869.64 914.34 1,167.24 Quarterly EPS $0.11 $0.35 +0.24 Rev % Growth 133.75% 123.55% 28.24% 5.14% 27.66% Yearly EPS $0.75 $1.28 +0.53 EPS $0.39 $-0.14 $-0.03 $0.32 $0.75 Factor Actual EPS Growth Est EPS Growth Change EPS % Growth 178.57% -135.90% 78.57% 1,166.67% 134.38% 3-5 year EPS 63.67% 38.50% -25.17 EPS Surprise EPS Quarterly Results Estimate Actual Difference % Difference FY Qtr 1 Qtr 2 Qtr 3 Qtr 4 Total Latest Qtr $0.28 $0.19 $-0.09 -32.14 12/09 $0.17 $0.12 $0.18 $-0.13 $0.34 1 Qtr Ago $0.32 $0.36 $0.04 12.50 12/10 $0.16 $0.10 $0.11 $0.39 $0.76 2 Qtr Ago $0.29 $0.39 $0.10 34.48 12/11 $0.41 $1.28 - - - 3 Qtr Ago $0.21 $0.11 $-0.10 -47.62 Fiscal Year End Month is December. I want to receive special offers about trading stocks with your brokerage partner, optionsXpress. Click here www.chaikinpowertools.com
- 3. Price Trend & Expert Opinions Price/Volume Activity Price/Volume Activity Rating Relative Strength vs Market Neutral Chaikin Money Flow Price and volume activity for IAG is neutral. IAG has a rising price trend and is experiencing sustained selling. Price Trend The rank for IAG is based on its price strength versus the market, negative Price Trend ROC Chaikin money flow, a positive Chaikin price trend, a negative Chaikin price trend ROC and an increasing volume trend. Volume Trend Relative Strength vs S&P500 Index Chaikin Money Flow Chart shows whether IAG is performing better or worse than the market. Chaikin Money Flow analyzes supply and demand for a company's stock. Price Activity Price Activity Volume Activity Factor Value Factor Value Factor Value 52 Week High 23.25 % Change Price - 4 Weeks 14.55% Average Volume 20 Days 2,813,892 52 Week Low 16.26 % Change Price - 24 Weeks -1.95% Average Volume 90 Days 2,909,722 % Change YTD Rel S&P 500 28.35% % Change Price - 4 Wks Rel to S&P 15.62% Chaikin Money Flow Persistency 28% % Change Price - 24 Wks Rel to S&P 12.23% Expert Opinions Expert Opinions Earnings Estimate Revisions Bullish Short Interest Expert opinions about IAG are positive. Analysts are raising their EPS estimates for IAG and shorting of IAG is low. Insider Activity The rank for IAG is based on analysts revising earnings estimates upward, a low short interest ratio, pessimistic analyst opinions and price strength of the stock Analyst Opinions versus the Metals-Non Ferrous industry group. Relative Strength vs Industry Earnings Estimate Revisions Analyst Recommendations EPS Estimates Revision Summary Current 7 Days Ago % Change Factor Value Last Week Last 4 Weeks Current Qtr 0.35 0.34 +2.94% Mean this Week Buy Up Down Up Down Next Qtr 0.41 0.39 +5.13% Mean Last Week Buy Curr Qtr 0 0 1 1 Curr Yr 0 0 0 0 Current 30 Days Ago % Change Change 0.00 Next Qtr 0 0 1 1 Current FY 1.28 1.25 0.03 Mean 5 Weeks Ago Buy Next Yr 0 0 1 0 I want to receive special offers about trading stocks with your brokerage partner, optionsXpress. Click here www.chaikinpowertools.com
- 4. The Company & Its Competitors IAG's Competitors in Metals-Non Ferrous News Headlines for IAG Company Power Historic EPS Projected EPS Profit Margin PEG PE Revenue(M) Gold Fields Ghana Acquisition Approved - Jun Gauge growth growth 20, 2011 IAG 63.67% 38.50% 55.42% 0.46 21.51 1,167 EURO Ressources Reports Earnings for the AU 16.25% - 13.05% - 14.15 5,514 Quarter Ended March 31, 2011 - May 13, 2011 Gold Fields buys stake in 2 gold mines for ABX 42.85% 18.06% 31.81% 0.61 13.64 10,924 $667M - Apr 15, 2011 NEM 16.86% -2.90% 22.51% -4.83 16.39 9,540 Gold Fields Limited 04 15 - Apr 15, 2011 KGC 33.48% 10.00% 29.61% 2.01 25.76 3,010 Rio Alto Announces Acquisition of 100% of La Arena Project - Feb 9, 2011 GFI 18.29% 15.57% 6.34% 0.97 33.76 4,327 HMY 6.83% 36.38% 5.01% 0.33 55.33 1,732 GG 36.31% 16.93% 40.73% 1.34 28.02 3,800 Company Details Company Profile IAMGOLD CORP IAMGOLD Corp is an international gold exploration and mining company based in 401 BAY STREET Canada. It holds a 38% stake in the Sadiola Gold Mine and a 40% stake in the Yatela TORONTO ONTARIO CANADA, Gold Mine. Both are located in Mali, West Africa. Measured and indicated resources at A6 M5H 2Y4 Sadiola and Yatela are 5.5 million ounces of gold (including reserves of 5.2 million CAN ounces). Inferred resources are 5.9 million ounces. IAMGOLD is actively exploring highly Phone: 4163604710 prospective ground in Africa and South America. Fax: 416-3604750 Website: http://www.iamgold.com Sector: Basic Materials Power Gauge Ratings are created using a relative ranking system that assigns a rank of 0 to 100 (100 being the highest) to each stock in the universe. Rank is calculated by evaluating each of the stocks factors and combining them into a single number using a weighting formula. A stock's rank ranges from 100-0, where 100 is the strongest, and a rank of 95 indicates the stock is better than 95% of the stocks in the universe. Chaikin Stock Research(CSR) is not registered as a securities broker dealer or investment advisor with either the U.S. Securities and Exchange Commission or with any state securities regulatory authority. CSR is not responsible for trades executed by users of this research report, our web site or mobile app based on the information included herein. The information presented in this report does not represent a recommendation to buy or sell stocks or any financial instrument nor is it intended as an endorsement of any security or investment. The information in this report is generic by nature and is not personalized to the specific financial situation of any individual. The user bears complete responsibility for their own investment research and should seek the advice of a qualified investment professional before making any investment decisions. Copyright (c) 1978-(Present) by ZACKS Investment Research, Inc ("ZACKS"). The information, data, analyses and opinions contained herein (1) includes the confidential and proprietary information of ZACKS, (2) may not be copied or redistributed, for any purpose, (3) does not constitute investment advice offered by ZACKS, (4) are provided solely for informational purposes, and (5) are not warranted or represented to be correct, complete, accurate or timely. ZACKS shall not be responsible for investment decisions, damages or other losses resulting from, or related to, use of this information, data, analyses or opinions. Past performance is no guarantee of future performance. ZACKS is not affiliated with Chaikin Power Tools. This report from Chaikin Power Tools is for informational purposes only and is not a recommendation to buy or sell securities. LM 2.3 DS 3.0 LS 2.1 Data Provided by ZACKS Investment Research, Inc., www.zacks.com Special offers to trade stocks from optionsXpress: www.chaikinpowertools.com