Stock Research Report for Yamana Gold Inc ATI as of 11/17/11 - Chaikin Power Tools
•
0 j'aime•140 vues

To order a Chaikin Power Gauge stock research report for ATI go to http://www.chaikinpowertools.com/reports

Recommandé
Contenu connexe
En vedette
En vedette (13)
Plus de Dan Oconnor
Plus de Dan Oconnor (10)
Dernier
Dernier (20)
Stock Research Report for Yamana Gold Inc ATI as of 11/17/11 - Chaikin Power Tools
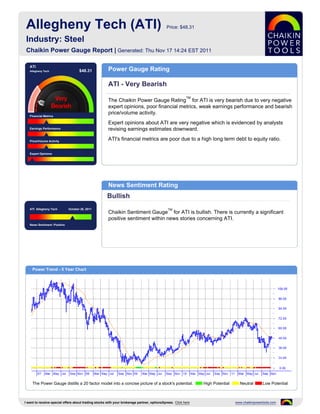
- 1. Allegheny Tech (ATI) Price: $48.31 Industry: Steel Chaikin Power Gauge Report | Generated: Thu Nov 17 14:24 EST 2011 ATI Allegheny Tech $48.31 Power Gauge Rating ATI - Very Bearish TM The Chaikin Power Gauge Rating for ATI is very bearish due to very negative expert opinions, poor financial metrics, weak earnings performance and bearish price/volume activity. Financial Metrics Expert opinions about ATI are very negative which is evidenced by analysts Earnings Performance revising earnings estimates downward. Price/Volume Activity ATI's financial metrics are poor due to a high long term debt to equity ratio. Expert Opinions News Sentiment Rating Bullish ATI Allegheny Tech October 26, 2011 TM Chaikin Sentiment Gauge for ATI is bullish. There is currently a significant positive sentiment within news stories concerning ATI. News Sentiment :Positive Power Trend - 5 Year Chart The Power Gauge distills a 20 factor model into a concise picture of a stock's potential. High Potential Neutral Low Potential I want to receive special offers about trading stocks with your brokerage partner, optionsXpress. Click here www.chaikinpowertools.com
- 2. Financials & Earnings Financial Metrics Financial Metrics Rating LT Debt/Equity Ratio Bearish Price to Book Value ATI's financial metrics are poor. The company is carrying too much long term debt and has relatively low revenue per share. Return on Equity The rank is based on a high long term debt to equity ratio and high price to sales ratio. Price to Sales Ratio Business Value Assets and Liabilities Valuation Returns Ratio TTM Ratio TTM Ratio TTM Current Ratio 2.69 Price/Book 1.85 Return on Invest 6.4% LT Debt/Equity 0.43 Price/Sales 1.27 Return on Equity 9.9% Earnings Performance Earnings Performance Rating Earnings Growth Bearish Earnings Surprise ATI's earnings performance has been weak. The company has a history of weak earnings growth and has not met analysts' earnings estimates. Earnings Trend The rank is based on poor EPS growth over the past 3-5 years, worse than expected earnings in recent quarters, an upward trend in earnings this year, a Projected P/E Ratio relatively high projected P/E ratio and consistent earnings over the past 5 years. Earnings Consistency 5 Year Revenue and Earnings Growth EPS Estimates 12/06 12/07 12/08 12/09 12/10 Factor Actual EPS Prev EST EPS Current Change Revenue(M) 4,936.60 5,452.50 5,309.70 3,054.90 4,047.80 Quarterly EPS $0.16 $0.56 +0.40 Rev % Growth 39.46% 10.45% -2.62% -42.47% 32.50% Yearly EPS $0.72 $2.46 +1.74 EPS $5.74 $7.35 $5.71 $0.33 $0.72 Factor Actual EPS Growth Est EPS Growth Change EPS % Growth 60.34% 28.05% -22.31% -94.22% 118.18% 3-5 year EPS 7.46% 15.00% +7.54 EPS Surprise EPS Quarterly Results Estimate Actual Difference % Difference FY Qtr 1 Qtr 2 Qtr 3 Qtr 4 Total Latest Qtr $0.61 $0.63 $0.02 3.28 12/09 $0.06 $-0.14 $0.01 $0.39 $0.32 1 Qtr Ago $0.73 $0.70 $-0.03 -4.11 12/10 $0.19 $0.37 $0.01 $0.16 $0.73 2 Qtr Ago $0.49 $0.54 $0.05 10.20 12/11 $0.58 $0.63 $0.59 - - 3 Qtr Ago $0.30 $0.31 $0.01 3.33 Fiscal Year End Month is December. I want to receive special offers about trading stocks with your brokerage partner, optionsXpress. Click here www.chaikinpowertools.com
- 3. Price Trend & Expert Opinions Price/Volume Activity Price/Volume Activity Rating Relative Strength vs Market Bearish Chaikin Money Flow Price and volume activity for ATI is bearish. ATI is experiencing sustained selling and has underperformed the S&P 500 over 26 weeks. Price Trend The rank for ATI is based on its relative weakness versus the market, negative Price Trend ROC Chaikin money flow, a negative Chaikin price trend and a positive Chaikin price trend ROC. Volume Trend Relative Strength vs S&P500 Index Chaikin Money Flow Chart shows whether ATI is performing better or worse than the market. Chaikin Money Flow analyzes supply and demand for a company's stock. Price Activity Price Activity Volume Activity Factor Value Factor Value Factor Value 52 Week High 72.74 % Change Price - 4 Weeks 25.84% Average Volume 20 Days 2,568,642 52 Week Low 32.78 % Change Price - 24 Weeks -25.60% Average Volume 90 Days 2,736,911 % Change YTD Rel S&P 500 -9.85% % Change Price - 4 Wks Rel to S&P 23.09% Chaikin Money Flow Persistency 36% % Change Price - 24 Wks Rel to S&P -20.93% Expert Opinions Expert Opinions Earnings Estimate Revisions Very Bearish Short Interest Expert opinions about ATI are very negative. Analysts are lowering their EPS estimates for ATI and short interest in ATI is high. Insider Activity The rank for ATI is based on analysts revising earnings estimates downward, a high short interest ratio and optimistic analyst opinions. Analyst Opinions Relative Strength vs Industry Earnings Estimate Revisions Analyst Recommendations EPS Estimates Revision Summary Current 7 Days Ago % Change Factor Value Last Week Last 4 Weeks Current Qtr 0.56 0.57 -1.75% Mean this Week Buy Up Down Up Down Next Qtr 0.77 0.77 0.00% Mean Last Week Buy Curr Qtr 0 1 0 5 Curr Yr 0 0 0 3 Current 30 Days Ago % Change Change -0.08 Next Qtr 0 0 1 2 Current FY 2.46 2.65 -0.19 Mean 5 Weeks Ago Buy Next Yr 0 1 0 8 I want to receive special offers about trading stocks with your brokerage partner, optionsXpress. Click here www.chaikinpowertools.com
- 4. The Company & Its Competitors ATI's Competitors in Steel News Headlines for ATI Company Power Historic EPS Projected EPS Profit Margin PEG PE Revenue(M) Allegheny Technologies Completes Acquisition Gauge growth growth of Ladish - May 9, 2011 ATI 7.46% 15.00% 3.98% 1.31 22.18 4,048 BRIEF: Allegheny Technologies sells debt - Jan SUTR 4.02% 25.00% 3.24% 0.10 3.08 432 5, 2011 Tripp Levy PLLC Announces That a Shareholder MASC -13.15% - 8.51% - 9.13 138 Lawsuit Has Been Filed on Behalf of Ladish HAYN -0.37% - 5.13% - 24.92 - Shareholders Regarding Ladish’s Buyout - Dec 28, 2010 CRS 4.39% - 5.02% - 27.76 1,675 2 local companies making acquisitions - Nov 18, RTI 21.19% 12.00% 1.01% 7.28 - 432 2010 Allegheny Technologies boosts hold in aerospace - Nov 18, 2010 Company Details Company Profile ALLEGHENY TECH Allegheny Technologies Incorporated is one of the largest and most diversified producers 1000 SIX PPG PLACE of specialty materials in the world. The company's talented people use innovative PITTSBURGH, PA 15222 technologies to offer growing global markets a wide range of specialty materials including USA stainless steel, nickel-based and cobalt-based alloys and superalloys, titanium and Phone: 4123942800 titanium alloys, specialty steel alloys, zirconium and related alloys, and tungsten-based Fax: 412-394-3034 specialty materials. The goal is to be the low cost, high quality supplier to global markets. Website: (PRESS RELEASE) http://http://www.alleghenytechnolo gies.com Full Time Employees: 9,200 Sector: Basic Materials Power Gauge Ratings are created using a relative ranking system that assigns a rank of 0 to 100 (100 being the highest) to each stock in the universe. Rank is calculated by evaluating each of the stocks factors and combining them into a single number using a weighting formula. A stock's rank ranges from 100-0, where 100 is the strongest, and a rank of 95 indicates the stock is better than 95% of the stocks in the universe. Chaikin Stock Research(CSR) is not registered as a securities broker dealer or investment advisor with either the U.S. Securities and Exchange Commission or with any state securities regulatory authority. CSR is not responsible for trades executed by users of this research report, our web site or mobile app based on the information included herein. The information presented in this report does not represent a recommendation to buy or sell stocks or any financial instrument nor is it intended as an endorsement of any security or investment. The information in this report is generic by nature and is not personalized to the specific financial situation of any individual. The user bears complete responsibility for their own investment research and should seek the advice of a qualified investment professional before making any investment decisions. Copyright (c) 1978-(Present) by ZACKS Investment Research, Inc ("ZACKS"). The information, data, analyses and opinions contained herein (1) includes the confidential and proprietary information of ZACKS, (2) may not be copied or redistributed, for any purpose, (3) does not constitute investment advice offered by ZACKS, (4) are provided solely for informational purposes, and (5) are not warranted or represented to be correct, complete, accurate or timely. ZACKS shall not be responsible for investment decisions, damages or other losses resulting from, or related to, use of this information, data, analyses or opinions. Past performance is no guarantee of future performance. ZACKS is not affiliated with Chaikin Power Tools. This report from Chaikin Power Tools is for informational purposes only and is not a recommendation to buy or sell securities. LM 2.3 DS 3.0 LS 2.1 Data Provided by ZACKS Investment Research, Inc., www.zacks.com Special offers to trade stocks from optionsXpress: www.chaikinpowertools.com