Stock Research Report for Yamana Gold Inc CF as of 11/17/11 - Chaikin Power Tools
•
1 j'aime•160 vues

To order a Chaikin Power Gauge stock research report for CF go to http://www.chaikinpowertools.com/reports

Recommandé
Recommandé
Contenu connexe
Plus de Dan Oconnor
Plus de Dan Oconnor (10)
Dernier
Dernier (20)
Stock Research Report for Yamana Gold Inc CF as of 11/17/11 - Chaikin Power Tools
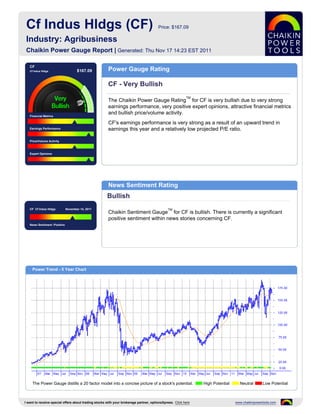
- 1. Cf Indus Hldgs (CF) Price: $167.09 Industry: Agribusiness Chaikin Power Gauge Report | Generated: Thu Nov 17 14:23 EST 2011 CF Cf Indus Hldgs $167.09 Power Gauge Rating CF - Very Bullish TM The Chaikin Power Gauge Rating for CF is very bullish due to very strong earnings performance, very positive expert opinions, attractive financial metrics and bullish price/volume activity. Financial Metrics CF's earnings performance is very strong as a result of an upward trend in Earnings Performance earnings this year and a relatively low projected P/E ratio. Price/Volume Activity Expert Opinions News Sentiment Rating Bullish CF Cf Indus Hldgs November 14, 2011 TM Chaikin Sentiment Gauge for CF is bullish. There is currently a significant positive sentiment within news stories concerning CF. News Sentiment :Positive Power Trend - 5 Year Chart The Power Gauge distills a 20 factor model into a concise picture of a stock's potential. High Potential Neutral Low Potential I want to receive special offers about trading stocks with your brokerage partner, optionsXpress. Click here www.chaikinpowertools.com
- 2. Financials & Earnings Financial Metrics Financial Metrics Rating LT Debt/Equity Ratio Bullish Price to Book Value CF's financial metrics are very good. The company yields a high return on shareholder's equity and generates high free cash flow relative to market Return on Equity capitalization. The rank is based on a high price to book value ratio, high return on equity, high Price to Sales Ratio price to sales ratio and relatively high cash flow. Business Value Assets and Liabilities Valuation Returns Ratio TTM Ratio TTM Ratio TTM Current Ratio 1.37 Price/Book 2.52 Return on Invest 20.3% LT Debt/Equity 0.44 Price/Sales 3.02 Return on Equity 27.4% Earnings Performance Earnings Performance Rating Earnings Growth Very Bullish Earnings Surprise CF's earnings performance has been very strong. The company experienced superior earnings growth in the past 12 months and is priced relatively low compared to next year's projected EPS. Earnings Trend The rank is based on better than expected earnings in recent quarters, an upward Projected P/E Ratio trend in earnings this year, a relatively low projected P/E ratio and consistent earnings over the past 5 years. Earnings Consistency 5 Year Revenue and Earnings Growth EPS Estimates 12/06 12/07 12/08 12/09 12/10 Factor Actual EPS Prev EST EPS Current Change Revenue(M) 1,949.50 2,756.70 3,921.10 2,608.40 3,965.00 Quarterly EPS $2.81 $6.68 +3.87 Rev % Growth -0.94% 41.41% 42.24% -33.48% 52.01% Yearly EPS $5.40 $22.55 +17.15 EPS $0.60 $6.71 $12.38 $7.54 $5.40 Factor Actual EPS Growth Est EPS Growth Change EPS % Growth 184.51% 1,018.33% 84.50% -39.10% -28.38% 3-5 year EPS 20.25% 12.00% -8.25 EPS Surprise EPS Quarterly Results Estimate Actual Difference % Difference FY Qtr 1 Qtr 2 Qtr 3 Qtr 4 Total Latest Qtr $4.82 $5.16 $0.34 7.05 12/09 $1.29 $4.40 $0.79 $1.06 $7.54 1 Qtr Ago $5.94 $6.87 $0.93 15.66 12/10 $-0.09 $1.56 $0.68 $2.81 $4.96 2 Qtr Ago $3.23 $3.81 $0.58 17.96 12/11 $3.95 $6.81 $4.77 - - 3 Qtr Ago $2.62 $2.65 $0.03 1.15 Fiscal Year End Month is December. I want to receive special offers about trading stocks with your brokerage partner, optionsXpress. Click here www.chaikinpowertools.com
- 3. Price Trend & Expert Opinions Price/Volume Activity Price/Volume Activity Rating Relative Strength vs Market Bullish Chaikin Money Flow Price and volume activity for CF is bullish. CF has outperformed the S&P 500 over 26 weeks and is experiencing sustained buying. Price Trend The rank for CF is based on its price strength versus the market, positive Chaikin Price Trend ROC money flow, a positive Chaikin price trend, a negative Chaikin price trend ROC and a decreasing volume trend. Volume Trend Relative Strength vs S&P500 Index Chaikin Money Flow Chart shows whether CF is performing better or worse than the market. Chaikin Money Flow analyzes supply and demand for a company's stock. Price Activity Price Activity Volume Activity Factor Value Factor Value Factor Value 52 Week High 189.78 % Change Price - 4 Weeks 16.35% Average Volume 20 Days 1,737,222 52 Week Low 114.52 % Change Price - 24 Weeks 12.75% Average Volume 90 Days 2,450,896 % Change YTD Rel S&P 500 27.10% % Change Price - 4 Wks Rel to S&P 13.80% Chaikin Money Flow Persistency 66% % Change Price - 24 Wks Rel to S&P 19.82% Expert Opinions Expert Opinions Earnings Estimate Revisions Very Bullish Short Interest Expert opinions about CF are very positive. Analysts are raising their EPS estimates for CF and analysts's opinions on CF have been more positive recently. Insider Activity The rank for CF is based on analysts revising earnings estimates upward, a low short interest ratio, optimistic analyst opinions and relative weakness of the stock Analyst Opinions versus the Agribusiness industry group. Relative Strength vs Industry Earnings Estimate Revisions Analyst Recommendations EPS Estimates Revision Summary Current 7 Days Ago % Change Factor Value Last Week Last 4 Weeks Current Qtr 6.68 6.68 0.00% Mean this Week Buy Up Down Up Down Next Qtr 5.11 5.11 0.00% Mean Last Week Buy Curr Qtr 0 0 7 0 Curr Yr 0 0 7 0 Current 30 Days Ago % Change Change 0.00 Next Qtr 0 0 3 0 Current FY 22.55 20.91 1.64 Mean 5 Weeks Ago Buy Next Yr 0 0 7 1 I want to receive special offers about trading stocks with your brokerage partner, optionsXpress. Click here www.chaikinpowertools.com
- 4. The Company & Its Competitors CF's Competitors in Agribusiness News Headlines for CF Company Power Historic EPS Projected EPS Profit Margin PEG PE Revenue(M) Fertilizer group spent $367,110 lobbying in 1Q - Gauge growth growth Jun 20, 2011 CF 20.25% 12.00% 23.15% 0.62 9.03 3,965 CF Industries settles emissions case at 9 plants AGU 28.48% - 9.15% - 8.78 10,520 - Apr 19, 2011 CF Industries Reaches Settlement Resolving POT 24.77% - 33.25% - 13.52 6,539 EPA Complaint - Apr 19, 2011 TNH 10.47% - 59.94% - 12.08 565 Fitch: Record Crop Prices Profit CF Industries; IDR Upgraded to 'BBB-' - Mar 11, 2011 MOS 19.28% - 25.32% - 11.25 9,938 BRIEF: Ag co-op buys local terminal - Jan 7, SQM 17.61% 16.86% 22.24% 1.59 34.01 1,830 2011 IPI -4.14% - 23.63% - 20.84 359 Company Details Company Profile CF INDUS HLDGS CF Industries Holdings, Inc. is the holding company for the operations of CF Industries, 4 PARKWAY NORTH SUITE 400 Inc. CF Industries, Inc. is a major producer and distributor of nitrogen and phosphate DEERFIELD, IL 60015 fertilizer products. CF Industries operates world-scale nitrogen fertilizer plants in USA Louisiana and Alberta, Canada; conducts phosphate mining and manufacturing Phone: (847) 405-2400 operations in Central Florida; and distributes fertilizer products through a system of Fax: 847-405-2400 terminals, warehouses, and associated transportation equipment located primarily in the Website: midwestern United States. http://http://www.cfindustries.com Full Time Employees: 2,500 Sector: Basic Materials Power Gauge Ratings are created using a relative ranking system that assigns a rank of 0 to 100 (100 being the highest) to each stock in the universe. Rank is calculated by evaluating each of the stocks factors and combining them into a single number using a weighting formula. A stock's rank ranges from 100-0, where 100 is the strongest, and a rank of 95 indicates the stock is better than 95% of the stocks in the universe. Chaikin Stock Research(CSR) is not registered as a securities broker dealer or investment advisor with either the U.S. Securities and Exchange Commission or with any state securities regulatory authority. CSR is not responsible for trades executed by users of this research report, our web site or mobile app based on the information included herein. The information presented in this report does not represent a recommendation to buy or sell stocks or any financial instrument nor is it intended as an endorsement of any security or investment. The information in this report is generic by nature and is not personalized to the specific financial situation of any individual. The user bears complete responsibility for their own investment research and should seek the advice of a qualified investment professional before making any investment decisions. Copyright (c) 1978-(Present) by ZACKS Investment Research, Inc ("ZACKS"). The information, data, analyses and opinions contained herein (1) includes the confidential and proprietary information of ZACKS, (2) may not be copied or redistributed, for any purpose, (3) does not constitute investment advice offered by ZACKS, (4) are provided solely for informational purposes, and (5) are not warranted or represented to be correct, complete, accurate or timely. ZACKS shall not be responsible for investment decisions, damages or other losses resulting from, or related to, use of this information, data, analyses or opinions. Past performance is no guarantee of future performance. ZACKS is not affiliated with Chaikin Power Tools. This report from Chaikin Power Tools is for informational purposes only and is not a recommendation to buy or sell securities. LM 2.3 DS 3.0 LS 2.1 Data Provided by ZACKS Investment Research, Inc., www.zacks.com Special offers to trade stocks from optionsXpress: www.chaikinpowertools.com