Stock Research Report for Yamana Gold Inc CYH as of 11/17/11 - Chaikin Power Tools
•
1 j'aime•251 vues

To order a Chaikin Power Gauge stock research report for CYH go to http://www.chaikinpowertools.com/reports

Recommandé
Contenu connexe
Plus de Dan Oconnor
Plus de Dan Oconnor (10)
Dernier
Dernier (20)
Stock Research Report for Yamana Gold Inc CYH as of 11/17/11 - Chaikin Power Tools
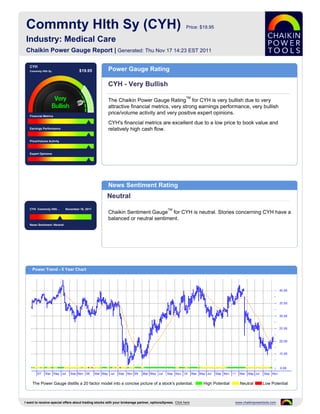
- 1. Commnty Hlth Sy (CYH) Price: $19.95 Industry: Medical Care Chaikin Power Gauge Report | Generated: Thu Nov 17 14:23 EST 2011 CYH Commnty Hlth Sy $19.95 Power Gauge Rating CYH - Very Bullish TM The Chaikin Power Gauge Rating for CYH is very bullish due to very attractive financial metrics, very strong earnings performance, very bullish price/volume activity and very positive expert opinions. Financial Metrics CYH's financial metrics are excellent due to a low price to book value and Earnings Performance relatively high cash flow. Price/Volume Activity Expert Opinions News Sentiment Rating Neutral CYH Commnty Hlth .. November 16, 2011 TM Chaikin Sentiment Gauge for CYH is neutral. Stories concerning CYH have a balanced or neutral sentiment. News Sentiment :Neutral Power Trend - 5 Year Chart The Power Gauge distills a 20 factor model into a concise picture of a stock's potential. High Potential Neutral Low Potential I want to receive special offers about trading stocks with your brokerage partner, optionsXpress. Click here www.chaikinpowertools.com
- 2. Financials & Earnings Financial Metrics Financial Metrics Rating LT Debt/Equity Ratio Very Bullish Price to Book Value CYH's financial metrics are excellent. The company may be undervalued and generates high free cash flow relative to market capitalization. Return on Equity The rank is based on a high long term debt to equity ratio, low price to book value, high return on equity, low price to sales ratio and relatively high cash flow. Price to Sales Ratio Business Value Assets and Liabilities Valuation Returns Ratio TTM Ratio TTM Ratio TTM Current Ratio 1.67 Price/Book 0.77 Return on Invest 2.7% LT Debt/Equity 3.91 Price/Sales 0.14 Return on Equity 12.6% Earnings Performance Earnings Performance Rating Earnings Growth Very Bullish Earnings Surprise CYH's earnings performance has been very strong. The company is priced relatively low compared to next year's projected EPS and has a stable 5 year earnings trend. Earnings Trend The rank is based on high earnings growth over the past 3-5 years, better than Projected P/E Ratio expected earnings in recent quarters, a relatively poor trend in earnings this year, a relatively low projected P/E ratio and consistent earnings over the past 5 years. Earnings Consistency 5 Year Revenue and Earnings Growth EPS Estimates 12/06 12/07 12/08 12/09 12/10 Factor Actual EPS Prev EST EPS Current Change Revenue(M) 4,365.58 7,127.49 10,840.10 12,107.61 12,986.50 Quarterly EPS $0.77 $0.83 +0.06 Rev % Growth 16.78% 63.27% 52.09% 11.69% 7.26% Yearly EPS $3.05 $3.35 +0.30 EPS $1.77 $0.32 $2.34 $2.68 $3.05 Factor Actual EPS Growth Est EPS Growth Change EPS % Growth -6.35% -81.92% 631.25% 14.53% 13.81% 3-5 year EPS 30.22% 12.75% -17.47 EPS Surprise EPS Quarterly Results Estimate Actual Difference % Difference FY Qtr 1 Qtr 2 Qtr 3 Qtr 4 Total Latest Qtr $0.79 $0.86 $0.07 8.86 12/09 $0.65 $0.66 $0.66 $0.71 $2.68 1 Qtr Ago $0.79 $0.81 $0.02 2.53 12/10 $0.76 $0.75 $0.77 $0.77 $3.05 2 Qtr Ago $0.78 $0.80 $0.02 2.56 12/11 $0.67 $0.39 $0.83 - - 3 Qtr Ago $0.73 $0.76 $0.03 4.11 Fiscal Year End Month is December. I want to receive special offers about trading stocks with your brokerage partner, optionsXpress. Click here www.chaikinpowertools.com
- 3. Price Trend & Expert Opinions Price/Volume Activity Price/Volume Activity Rating Relative Strength vs Market Very Bullish Chaikin Money Flow Price and volume activity for CYH is very bullish. CYH is in an accelerating price trend compared to 4 months ago and is trading on higher volume than its 90 day Price Trend average volume. Price Trend ROC The rank for CYH is based on its relative weakness versus the market, positive Chaikin money flow, a negative Chaikin price trend, a positive Chaikin price trend ROC and an increasing volume trend. Volume Trend Relative Strength vs S&P500 Index Chaikin Money Flow Chart shows whether CYH is performing better or worse than the market. Chaikin Money Flow analyzes supply and demand for a company's stock. Price Activity Price Activity Volume Activity Factor Value Factor Value Factor Value 52 Week High 42.10 % Change Price - 4 Weeks 10.33% Average Volume 20 Days 2,479,938 52 Week Low 15.29 % Change Price - 24 Weeks -28.42% Average Volume 90 Days 2,192,099 % Change YTD Rel S&P 500 -43.04% % Change Price - 4 Wks Rel to S&P 7.92% Chaikin Money Flow Persistency 52% % Change Price - 24 Wks Rel to S&P -23.93% Expert Opinions Expert Opinions Earnings Estimate Revisions Very Bullish Short Interest Expert opinions about CYH are very positive. Analysts are raising their EPS estimates for CYH and insiders are net buyers of CYH's stock. Insider Activity The rank for CYH is based on analysts revising earnings estimates upward, insiders purchasing stock and optimistic analyst opinions. Analyst Opinions Relative Strength vs Industry Earnings Estimate Revisions Analyst Recommendations EPS Estimates Revision Summary Current 7 Days Ago % Change Factor Value Last Week Last 4 Weeks Current Qtr 0.83 0.83 0.00% Mean this Week Buy Up Down Up Down Next Qtr 0.87 0.87 0.00% Mean Last Week Buy Curr Qtr 0 0 5 6 Curr Yr 0 0 10 0 Current 30 Days Ago % Change Change 0.00 Next Qtr 0 0 4 3 Current FY 3.35 3.28 0.07 Mean 5 Weeks Ago Buy Next Yr 0 0 8 1 I want to receive special offers about trading stocks with your brokerage partner, optionsXpress. Click here www.chaikinpowertools.com
- 4. The Company & Its Competitors CYH's Competitors in Medical Care News Headlines for CYH Company Power Historic EPS Projected EPS Profit Margin PEG PE Revenue(M) Community Health Systems Announces Gauge growth growth Definitive Agreement To Acquire Roswell, New CYH 30.22% 12.75% 1.76% 0.47 6.18 12,986 Mexico Hospital - Nov 16, 2011 HMA 7.43% 12.00% 3.15% 0.91 11.30 5,115 Community Health Systems, Inc. Announces the Acquisition of Tomball, Texas Hospital - Oct 3, LPNT 12.36% 9.57% 4.62% 1.25 12.14 3,262 2011 MD 15.18% 13.38% 13.75% 1.15 15.61 1,402 Kootenai Health to buy Heart Clinics - Sep 22, 2011 THC -0.75% 8.25% 2.44% 1.37 12.38 9,205 UCH health centers change names; merger may WOOF 10.63% 10.17% 8.26% 1.36 13.88 1,381 create 400 jobs - Sep 20, 2011 UHS 7.24% 12.67% 4.71% 0.80 11.13 5,568 Community Health Systems Announces Divestiture of Tulsa and Claremore, Oklahoma MDTH -10.32% - 3.79% - - - Facilities - Sep 1, 2011 Company Details Company Profile COMMNTY HLTH SY Community Health Systems, Inc. is a leading provider of non-urban acute healthcare 4000 MERIDIAN BOULEVARD services. Their facilities, together with their medical staffs, provide a wide range of FRANKLIN, TN 37067 inpatient and outpatient acute care services and a variety of specialty services. USA Phone: 615-465-7000 Fax: 615-645-7001 Website: http://http://www.chs.net Full Time Employees: 87,000 Sector: Medical Power Gauge Ratings are created using a relative ranking system that assigns a rank of 0 to 100 (100 being the highest) to each stock in the universe. Rank is calculated by evaluating each of the stocks factors and combining them into a single number using a weighting formula. A stock's rank ranges from 100-0, where 100 is the strongest, and a rank of 95 indicates the stock is better than 95% of the stocks in the universe. Chaikin Stock Research(CSR) is not registered as a securities broker dealer or investment advisor with either the U.S. Securities and Exchange Commission or with any state securities regulatory authority. CSR is not responsible for trades executed by users of this research report, our web site or mobile app based on the information included herein. The information presented in this report does not represent a recommendation to buy or sell stocks or any financial instrument nor is it intended as an endorsement of any security or investment. The information in this report is generic by nature and is not personalized to the specific financial situation of any individual. The user bears complete responsibility for their own investment research and should seek the advice of a qualified investment professional before making any investment decisions. Copyright (c) 1978-(Present) by ZACKS Investment Research, Inc ("ZACKS"). The information, data, analyses and opinions contained herein (1) includes the confidential and proprietary information of ZACKS, (2) may not be copied or redistributed, for any purpose, (3) does not constitute investment advice offered by ZACKS, (4) are provided solely for informational purposes, and (5) are not warranted or represented to be correct, complete, accurate or timely. ZACKS shall not be responsible for investment decisions, damages or other losses resulting from, or related to, use of this information, data, analyses or opinions. Past performance is no guarantee of future performance. ZACKS is not affiliated with Chaikin Power Tools. This report from Chaikin Power Tools is for informational purposes only and is not a recommendation to buy or sell securities. LM 2.3 DS 3.0 LS 2.1 Data Provided by ZACKS Investment Research, Inc., www.zacks.com Special offers to trade stocks from optionsXpress: www.chaikinpowertools.com