Las Vegas Sands Corp technical analysis charts
•
0 j'aime•109 vues

Las Vegas Sands Corp technical analysis charts

Recommandé
Recommandé
Contenu connexe
Dernier
Dernier (20)
En vedette
En vedette (20)
Las Vegas Sands Corp technical analysis charts
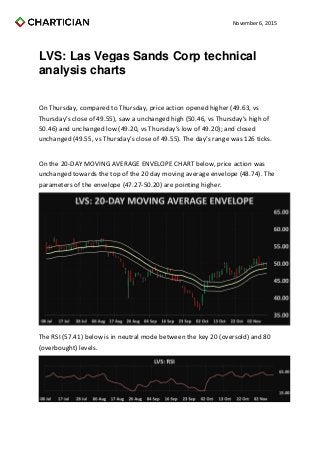
- 1. November 6, 2015 LVS: Las Vegas Sands Corp technical analysis charts On Thursday, compared to Thursday, price action opened higher (49.63, vs Thursday’s close of 49.55), saw a unchanged high (50.46, vs Thursday’s high of 50.46) and unchanged low (49.20, vs Thursday’s low of 49.20); and closed unchanged (49.55, vs Thursday’s close of 49.55). The day’s range was 126 ticks. On the 20-DAY MOVING AVERAGE ENVELOPE CHART below, price action was unchanged towards the top of the 20 day moving average envelope (48.74). The parameters of the envelope (47.27-50.20) are pointing higher. The RSI (57.41) below is in neutral mode between the key 20 (oversold) and 80 (overbought) levels.
- 2. November 6, 2015 The MACD 12 day moving average is below the MACD 26 day moving average; both are above zero and rising. The Slow Stochastics, below, are in negative mode, with the K line below the D line. The Commodity Channel Index (62.69), below, is in positive mode above the oversold -200 level. On the DAILY BOLLINGER BANDS CHART below, Thursday represents the 3rd consecutive entire day above the middle of the Bollinger Band envelope (48.74), in negative mode towards the middle of the envelope The Bollinger Bands (46.28- 51.19) are converging; and narrowed from a width of 535 ticks on Thursday to a width of 491 ticks on Thursday.
- 3. November 6, 2015 On the 5 AND 20 DAY MOVING AVERAGES CHART below, the 5 day moving average (49.85, moving down) is above the 20 day moving average (48.74, moving up), in positive mode. The 3-50 day strip of moving averages ranges from the 40 day moving average (46.01) at the bottom of the range to the 5 day moving average (49.85) at the top of the range.
- 4. November 6, 2015 The Parabolic Stop and Reverse (48.40) below is in the 8th day of buy mode. On the WEEKLY BOLLINGER BANDS CHART below, last week represents the 5th consecutive close below the middle of the Bollinger Bands envelope (49.84). The Bollinger Bands (41.10-58.57) are pointing lower; contracting from a width of 1,768 ticks on Thursday to a width of 1,747 ticks on Thursday.