Zynga technical analysis charts
•
0 j'aime•107 vues

Zynga technical analysis charts
Signaler
Partager
Signaler
Partager
Télécharger pour lire hors ligne

Recommandé
Recommandé
(NEHA) Call Girls Katra Call Now: 8617697112 Katra Escorts Booking Contact Details WhatsApp Chat: +91-8617697112 Katra Escort Service includes providing maximum physical satisfaction to their clients as well as engaging conversation that keeps your time enjoyable and entertaining. Plus, they look fabulously elegant, making an impression. Independent Escorts Katra understands the value of confidentiality and discretion; they will go the extra mile to meet your needs. Simply contact them via text messaging or through their online profiles; they'd be more than delighted to accommodate any request or arrange a romantic date or fun-filled night together. We provide: (NEHA) Call Girls Katra Call Now 8617697112 Katra Escorts 24x7
(NEHA) Call Girls Katra Call Now 8617697112 Katra Escorts 24x7Call Girls in Nagpur High Profile Call Girls
Model Call Girl Services in Delhi reach out to us at 🔝 9953056974 🔝✔️✔️
Our agency presents a selection of young, charming call girls available for bookings at Oyo Hotels. Experience high-class escort services at pocket-friendly rates, with our female escorts exuding both beauty and a delightful personality, ready to meet your desires. Whether it's Housewives, College girls, Russian girls, Muslim girls, or any other preference, we offer a diverse range of options to cater to your tastes.
We provide both in-call and out-call services for your convenience. Our in-call location in Delhi ensures cleanliness, hygiene, and 100% safety, while our out-call services offer doorstep delivery for added ease.
We value your time and money, hence we kindly request pic collectors, time-passers, and bargain hunters to refrain from contacting us.
Our services feature various packages at competitive rates:
One shot: ₹2000/in-call, ₹5000/out-call
Two shots with one girl: ₹3500/in-call, ₹6000/out-call
Body to body massage with sex: ₹3000/in-call
Full night for one person: ₹7000/in-call, ₹10000/out-call
Full night for more than 1 person: Contact us at 🔝 9953056974 🔝. for details
Operating 24/7, we serve various locations in Delhi, including Green Park, Lajpat Nagar, Saket, and Hauz Khas near metro stations.
For premium call girl services in Delhi 🔝 9953056974 🔝. Thank you for considering us!CHEAP Call Girls in Saket (-DELHI )🔝 9953056974🔝(=)/CALL GIRLS SERVICE
CHEAP Call Girls in Saket (-DELHI )🔝 9953056974🔝(=)/CALL GIRLS SERVICE9953056974 Low Rate Call Girls In Saket, Delhi NCR
In the energy sector, the use of temporal data stands as a pivotal topic. At GRDF, we have developed several methods to effectively handle such data. This presentation will specifically delve into our approaches for anomaly detection and data imputation within time series, leveraging transformers and adversarial training techniques.Anomaly detection and data imputation within time series
Anomaly detection and data imputation within time seriesParis Women in Machine Learning and Data Science
Saudi Arabia [ Abortion pills) Jeddah/riaydh/dammam/+966572737505☎️] cytotec tablets uses abortion pills 💊💊
How effective is the abortion pill? 💊💊 +966572737505) "Abortion pills in Jeddah" how to get cytotec tablets in Riyadh " Abortion pills in dammam*💊💊
The abortion pill is very effective. If you’re taking mifepristone and misoprostol, it depends on how far along the pregnancy is, and how many doses of medicine you take:💊💊 +966572737505) how to buy cytotec pills
At 8 weeks pregnant or less, it works about 94-98% of the time. +966572737505[ 💊💊💊
At 8-9 weeks pregnant, it works about 94-96% of the time. +966572737505)
At 9-10 weeks pregnant, it works about 91-93% of the time. +966572737505)💊💊
If you take an extra dose of misoprostol, it works about 99% of the time.
At 10-11 weeks pregnant, it works about 87% of the time. +966572737505)
If you take an extra dose of misoprostol, it works about 98% of the time.
In general, taking both mifepristone and+966572737505 misoprostol works a bit better than taking misoprostol only.
+966572737505
Taking misoprostol alone works to end the+966572737505 pregnancy about 85-95% of the time — depending on how far along the+966572737505 pregnancy is and how you take the medicine.
+966572737505
The abortion pill usually works, but if it doesn’t, you can take more medicine or have an in-clinic abortion.
+966572737505
When can I take the abortion pill?+966572737505
In general, you can have a medication abortion up to 77 days (11 weeks)+966572737505 after the first day of your last period. If it’s been 78 days or more since the first day of your last+966572737505 period, you can have an in-clinic abortion to end your pregnancy.+966572737505
Why do people choose the abortion pill?
Which kind of abortion you choose all depends on your personal+966572737505 preference and situation. With+966572737505 medication+966572737505 abortion, some people like that you don’t need to have a procedure in a doctor’s office. You can have your medication abortion on your own+966572737505 schedule, at home or in another comfortable place that you choose.+966572737505 You get to decide who you want to be with during your abortion, or you can go it alone. Because+966572737505 medication abortion is similar to a miscarriage, many people feel like it’s more “natural” and less invasive. And some+966572737505 people may not have an in-clinic abortion provider close by, so abortion pills are more available to+966572737505 them.
+966572737505
Your doctor, nurse, or health center staff can help you decide which kind of abortion is best for you.
+966572737505
More questions from patients:
Saudi Arabia+966572737505
CYTOTEC Misoprostol Tablets. Misoprostol is a medication that can prevent stomach ulcers if you also take NSAID medications. It reduces the amount of acid in your stomach, which protects your stomach lining. The brand name of this medication is Cytotec®.+966573737505)
Unwanted Kit is a combination of two mediciAbortion pills in Doha Qatar (+966572737505 ! Get Cytotec
Abortion pills in Doha Qatar (+966572737505 ! Get CytotecAbortion pills in Riyadh +966572737505 get cytotec
Contenu connexe
Dernier
(NEHA) Call Girls Katra Call Now: 8617697112 Katra Escorts Booking Contact Details WhatsApp Chat: +91-8617697112 Katra Escort Service includes providing maximum physical satisfaction to their clients as well as engaging conversation that keeps your time enjoyable and entertaining. Plus, they look fabulously elegant, making an impression. Independent Escorts Katra understands the value of confidentiality and discretion; they will go the extra mile to meet your needs. Simply contact them via text messaging or through their online profiles; they'd be more than delighted to accommodate any request or arrange a romantic date or fun-filled night together. We provide: (NEHA) Call Girls Katra Call Now 8617697112 Katra Escorts 24x7
(NEHA) Call Girls Katra Call Now 8617697112 Katra Escorts 24x7Call Girls in Nagpur High Profile Call Girls
Model Call Girl Services in Delhi reach out to us at 🔝 9953056974 🔝✔️✔️
Our agency presents a selection of young, charming call girls available for bookings at Oyo Hotels. Experience high-class escort services at pocket-friendly rates, with our female escorts exuding both beauty and a delightful personality, ready to meet your desires. Whether it's Housewives, College girls, Russian girls, Muslim girls, or any other preference, we offer a diverse range of options to cater to your tastes.
We provide both in-call and out-call services for your convenience. Our in-call location in Delhi ensures cleanliness, hygiene, and 100% safety, while our out-call services offer doorstep delivery for added ease.
We value your time and money, hence we kindly request pic collectors, time-passers, and bargain hunters to refrain from contacting us.
Our services feature various packages at competitive rates:
One shot: ₹2000/in-call, ₹5000/out-call
Two shots with one girl: ₹3500/in-call, ₹6000/out-call
Body to body massage with sex: ₹3000/in-call
Full night for one person: ₹7000/in-call, ₹10000/out-call
Full night for more than 1 person: Contact us at 🔝 9953056974 🔝. for details
Operating 24/7, we serve various locations in Delhi, including Green Park, Lajpat Nagar, Saket, and Hauz Khas near metro stations.
For premium call girl services in Delhi 🔝 9953056974 🔝. Thank you for considering us!CHEAP Call Girls in Saket (-DELHI )🔝 9953056974🔝(=)/CALL GIRLS SERVICE
CHEAP Call Girls in Saket (-DELHI )🔝 9953056974🔝(=)/CALL GIRLS SERVICE9953056974 Low Rate Call Girls In Saket, Delhi NCR
In the energy sector, the use of temporal data stands as a pivotal topic. At GRDF, we have developed several methods to effectively handle such data. This presentation will specifically delve into our approaches for anomaly detection and data imputation within time series, leveraging transformers and adversarial training techniques.Anomaly detection and data imputation within time series
Anomaly detection and data imputation within time seriesParis Women in Machine Learning and Data Science
Saudi Arabia [ Abortion pills) Jeddah/riaydh/dammam/+966572737505☎️] cytotec tablets uses abortion pills 💊💊
How effective is the abortion pill? 💊💊 +966572737505) "Abortion pills in Jeddah" how to get cytotec tablets in Riyadh " Abortion pills in dammam*💊💊
The abortion pill is very effective. If you’re taking mifepristone and misoprostol, it depends on how far along the pregnancy is, and how many doses of medicine you take:💊💊 +966572737505) how to buy cytotec pills
At 8 weeks pregnant or less, it works about 94-98% of the time. +966572737505[ 💊💊💊
At 8-9 weeks pregnant, it works about 94-96% of the time. +966572737505)
At 9-10 weeks pregnant, it works about 91-93% of the time. +966572737505)💊💊
If you take an extra dose of misoprostol, it works about 99% of the time.
At 10-11 weeks pregnant, it works about 87% of the time. +966572737505)
If you take an extra dose of misoprostol, it works about 98% of the time.
In general, taking both mifepristone and+966572737505 misoprostol works a bit better than taking misoprostol only.
+966572737505
Taking misoprostol alone works to end the+966572737505 pregnancy about 85-95% of the time — depending on how far along the+966572737505 pregnancy is and how you take the medicine.
+966572737505
The abortion pill usually works, but if it doesn’t, you can take more medicine or have an in-clinic abortion.
+966572737505
When can I take the abortion pill?+966572737505
In general, you can have a medication abortion up to 77 days (11 weeks)+966572737505 after the first day of your last period. If it’s been 78 days or more since the first day of your last+966572737505 period, you can have an in-clinic abortion to end your pregnancy.+966572737505
Why do people choose the abortion pill?
Which kind of abortion you choose all depends on your personal+966572737505 preference and situation. With+966572737505 medication+966572737505 abortion, some people like that you don’t need to have a procedure in a doctor’s office. You can have your medication abortion on your own+966572737505 schedule, at home or in another comfortable place that you choose.+966572737505 You get to decide who you want to be with during your abortion, or you can go it alone. Because+966572737505 medication abortion is similar to a miscarriage, many people feel like it’s more “natural” and less invasive. And some+966572737505 people may not have an in-clinic abortion provider close by, so abortion pills are more available to+966572737505 them.
+966572737505
Your doctor, nurse, or health center staff can help you decide which kind of abortion is best for you.
+966572737505
More questions from patients:
Saudi Arabia+966572737505
CYTOTEC Misoprostol Tablets. Misoprostol is a medication that can prevent stomach ulcers if you also take NSAID medications. It reduces the amount of acid in your stomach, which protects your stomach lining. The brand name of this medication is Cytotec®.+966573737505)
Unwanted Kit is a combination of two mediciAbortion pills in Doha Qatar (+966572737505 ! Get Cytotec
Abortion pills in Doha Qatar (+966572737505 ! Get CytotecAbortion pills in Riyadh +966572737505 get cytotec
Dernier (20)
(NEHA) Call Girls Katra Call Now 8617697112 Katra Escorts 24x7
(NEHA) Call Girls Katra Call Now 8617697112 Katra Escorts 24x7
Chintamani Call Girls: 🍓 7737669865 🍓 High Profile Model Escorts | Bangalore ...
Chintamani Call Girls: 🍓 7737669865 🍓 High Profile Model Escorts | Bangalore ...
Mg Road Call Girls Service: 🍓 7737669865 🍓 High Profile Model Escorts | Banga...
Mg Road Call Girls Service: 🍓 7737669865 🍓 High Profile Model Escorts | Banga...
CHEAP Call Girls in Saket (-DELHI )🔝 9953056974🔝(=)/CALL GIRLS SERVICE
CHEAP Call Girls in Saket (-DELHI )🔝 9953056974🔝(=)/CALL GIRLS SERVICE
➥🔝 7737669865 🔝▻ Bangalore Call-girls in Women Seeking Men 🔝Bangalore🔝 Esc...
➥🔝 7737669865 🔝▻ Bangalore Call-girls in Women Seeking Men 🔝Bangalore🔝 Esc...
Digital Advertising Lecture for Advanced Digital & Social Media Strategy at U...
Digital Advertising Lecture for Advanced Digital & Social Media Strategy at U...
👉 Amritsar Call Girl 👉📞 6367187148 👉📞 Just📲 Call Ruhi Call Girl Phone No Amri...
👉 Amritsar Call Girl 👉📞 6367187148 👉📞 Just📲 Call Ruhi Call Girl Phone No Amri...
Call Girls In Doddaballapur Road ☎ 7737669865 🥵 Book Your One night Stand
Call Girls In Doddaballapur Road ☎ 7737669865 🥵 Book Your One night Stand
Cheap Rate Call girls Sarita Vihar Delhi 9205541914 shot 1500 night
Cheap Rate Call girls Sarita Vihar Delhi 9205541914 shot 1500 night
Vip Mumbai Call Girls Thane West Call On 9920725232 With Body to body massage...
Vip Mumbai Call Girls Thane West Call On 9920725232 With Body to body massage...
DATA SUMMIT 24 Building Real-Time Pipelines With FLaNK
DATA SUMMIT 24 Building Real-Time Pipelines With FLaNK
Call Girls In Attibele ☎ 7737669865 🥵 Book Your One night Stand
Call Girls In Attibele ☎ 7737669865 🥵 Book Your One night Stand
Anomaly detection and data imputation within time series
Anomaly detection and data imputation within time series
Abortion pills in Doha Qatar (+966572737505 ! Get Cytotec
Abortion pills in Doha Qatar (+966572737505 ! Get Cytotec
Call Girls Bannerghatta Road Just Call 👗 7737669865 👗 Top Class Call Girl Ser...
Call Girls Bannerghatta Road Just Call 👗 7737669865 👗 Top Class Call Girl Ser...
➥🔝 7737669865 🔝▻ Mathura Call-girls in Women Seeking Men 🔝Mathura🔝 Escorts...
➥🔝 7737669865 🔝▻ Mathura Call-girls in Women Seeking Men 🔝Mathura🔝 Escorts...
En vedette
En vedette (20)
Product Design Trends in 2024 | Teenage Engineerings
Product Design Trends in 2024 | Teenage Engineerings
How Race, Age and Gender Shape Attitudes Towards Mental Health
How Race, Age and Gender Shape Attitudes Towards Mental Health
AI Trends in Creative Operations 2024 by Artwork Flow.pdf
AI Trends in Creative Operations 2024 by Artwork Flow.pdf
Content Methodology: A Best Practices Report (Webinar)
Content Methodology: A Best Practices Report (Webinar)
How to Prepare For a Successful Job Search for 2024
How to Prepare For a Successful Job Search for 2024
Social Media Marketing Trends 2024 // The Global Indie Insights
Social Media Marketing Trends 2024 // The Global Indie Insights
Trends In Paid Search: Navigating The Digital Landscape In 2024
Trends In Paid Search: Navigating The Digital Landscape In 2024
5 Public speaking tips from TED - Visualized summary
5 Public speaking tips from TED - Visualized summary
Google's Just Not That Into You: Understanding Core Updates & Search Intent
Google's Just Not That Into You: Understanding Core Updates & Search Intent
The six step guide to practical project management
The six step guide to practical project management
Beginners Guide to TikTok for Search - Rachel Pearson - We are Tilt __ Bright...
Beginners Guide to TikTok for Search - Rachel Pearson - We are Tilt __ Bright...
Zynga technical analysis charts
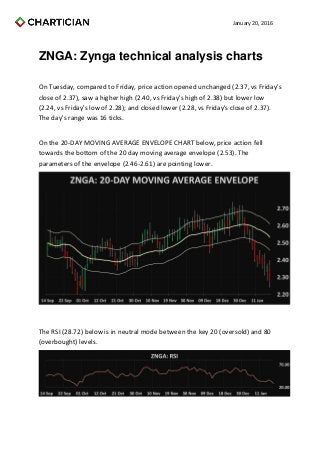
- 1. January 20, 2016 ZNGA: Zynga technical analysis charts On Tuesday, compared to Friday, price action opened unchanged (2.37, vs Friday's close of 2.37), saw a higher high (2.40, vs Friday's high of 2.38) but lower low (2.24, vs Friday's low of 2.28); and closed lower (2.28, vs Friday's close of 2.37). The day's range was 16 ticks. On the 20-DAY MOVING AVERAGE ENVELOPE CHART below, price action fell towards the bottom of the 20 day moving average envelope (2.53). The parameters of the envelope (2.46-2.61) are pointing lower. The RSI (28.72) below is in neutral mode between the key 20 (oversold) and 80 (overbought) levels.
- 2. January 20, 2016 The MACD 12 day moving average is above the MACD 26 day moving average; both are above zero and falling. The Slow Stochastics, below, is in neutral mode. The Commodity Channel Index (-136.60), below, is in positive mode above the oversold -200 level. On the DAILY BOLLINGER BANDS CHART below, Tuesday represents the 4th consecutive close below the middle of the Bollinger Band envelope (2.53). The Bollinger Bands (2.27-2.80) are diverging; and widened from a width of 46 ticks on Friday to a width of 53 ticks on Tuesday.
- 3. January 20, 2016 On the 5 AND 20 DAY MOVING AVERAGES CHART below, the 5 day moving average (2.36, moving down) is below the 20 day moving average (2.53, moving down); in negative mode. The 3-50 day strip of moving averages ranges from the 3 day moving average (2.35) at the bottom of the range to the 40 day moving average (2.56) at the top of the range. The Parabolic Stop and Reverse (2.47) below is in the 11th day of sell mode.
- 4. January 20, 2016 On the WEEKLY BOLLINGER BANDS CHART below, last week represents the 3rd consecutive close below the middle of the Bollinger Bands envelope (2.49). The Bollinger Bands (2.25-2.73) are diverging; expanding from a width of 44 ticks on Friday to a width of 48 ticks on Tuesday.