Why Teams call analytics are critical to your entire business
Aqualogic monitoring system datasheet
1. Datasheet
Aqualogic Monitoring System Key Benefits of Aqualogic
Monitoring System
Monitoring Experience Agent less monitoring saves time and
ensures system availability
Redefined Avoid additional time and cost on
training : Easier installation and
Implementation
Get more Monitoring Acumen Highly Customizable & Rich Dashboard :
Can be tailor-made to client's specific
at no extra cost! needs for realtime statistics
Unique Log reader component allows
AMS is a powerful application monitoring solution that users to read remote log file without
user accounts on production systems
enables administrators and IT Managers to pro actively and
efficiently manage and maintain their multitasking Log Monitoring : AMS monitors log files
and generates alerts
environment from a single user interface.
Role based security/monitoring
AMS generates live statistics and alerts of Connection Pools, Configurable Alert Interval : Get
Servlets, EJBs, Thread Pools, JMS Queues and Topics, Web monitoring results every 15 seconds
Sessions, Server Availability, JVM Statistics and Transactions. Affordable and flexible licensing model
Aqualogic's AMS helps you stay alert, collecting runtime gives ROI
statistics every 15 seconds. AMS helps users to take "Thread Dumps"
to troubleshoot performance issues
AMS makes automatic monitoring possible. It seamlessly Detailed configuration view of servers to
integrates different types of application servers and ensures help validate deployment
remote monitoring consistently. Better capacity management based on
analysis of historical statistics through
Load trend analysis and reporting
AMS enables users to access "JNDI” Tree
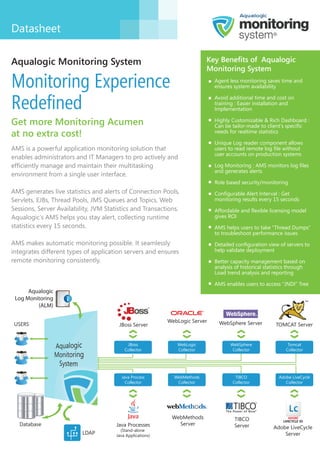
Aqualogic
Log Monitoring
(ALM)
WebLogic Server WebSphere Server
USERS JBoss Server TOMCAT Server
JBoss WebLogic WebSphere Tomcat
Collector Collector Collector Collector
Java Process WebMethods TIBCO Adobe LiveCycle
Collector Collector Collector Collector
WebMethods TIBCO
Database Java Processes Server Server
(Stand-alone
Adobe LiveCycle
LDAP Java Applications) Server
2. Datasheet
Realtime Monitoring
Collects runtime statistics of Connection Pools,
Servlets, EJBs, Thread Pools, JMS Queues and Topics,
Web Sessions, Server Availability, JVM Statistics and
Transactions.
Dashboards
Allows users to create custom dashboards (Flex) to
view the current and historical data. Users are now
able to see the runtime attributes of single server
or multiple servers on a single screen.
Log Monitoring
Unique log monitoring feature monitors log files such
as application server logs, web server logs, Java/J2EE
application logs, database logs and any other
software/service logs. AMS generates alerts based on
predefined keywords/errors or any other specific text.
Monitoring frequency can be configured to as low as
15 seconds to get the real-time alerts.
Inventory
This help users to track and maintain the list of physical
servers/VMs and their hosted application servers.
Besides this, inventory gives a visibility to IT heads
about the list of active projects and the associated
application servers.
AMS classifies different types of environments, this
helps IT administrators to track the application servers by environment type.
Unique search functionality allows the user to find the right server by various parameters such as Server ID,
Server Type, Server Name, Environment name, Project Name, IP address and Port number.
3. Datasheet
Know your Server Configuration in depth!
Platforms Supported
AMS presents server and it's components JBoss (4.* , 5.*, 6* and 7.* versions)
configuration info at one place.
WebLogic (8,9, 10 and 11 versions)
AMS presents tabbed view of the configuration details. Users
can now view all server configuration details and make right Tomcat 5, 6 versions
decisions based on the server status without any delay.
WebSphere 6 & 7 versions
AMS help you to view configuration details of servers, clusters Java Process Monitoring / Standalone
and machines. It also displays the list of listen ports associated Java Application (JDK 1.5, 1.6 & 1.7)
with the particular application server. Apart from the
configuration, it also lists deployed EJBs, Web applications, Adobe LiveCycle and WCMS servers
list of configured connection pools, JMS queues and
Tibco ESB & webMethods
JMS topics.
Flex & BlazeDS
SAP Data Services (Front End)
Server Configuration
Know the type and version of the
installed server, supported Java platform
and its version, server directory, log
directory and other configurations
associated with the servers. It also
displays the start date of server.
Machine Configuration Port Connection Pool
Get the remote machine details Displays the list of listen ports of The connection pool acts as a
where your server is running. all active services running on the reservoir for database
Retrieves info about OS of the application server and web connections. They are stored to
machine, available processor server. be reused when future requests
count in the machine, host to the database are required.
name and host address of the The Connection Pool tab
machine. displays the list of connection
pools available in the server and
its status.
Web Applications EJB Applications JMS Queues
Provides information on web The EJB Applications tab JMS Queues tab displays
applications running currently. displays available EJB (Enterprise available JMS queues in a
It helps the user to see available JavaBean) applications in a particular server.
web applications in a particular particular server.
server.
4. Datasheet
Thread Dumps Utility!
AMS collects Thread Dumps easier way!
Ever caught up in a situation where the usual means
for generating a thread dump does not work, making
it difficult to track down irritating deadlock issues.
AMS helps you a step further here by making Thread
Dumps available in a centralized console.
AMS provides “Thread Dumps” feature Why do we need a
AMS makes it easier to take Thread Dumps, Thread Dump?
bringing the thread Dump at your disposal
When the application server freezes or
without hassle hangs or becomes sluggish for no apparent
AMS enables you to save and maintain Thread reason, Thread Dumps will reveal the exact
Dumps for future reference state of your App server.
Get to the Root Cause: Thread Dumps helps user
analyze Server Hang Situations and the
Root Cause of it
JNDI Tree Utility!
AMS empowers you with details. JNDI feature
strengthens the administrators to confirm the
deployment (EJB) status, validate JDBC data
source, JMS queries, JMS Topics and JMS
connection factories.
AMS allows viewing the JNDI tree in the
servers associated with it.
AMS gives convenient JNDI view as part of its
admin console.
Salient Features of Aqualogic Monitoring System
Collects realtime data and helps analyze server Single console for all the servers in the
performance network
Allows users to create dashboards (Flex) Generates alerts based on the predefined
thresholds
Allows users to see the configuration details of
each server remotely Simplifies the process of taking the thread
dumps. Thread Dumps are viewable on AMS
Manages the inventory of servers, machines and console rather than from server logs
IP addresses
JNDI tree is visible on a single click
Log file monitoring with alerting system
5. Datasheet
AMS Increases ROI, Reducing TCO
Lower your total cost of ownership while fulfilling all your monitoring
requirements with AquaLogic’s Monitoring Solution.
How AMS cuts cost?
AMS lets you support servers anywhere in the globe via remote AFFORDABLE
management.
PRICING MODEL!
AMS’s unique proactive monitoring eliminates the costs associated
with poor performance. Aqualogic offers cost
AMS automates routine monitoring tasks helping the support effective and flexible
team organize their workload and focus on improvements. pricing model on AMS
AMS provides a range of flexible, customizable reports that can be for its customers.
automated to save the time and effort required to produce
management reports.
AMS helps you work with fewer support personnel, translating CUSTOMIZATION
into lower service cost. AT ITS BEST!
AMS helps to manage overhead because of its faster turn-around.
Unlike other monitoring
AMS’s flexible pricing model allows customers to save the solutions, AMS can be
operational cost. customized according to
the customer needs to
meet the ever changing
AMS generates quick alerts! business requirements.
Quickest Alerts with AMS: Avoid undue delays in generating alerts, as
the Monitoring Frequency can be configured to as low as 15 seconds.
Be notified of any
changes in application
servers immediately,
any time.