
Recommandé
Contenu connexe
Tendances
Tendances (18)
Similaire à Q4 2012 wessanen presentation
Similaire à Q4 2012 wessanen presentation (20)
Plus de Klaus Arntz
Plus de Klaus Arntz (20)
Dernier
Dernier (12)
Q4 2012 wessanen presentation
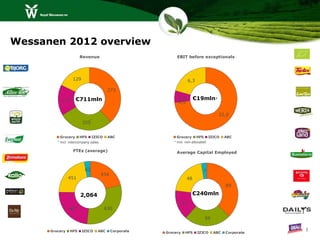
- 1. Wessanen 2012 overview Revenue EBIT before exceptionals 129 6,3 273 €711mln 1,8 €19mln* 113 0,0 22,0 * 205 Grocery HFS IZICO ABC Grocery HFS IZICO ABC * Incl. intercompany sales * Incl. non-allocated FTEs (average) Average Capital Employed 62 7 434 451 48 89 2,064 €240mln 37 487 630 59 Grocery HFS IZICO ABC Corporate 1 Grocery HFS IZICO ABC Corporate
- 2. Royal Wessanen nv Q4/FY 2012 Amsterdam, 22 February 2013 www.wessanen.com
- 3. FY 2012: a challenging year 730 Revenue (in € mln) The economy and market A turbulent year for the global economy Organic market trending positively 720 Our positives Grocery continues to perform well 710 Acquisition of Clipper Teas Creation of one frozen food company 0.7% Strengthening Supervisory Board 700 2011 Price/mix Volume Currency Acq/divest. 2012 Our negatives Performance HFS disappointing ♦ Autonomous third party revenue growth Postponement sale of ABC EBIT (in € mln) Sizeable goodwill impairments Our remedy 23,7 18,8 Initiated a broad restructuring to build a more European -19,0 integrated marketing-led company -45,8 2011 2012 ♦ Reported, ♦ Normalised 3
- 4. Grocery Showing a good performance all throughout the year In € mln Q4-12 Q4-11 Realised 4.6% autonomous growth in 2012 Revenue 68.9 58.7 6.9% in the fourth quarter Autonomous growth 6.9% Core brands growing such as Bjorg, Zonnatura and Whole Earth Normalised EBIT 6.3 1.9 Six out of eight core categories growing Impairments (15.8) (3.0) Other exceptionals (3.5) (0.5) Clipper Teas acquired, UK market leader in organic and fair trade teas EBIT (13.0) (1.6) 11% growth in 2012 In France introduced early 2013 Netherlands to follow next few months In € mln FY12 FY11 Revenue 272.8 243.9 Innovation examples: Bjorg muesli superfruits; coconut milk cooking aid; fourré Autonomous growth 4.6% chocolat with hazelnut Normalised EBIT 22.0 18.0 Zonnatura loose green tea; squeeze fruit/vegetables Kallo gravy granules Impairments (15.8) (3.0) Other exceptionals (4.7) 0.6 EBIT 1.5 15.6 4
- 5. Health Food Stores (HFS) HFS showing a disappointing performance in all three businesses In € mln Q4-12 Q4-11 France impacted by changing health food stores landscape Revenue 50.9 53.3 Rise of chains at expense independent stores Lower sales, especially in wholesale and at fresh Autonomous growth (4.5)% Normalised EBIT 0.8 1.3 Benelux impacted by lost customers and weak performance at Fresh Existing Natuurwinkel and independent stores growing Impairments (23.9) (19.8) Other exceptionals (6.5) (1.0) Germany impacted by weak brand performance Allos and declining revenues at Reformhaus channel (Tartex) EBIT (29.6) (19.5) Innovation examples: Tartex pasta sauces; jubilee yeast pastries In € mln FY12 FY11 Allos crunchy (e.g. almond and cinnamon); muesli (e.g. Revenue 204.8 247.5 cranberry-Goji) Autonomous growth (5.0)% Normalised EBIT - 5.0 Impairments (23.9) (23.1) Other exceptionals (6.5) (3.7) EBIT (30.4) (21.8) 5
- 6. IZICO - integrated frozen foods company Acquiring non-controlling stake Favory paved the way for creation one integrated company In € mln Q4-12 Q4-11 Revenue 29.0 29.1 New management team in place Autonomous growth (0.1)% New name IZICO Normalised EBIT 0.7 0.2 easy (IZI), go (CO), ice (IZ) and company (CO) Impairments (7.0) (14.3) Milestone plan being executed for full alignment and process Other exceptionals (6.2) (0.3) integration Beckers Benelux and Favory EBIT (12.5) (14.4) Combining both headquarters in Breda Integration marketing & sales, operations, finance and HR In € mln FY12 FY11 Closure Favory Deurne plant as of the end of March Revenue 112.5 113.1 Autonomous growth (0.5)% Normalised EBIT 1.8 2.3 Impairments (7.0) (14.3) Other exceptionals (6.2) (0.3) EBIT (11.4) (12.3) 6
- 7. ABC - market leader RTD frozen pouches Capitalising on further optimisation in 2011 after significant In € mln Q4-12 Q4-11 improvement multiple processes in previous years Revenue 16.9 18.0 Strong step-up in marketing spending in $-terms Supporting key seasonal holidays Autonomous growth (4.7)% First-ever national TV advertising campaign Normalised EBIT (3.0) (0.5) Broad range traditional and digital media Impairments - 0.1 Daily’s modest decline in growing RTD market Other exceptionals - 0.1 More competition emerged in frozen pouch segment Remained clear market leader (market share; household EBIT (3.0) (0.3) penetration; repeat purchases) Innovations such as light and season-extending RTD pouches In € mln FY12 FY11 Revenue 128.6 112.6 Little Hug double digits revenue growth Especially 20-pack and 40-pack performing well Autonomous growth 5.7% Multi-year revitalisation process increasingly paying off Normalised EBIT 6.3 9.9 Impairments (0.1) 0.8 Other exceptionals 0.1 0.4 EBIT 6.3 11.1 7
- 8. ABC (cont’d) Why postponement divestment ?! Bids not adequately reflecting fundamental value • Uncertainties attached to relatively short track record in emerging RTD frozen pouch category; perceived to be crowded competitive field Realise better value for our shareholders at a later stage The process Process kicked off in June Conducted a comprehensive process Good level of interest from strategic and financial parties Next steps Reported as ‘continuing operations’ Clear plans / budgets in place Labelled non-core 8
- 9. ‘Wessanen 2015’ Announced late November 2012 Consultation with European and local works councils have been / are taking place Wessanen will become a more consumer- and customer-led company To deliver more efficiently our strategic agenda and to adapt to the changed magnitude and circumstances of the business We have been initiating wide range of actions To increase focus To substantially reduce complexity To become more profitable by reducing costs Detailed plan and timeline with numerous actions at our various businesses Progress (including savings and staff reduction) closely monitored Executing plans in various ‘waves’, to reduce executional risks 9
- 10. ‘Wessanen 2015’ - the numbers Reduction of approx. 300 FTE of which 250 forced redundancies Grocery/HFS/Corporate ± 190FTE IZICO ± 110 FTE Expected one-off costs €(21) mln cash, largely accounted for in Q4, remainder in 2013 €(7.0) mln non-cash due to impairment Deurne plant Expected savings €15mln p.a. from 2014 onwards €10 mln at Grocery/HFS/Corporate € 5mln at IZICO Includes lower employee / other operating expenses Excludes any expected benefits to top-line 10
- 11. ‘Wessanen 2015’ - a wide range of actions Create more focus on our activities Further increased focus on core brands and eight core categories Expansion number of CBTs (category brand teams) Benelux operations split in branded and distribution French HFS operations split in branded and distribution Integration De Rit in Germany operations Reduce complexity / simplify processes Cutting the tail / reducing number of SKUs at • Dutch brands • French HFS brands; exiting frozen range at Bonneterre • Export Centralising quality department Focus on one franchise formula (Natuurwinkel), to end GooodyFooods formula Supply chain to manage our plants as of 2013 Streamlining supply chain processes Addressing low-yielding and non-performing activities Strongly reducing German grocery presence, changing go-to-market approach Focus Italian grocery on non-dairy (soy) 11
- 12. Ronald Merckx (CFO) • Q4/FY financials 12
- 13. Q4/FY key figures In € million Q4-12 Q4-11 FY-12 FY-11 Revenue 163.8 157.2 710.8 706.0 Autonomous growth 0.7% 0.7% Gross contribution 60.9 60.5 270.5 263.6 As % of revenue 37.2% 38.5% 38.1% 37.3% Normalised EBIT 1.9 (1.3) 18.8 23.7 As % of revenue 1.1% (0.8)% 2.6% 3.4% EBIT (61.6) (39.9) (45.8) (19.0) Net result ¹ (61.5) (35.1) (53.2) (17.1) Earnings per share (EPS) (0.81) (0.46) (0.70) (0.23) 13 ¹ Attributable to Wessanen equity holders
- 14. EBIT - from normalised to reported Q4-12 Q4-11 FY-12 FY-11 Normalised EBIT 1.9 (1.3) 18.8 23.7 Impairments (46.7) (37.0) (46.8) (39.6) Wessanen 2015 (16.3) - (16.6) - Other exceptional costs (0.5) (1.6) (1.2) (3.1) EBIT (61.6) (39.9) (45.8) (19.0) 14
- 15. Impairments of goodwill and PPE Grocery UK - Kallo €(15.8) mln Lower growth projections dairy alternatives, loss private label contract, adverse movement pre-tax discount rate (12.1%→12.7%) HFS - Tartex €(19.9) mln Lower growth projections Reformhaus channel Private label business negatively impacted by insolvency one of our customers HFS - Allos €(3.5) mln Lower growth projections 2 core categories Difficulties in passing on increased raw material costs HFS - France €(0.5) mln * Weaker market outlook IZICO €(7.0) mln Closure of Favory Deurne plant in March 2013 * €(0.3) mln relates to goodwill and €(0.2) mln relates to other intangibles 15
- 16. Year end carrying value goodwill/brands In € mln Goodwill Brands Total Grocery - France 10.4 9.1 19.5 Grocery - UK (Kallo / Clipper) 11.1 10.5 21.6 Grocery - Benelux 4.6 - 4.6 HFS - Allos 9.3 2.1 11.4 HFS - Tartex - 1.2 1.2 Carrying value year end 2012 35.4 22.9 58.3 At year end 2012: no carrying value of goodwill and/or brands at Grocery Italy, Grocery Germany, HFS France, HFS Benelux, IZICO and ABC 16
- 17. Cash flow 2012 22.2 (42.3) Increase working (7.6) capital Cash flow from 22.2 earnings (26.1) Sources Net Investments (*) Increase 20.1 of net debt (**) (6.1) Dividends paid (2.5) Derivatives and FX Uses 17
- 18. Net debt / Leverage ratio In € mln 100 Net debt 75 €55 mln 50 25 0 Q4 10 Q1 11 Q2 11 Q3 11 Q4 11 Q1 12 Q2 12 Q3 12 Q4 12 3 Leverage ratio 1.7x 2 1 0 Q4 10 Q1 11 Q2 11 Q3 11 Q4 11 Q1 12 Q2 12 Q3 12 Q4 12 18
- 19. Piet Hein Merckens (CEO) • Closing remarks 19
- 20. Looking forward 2012 was a turbulent year for the global economy Organic food markets continue to trend positively We have made clear progress in numerous areas, however not all initiatives have resulted in desired outcome We have run a connected leadership development programme for our top-60 We have initiated a comprehensive transformation programme As of 2014 €15 mln of savings p.a. All the right actions, full of confidence these will bear fruit 2013 will be another challenging year: “Store is open while we are renovating and innovating” 20
- 21. Appendices 21
- 22. Bridge - revenue growth 2012 In € mln 730 (2.1).% 2.8% 1.8% (4.2)% (0.2)% 2.6% 0.7% 720 710 700 690 Autonomous revenue growth 680 0.7% 670 ts ix e r r cy 1 2 e pe m n 1 1 /m th en e 0 0 u p tm 2 2 O ol li ce rr C V es u ri C P iv D 22
- 23. Bridge: EBITE → EBIT In € mln 30 20 10 €(46.8) €(45.8) 0 ts s E e y O C FS 1 2 al IT t r en B 01 01 IC ra ce on H A EB IZ rm po 2 2 -10 ro ti or G p ai ce p C Im Ex -20 €23.7 €4.0 €(5.0) €(0.5) €(3.6) €0.2 €18.8 €(17.8) -30 -40 -50 23
- 24. Working capital 80 4 quarter average working capital 60 40 20 0 Q4 08 Q2 09 Q4 09 Q2 10 Q4 10 Q2 11 Q4 11 Q2 12 Q4 12 40 q-on-q movement working capital 20 0 -20 -40 Q4 08 Q2 09 Q4 09 Q2 10 Q4 10 Q2 11 Q4 11 Q2 12 Q4 12 24
- 25. Cash flow Q4 2012 3.7 (2.1) Decrease working 1.6 (1.6) Net Investments capital Derivatives and (0.5) FX 2.1 Decrease (1.6) of net Cash flow debt from earnings Sources Uses 25
- 26. A very sound financial position In € mln Dec 12 Dec 11 In € mln Dec12 Dec11 Assets Liabilities Property, plant and equipment 77.4 86.4 Total equity 101.6 166.1 Intangible assets 66.8 90.6 Interest-bearing loans 60.7 37.4 Investment associates/other 1.1 1.0 Employee benefits 24.1 24.0 Deferred tax assets 9.2 8.8 Provisions / Deferred tax liabilities 5.4 3.9 Non-current assets 154.5 186.8 Non-current liabilities 90.2 65.3 Bank overdrafts / current debt 1.4 2.9 Inventories 72.3 67.5 Interest-bearing loans/borrowings 2.5 0.1 Income tax receivables - 2.2 Provisions 16.8 3.3 Trade receivables 85.7 78.9 Income tax payables 0.7 0.5 Other receivables / prepayments 15.7 24.4 Trade payables 68.3 70.5 Cash (equivalents) 9.7 8.2 Non-trade payables/accrued expenses 56.4 59.3 Current assets 183.4 181.2 Current liabilities 146.1 136.6 TOTAL ASSETS 337.9 368.0 TOTAL EQUITY & LIABILITIES 337.9 368.0 26
- 27. Financials Q4/FY - guidance 2013 Financials Q4 Net financing costs €(1.1) mln Q4-11: €(0.9) mln Income tax expenses €1.2 mln Q4-11: €1.7 mln Capex €(1.2) mln Q4-11: €(3.3) mln Financials Full Year Net financing costs €(3.8) mln FY-11: €(3.5) mln Income tax expenses €(3.9) mln FY-11: €1.5 mln Capex €(5.7) mln FY-11: €(10.2) mln Guidance 2013 Net financing costs €(3)-(4) mln Effective tax rate around 35% Capex €(8)-(10) mln Depreciation and amortisation €(14) mln Non-allocated expenses (incl. corporate) €(11) mln 27
- 28. Royal Wessanen nv Q4 2011 Amsterdam, 23 February 2012
Notes de l'éditeur
- Mar 6, 2013 Wessanen overview