Tortillas on the Roaster - climate change and maize and beans production in Central America

In order to be able to adapt to climate change, bean producing smallholders in Central America have to know which type of changes and to which extent and ranges these changes will occur. Adaptation is only possible if global climate predictions are broken down on local levels, to give farmers a direction on what to adapt to, but also to provide detailed information about the extent of climate change impact and the exact location of the affected population to local, national, and regional governments and authorities, and the international cooperation/donors in order to coordinate and focus their interventions in the future. There will be people who will be more affected by climate change than others; some might have to leave the agricultural sector while others will have to change their whole operation. But there will be also new opportunities for those who will adapt quickly making them winners of changes in climate. This technical report seeks to assess the expected impact of climate change on bean production in 4 countries in Central America. We downscaled GCM (Global Climate Models) to a local scale, predicted future bean production using a dynamic crop model called DSSAT (Decision Support for Agro-technology Transfer), we identified based on the DSSAT-results 3 types of focus-spots where impact is predicted to be significant and run DSSAT again with the full range of available GCMs to address uncertainty of model predictions. Alongside this analysis we started a field trial using 10 bean varieties in 5 countries to calibrate DSSAT and run it in post-project-stage again in order to make assumptions on determining factors and possible breeding strategies. Outputs of downscaled climate data show that temperature is predicted to increase in the future, while precipitation will slightly reduce. Crop modeling shows that bean yields will decrease high along the dry corridor in Central America and Hot-Spots with more than 50% yield reduce could be identified in the study area. Based on the results we finally made recommendations for adaptation- and mitigation strategies which will be handed over to decision makers afterwards.

Recommandé
Recommandé
Contenu connexe
Similaire à Tortillas on the Roaster - climate change and maize and beans production in Central America
Similaire à Tortillas on the Roaster - climate change and maize and beans production in Central America (20)
Plus de Decision and Policy Analysis Program
Plus de Decision and Policy Analysis Program (20)
Tortillas on the Roaster - climate change and maize and beans production in Central America
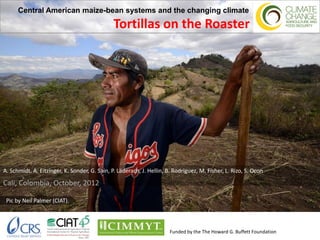
- 1. Central American maize-bean systems and the changing climate Tortillas on the Roaster A. Schmidt, A. Eitzinger, K. Sonder, G. Sain, P. Läderach, J. Hellin, B. Rodriguez, M. Fisher, L. Rizo, S. Ocon Cali, Colombia, October, 2012 Pic by Neil Palmer (CIAT). Funded by the The Howard G. Buffett Foundation
- 2. In Central America more than 1 million smallholder families depend on the cultivation of maize and/or beans for their subsistence. Frequently there is a high vulnerability to extended drought periods and extreme weather events such as hurricanes putting the food security of these smallholder families at risk. As climate already is changing by getting hotter & dryer, maize-bean farmers in Central America will be forced to adapt to changes in crop suitability to maintain food security. “Tortillas on the Roaster” seeks to predict locally specific changes in maize bean production systems that people can act and respond to ongoing climate change by concrete adaptation measures. 2
- 3. Activity line and main objectives 3
- 4. Methods: Climate data Provide local scale Climate predictions • For current climate (baseline) we used historical climate data from WorldClim Meteorological stations on which WorldClim is based in the study area www.worldclim.org • Future climate: 21 global climate models (GCMs) from IPCC (WCRP CMIP3) - SRES-A2, 2020 & 2050 • Downscaling (CIAT Decision and Policy Analysis Working Paper, no. 1, “delta-method”) to provide higher-resolution (2.5 arc-minutes ~ 5 kilometer)
- 5. Methods: daily climate data Generate daily climate data for • Generating characteristic daily DSSAT weather data with MarkSim* *MarkSim was developed to generate precipitation data for tropical regions. • We modified MarkSim for batch-processing.
- 6. Methods: Simulate Crop growing cycle Predict impact on Decision Support System for Agro technology Transfer (DSSAT) production systems (beans) Current yield – Future yield (kg pro hectares) = expected impact on yield (+/-)
- 7. Methods: Target future interventions from predicted impact Identify (impact) Hot-spots Areas where the production systems of crops can be adapted Adaptation-Spots (more than 25% yield loss) Focus on adaptation of production system Areas where crop is no longer an option Hot-Spots (more than 50% yield loss) Focus on livelihood diversification New areas where crop production can be established Pressure-Spots (more than 25% yield gain) Migration of agriculture – Risk of deforestation! 7
- 8. Methods: Socio-economic analysis Quantify socio- economic Socio-economic impact on farmers livelihoods consequences VULNERABILITY to Climate Change (IPCC 2001) Degree of susceptibility and Exposure incapability of a system to Degree to which a system is confront adverse effects of exposed to significant variation climate change in climate Sensitivity Adaptive capacity Degree to which a system is The ability of a system to adapt positively or negatively affected to climate change by climate related stimulus • Focal group workshops on selected Hot- & Adaptation-spot-sites • On Farm data collection by surveying based on livelihood indicators off 5 assets: human, natural, social, physical, financial
- 9. results Results Pic by Neil Palmer (CIAT).
- 10. Results: Predicted Climate Change in Central America RESULTS 19 GCM (IPCC 4th Assessment report CMIP3) – scenario A2 CLIMATE CHANGE 2 30 year mean periods 2010-2039 [2020], 2040-2069 [2050] For 2020: mean annual temp. increase 1 - 1.1 C For 2050: less precipitation ( ~ -10%) mean temp. increase 2.2 - 2.4°C hottest day up to 35.6°C (+ 2.4 - 2.6°C) coolest night up to 18.2°C (+ 1.6 - 2°C)
- 11. Results: Ground proofing and similar Climate patterns RESULTS Calculate Climate-Cluster from 19 bioclimatic variables to GROUND PROOFING understand potential beans production areas Estimate current bean production areas by Kernel density using point data from *Beans-Atlas * Common beans atlas of the Americas Michigan State University Suitability (crop to climate) analysis with EcoCrop
- 12. Results Assessment of beans Pic by Neil Palmer (CIAT).
- 13. Methods: Block diagram of impact assessment of beans Predict impact on production systems (beans)
- 14. Methods: DSSAT Simulation trials Predict impact on Decision Support System for Agro technology Transfer (DSSAT) production systems (beans) Weather data input: Current climate Average of 99 MarkSim daily outputs Future climate Ensemble of 19GCM & 99 MarkSim outputs for 2020 & 2050 Runs: 17,800 points x 3 Planting date: Between 15th of April and 30th of June1 climates x 99 MarkSim- samples x 8 trials Variety 1: IB0006 ICTA-Ostua Variety 2: IB0020 BAT1289 Soil 1: IB00000005 (generic medium silty loam) Soil 2: IB00000008 (generic medium sandy loam) Fertilizer 1: 64 kg / ha 12-30-0 6 to 10 days after germination and 64 kg / ha Urea (46% N) at 22 to 25 days after germination. Fertilizer 2: 128 kg/ha 18-46-0 Fertilizer application on sowing and 64 kg/ha UREA at 22 to 30 days after germination.
- 15. Methods: Field trials to calibrate DSSAT Predict impact on production systems Accompanying field trials in 5 countries to calibrate DSSAT (beans) • For 2 DSSAT-varieties (IB0006 ICTA-Ostua, IB0020 BAT1289 – “INTA Fuerte Sequia”, “INTA Rojo”, and “Tío Canela 75” originating from Nicaragua – “ICTA Ostua” and “ICTA Ligero” originating from Guatemala – “BAT 304” originating from Costa Rica – “SER 16”, SEN 56”, “NCB 226”, and “SXB 412” originating from CIAT, Colombia. • Sowing on: – Primera (Beginning of June) – Postrera (Beginning of September) • After recollecting data during 2011 results will be used in a post-project-analysis to calibrate 2 initial DSSAT varieties run it again for trial sites and find spatial and temporal analogues
- 16. Results: yield change for year 2020 predicted by DSSAT (Primera) RESULTS IMPACT ON BEANS (average 8 trials)
- 17. Results: yield change for year 2020 (Primera) – 8 trials RESULTS COMPARE SIMULATIONS Trial 3 – high performance / high impact Trial 7 – medium high performance / less impact Variety 1: ICTA-Ostua Variety 1: ICTA-Ostua Soil 1: generic medium silty loam Soil 2: generic medium sandy loam Fertilizer 2: 128 kg/ha 18-46-0 Fertilizer application on sowing Fertilizer 2: 128 kg/ha 18-46-0 Fertilizer application on sowing and 64 kg/ha UREA at 22 to 30 days after germination and 64 kg/ha UREA at 22 to 30 days after germination
- 18. Results: Specific country results for year 2020 (Primera) RESULTS BEANS IMPACT Nicaragua Highest impact (negative yield change) would be expected on the dry corridor (Corredor seco) from Rivas, Granada up to Estelí and Madriz. Improved yields are predicted for the Atlantic region and Chontales which are traditionally used for Apante-production (December - April)
- 19. Results: Specific country results for year 2020 (Primera) RESULTS BEANS IMPACT Honduras Dry corridor continues its path up to Honduras and El Paraiso, Francisco Morazan to Yoro. Ocotepeque is the only beans producing department with in average increasing yields.
- 20. Results: Specific country results for year 2020 (Primera) RESULTS BEANS IMPACT El Salvador Highest reduction in yield is expected to occur in the South-Eastern region in the departments Cuscatlan. Impact in general is less compared to the other 3 countries
- 21. Results: Specific country results for year 2020 (Primera) RESULTS BEANS IMPACT Guatemala Some departments have high potential for future bean production regarding to changing climate and perhaps because of their different climate zone. San Marcos (+38%), Totonicapán (+23%) and Quezaltenango (+31%) are high potentials for beans production by 2020 (considering only climate as factor)
- 22. Address uncertainty of DSSAT simulation RESULTS We calculated 4 different outcomes to address UNCERTAINTY uncertainty of DSSAT simulation a Relative yield change as average of 19 GCMs for 2020 b Average of the 1st quartile of GCMs c Average of 3rd quartile of GCMs d Breadth of GCMs agreeing in yield change prediction by DSSAT. Because of processing constraints we run DSSAT on a 15 kilometer buffer around sites selected for socio-economic analysis
- 23. maiz Assessment of maize Pic by Neil Palmer (CIAT).
- 24. Methods/Results: DSSAT Simulation trials Predict impact on production systems • model runs were divided according to the two (maize) general soil types selected. – best and worst (poor soil conditions) case scenarios
- 25. Methods/Results: DSSAT Simulation trials Predict impact on production systems • Maize yield differences between (maize) current climate and 2020s predicted poor soil good soil
- 26. Results: Specific country results for year 2020 RESULTS poor soil scenario MAIZE IMPACT Nicaragua Impact for Nicaragua for the 2020s and the poor soil scenario on the country overall is predicted to be a reduction of 11% implying a production loss of 51,741 t compared to the latest production statistics. good soil scenario Areas like Masaya (-46%) and Chinandega (-43%) would face higher reductions while the larger production areas like Jinotega (-9%), Matagalpa (-9%), Atlantico Sur (-1%) and Norte (-1%) are predicted to show less reductions under the poor soil condition scenario.
- 27. Results: Specific country results for year 2020 RESULTS poor soil scenario MAIZE IMPACT Honduras Overall losses for Honduras compared to the 2009-2010 production (available for 7 regions) would amount to 175,598 t of maize (poor soil conditions) an overall loss of 30%. For the good soil and the good soil scenario 2020s losses overall are still considerable with a total of 69,534 t (12%).
- 28. Results: Specific country results for year 2020 RESULTS poor soil scenario MAIZE IMPACT El Salvador Impact for El Salvador for the 2020s and the poor soil scenario on the country overall is predicted to be a reduction of over 250,000 t of maize based on the 2009-2010 production year. good soil scenario Areas like La Paz (-74%), La Union (-44%), San Miguel (- 43%), Usulután (-40%), San Vicente (-39%), San Salvador (- 35%) and Cabañas (-34%) would face higher reductions while areas like Ahuachapan (-11%) and Chalatenango (-17%)are predicted to show less reductions under the poor soil condition scenario.
- 29. Results: Specific country results for year 2020 RESULTS poor soil scenario MAIZE IMPACT Guatemala Impact for Guatemala is softened by the considerable highland areas mainly in the West of the country while drier areas like parts of Petén, coastal areas in the South (Retalhulehu, Escuintla), and the Eastern border (Chiquimula and Jutiapa) would face considerable losses. Also the largest producer in terms of area, Alta Verapaz, is good soil scenario little affected due to slight increases under the good soil scenario and only slight losses under the poor soil condition scenario. For the 2020s and the poor soil scenario on the country overall is predicted to be a reduction of 98,000 t in comparison with the latest production statistics. For the good soil scenario the overall balance for the country is positive with 4,247 t increase.
- 30. Socio-economic consequences Pic by Neil Palmer (CIAT).
- 31. Results: Hot-spots for maize or beans production areas in Central America Identify (impact) Hot-spots Message 1: We need to pick out where to start working!
- 32. Results: Selected 16 sites for socio-economic study Quantify socio- economic consequences
- 33. Result: Sample-site 1 - Texistepeque (Las Mesas), Santa Ana ,El Salvador Hot-spot Las Mesas Altitude: 667 m (about 2188 feet) Hot-spot -141 kg/ha For 2020: • 35 mm less rain (current 1605mm) • mean temperature increase 1.1 C For 2050: • Beans as most important income (sell 70% of harvest) • 73mm less rain ( -5%) • • Climate variability (intense rain, drought), missing labor • mean temperature increase 2.3 C hottest day up to 35 C (+ 2.6 C) & credits, high input costs, … forces them to changes • coolest night up to 17.7 C (+ 1.8 C) • Increasing livestock displace crops into hillside areas • Half of farmer rent their land • Distance to market is far • Mostly no road access in rainy season • They buy inputs/sell produce from/to farm-stores (they call them: Coyotes) Message 2: Adaptation Strategies must be fine-tuned at each site! 33
- 34. Result: Sample-site 2 – Valle de Jamastran, Danlí, Honduras Adaptation-spot Jamastran Altitude: 783 m (about 2568 feet) Adaptation-spot - 115 kg/ha For 2020: • • Active communities with already advanced agronomic • 41 mm less rain (current 1094 mm) mean temperature increase 1.1 C management of maize-bean crops For 2050: • 80 mm less rain ( -7%) • Favorable soil conditions and management • mean temperature increase 2.4 C • Long-term technical assistance / training • hottest day up to 34.2 C (+ 2.6 C) • coolest night up to 17 C (+ 2.1 C) • Irrigation schemes (e.g. 50 mz of 17 bean producers) • Diversification options (vegetables, livestock) • Market channels through processing industries • Advanced infrastructure (electricity, roads) • Need to optimize water use efficiency • Credit problems Message 3: There can be winners if they adapt quickly!34
- 35. Socio-economic Results: Focal groups results Quantify socio- Focal Groups were carried out in Honduras, El Salvador, and Nicaragua since unexpected economic climatic events (flooding in Oct-Nov 2011) prevented us from implementing focal groups in Guatemala. consequences • Main activities and trends 35 30 25 Mentions ( %) 20 15 10 5 0 El Salvador Honduras Nicaragua Maize Beans Sorghum & maicillo Vegetables Cattle Poultry &eggs Rice Fruits Coffee Pork
- 36. Socio-economic Results: Focal groups results Quantify socio- Focal Groups were carried out in Honduras, El Salvador, and Nicaragua since unexpected economic climatic events (flooding in Oct-Nov 2011) prevented us from implementing focal groups in Guatemala. consequences • Farmers‘ perceptions point to economic as well as climatic events as main drivers of perceived trends 70 60 50 Mentions (%) 40 30 20 10 0 El Salvador Honduras Nicaragua Climate related (1) Economics/finance (2) Lack o fResouces (3) Other (4)
- 37. Socio-economic– results capitals Results: Focal groups Livelihood Quantify socio- Focal Groups were carried out in Honduras, El Salvador, and Nicaragua since unexpected economic climatic events (flooding in Oct-Nov 2011) prevented us from implementing focal groups in Guatemala. consequences (a) 70 60 (b) 80 70 50 60 Mentions (%) Mentions (%) 50 40 40 30 30 20 20 10 10 0 0 El Salvador Honduras Nicaragua El Salvador Honduras Nicaragua Own Rent Loan Potable Irrigation No treated (wells) (c) 80 70 60 (a) Forms of land tenure Mentions (%) 50 (b) Water availability 40 30 (c) Main road types 20 10 0 El Salvador Honduras Nicaragua All year Dry season only
- 38. Socio-economic Results: Focal groups results Quantify socio- (a) 50 45 economic 40 consequences 35 Menciones (%) 30 25 20 15 • Perceptions of 10 5 future threats and 0 El Salvador Honduras Nicaragua opportunities Climate events Natural resourcs Financial and economic resources Social events Catastrophic events 60 (b) 50 40 Menciones (%) (a) future threats 30 (b) future opportunities 20 10 0 El Salvador Honduras Nicaragua Public investment Strengthening of human & social resources Sustainable development projects Change of activities
- 39. Socio-economic results Results: Socio-economic analysis Quantify socio- • Quantity and value of maize and beans economic consequences production losses in 2020 60,000 Maize/beans value of production losses (000 us$) 50,709 50,000 45,623 40,000 30,000 20,000 17,476 10,000 8,622 0 Nicaragua Honduras El Salvador Guatemala Estimated value of maize&beans production losses at 2020 (us$) • Summary of predicted types of changes on country level
- 40. Methods: Socio-economic analysis Quantify socio- economic • Household vulnerability consequences Pic by Neil Palmer (CIAT).
- 41. Socio-economic results - Household EXPOSURE Methods: Socio-economic analysis Quantify socio- I II III economic Impact on land productivity GCC Consequences at hotspot level Adjustment factor at the household level Indicator: Exposure level of the maize/beans cropping system consequences (predicted by the (estimated) (High, Medium, Low) biophysical model) • Exposure level of the maize/beans cropping system The adjustment level at the farming system (Household exposure) 1. Relative change in bean yield predicted by the biophysical model (as shown in previous slides) 2. Conservation technologies / Inclination
- 42. Classes of maize/beans cropping system exposure (%) Classes maize production exposure (%) 10 20 30 40 50 60 70 80 90 40 60 80 0 0 20 100 100 (c) (a) El Rosario El Rosario San Felipe San Felipe El Salvador El Salvador San Rafael San Rafael Ipala Ipala San Manuel Chaparron High High San Manuel Chaparron Guatemala Guatemala Patzicia Patzicia Medium Medium Alauca Alauca Low Low Jamastran Jamastran Honduras Orica Honduras Orica Results: Socio-economic analysis La Hormiga La Hormiga San Dionisio San Dionisio Nicaragua Nicaragua Totogalpa Totogalpa Classes of beans production exposure (%) 20 40 60 80 0 100 120 (b) El Rosario San Felipe El Salvador San Rafael Socio-economic results - Household EXPOSURE Ipala High San Manuel Chaparron Guatemala Patzicia Medium Alauca Low (a) Exposure level of maize (b) Exposure level of beans Jamastran Honduras Orica (c) Exposure level of maize/beans La Hormiga economic San Dionisio consequences Nicaragua Quantify socio- Totogalpa
- 43. Socio-economic results - Household SENSITIVITY Results: Socio-economic analysis Quantify socio- economic consequences • Stages in the estimation of the sensitivity of livelihoods’ sources indicator Importance of the system maize/bean farm income Maize Beans 100 120 Classes of beans importance in farm's income (%) Classes of maize importance in farm's income (%) 90 80 100 70 80 60 50 60 40 30 40 20 20 10 0 0 Totogalpa Orica Patzisia San Manuel Chaparron El Rosario San Felipe San Rafael La Hormiga Ipala San Dionisio Alauca Jamastran San Manuel Chaparron San Felipe Orica San Rafael Patzisia Totogalpa El Rosario Ipala La Hormiga San Dionisio Alauca Jamastran El Salvador Guatemala Honduras Nicaragua El Salvador Guatemala Honduras Nicaragua High Medium Low High Medium Low
- 44. Classes of household sensitivity (%) Classes of maize sensitivity (%) 20 40 60 80 0 20 40 60 80 0 100 (c) (a) El Rosario El Rosario San Felipe San Felipe El Salvador El Salvador San Rafael San Rafael Ipala Ipala San Manuel Chaparron San Manuel Chaparron High High Guatemala Guatemala Patzisia Patzisia Medium Medium Alauca Alauca Low Low Jamastran Jamastran Orica Honduras Orica Honduras Results: Socio-economic analysis La Hormiga La Hormiga San Dionisio San Dionisio Nicaragua Nicaragua Totogalpa Totogalpa Classes of beans sensitivity (%) (b) 20 60 80 0 40 100 El Rosario San Felipe El Salvador San Rafael Socio-economic results - Household SENSITIVITY Ipala High San Manuel Chaparron Guatemala Patzisia Medium Alauca Low Jamastran Orica Honduras (a) Households sensitivity of maize (b) Households sensitivity of beans La Hormiga economic San Dionisio consequences Quantify socio- Nicaragua (c) ) Households sensitivity of maize/beans Totogalpa
- 45. Socio-economic results - Household ADAPTABILITY Methods: Socio-economic analysis Quantify socio- economic • Stages used to estimate the household adaptive capacity consequences
- 46. Classes of natural captal availabilty (%) Classes of physical capital availabilty (%) 60 80 0 20 40 100 20 40 60 80 0 100 120 (c) (a) El Rosario El Rosario San Felipe San Felipe San Rafael San Rafael El Salvador El Salvador Ipala Ipala San Manuel Chaparron San Manuel Chaparron Low Low Patzisia Patzisia Guatemala Guatemala Media Media High High Alauca Alauca Jamastran Jamastran Orica Honduras Orica Honduras Results: Socio-economic analysis La Hormiga La Hormiga San Dionisio San Dionisio Nicaragua Nicaragua Totogalpa Totogalpa Classes of credit access (%) 20 40 60 80 0 100 (b) El Rosario San Felipe San Rafael El Salvador Socio-economic results - Household ADAPTABILITY Ipala (c) Natural capital (a) Physical capital Low San Manuel Chaparron • Stages used to estimate the household adaptive capacity Guatemala Fair Alauca Jamastran Orica Honduras (b) Financial capital (credit access) La Hormiga economic San Dionisio consequences Quantify socio- Nicaragua Totogalpa
- 47. Socio-economic results - Household ADAPTABILITY Results: Socio-economic analysis Quantify socio- • Stages used to estimate the household adaptive capacity economic 100 consequences Classes of human captal availabilty (%) 80 60 40 20 (a) 0 San Manuel Chaparron Ipala Orica Patzisia Totogalpa El Rosario San Rafael La Hormiga San Felipe San Dionisio Alauca Jamastran El Salvador Guatemala Honduras Nicaragua Low Media High 100 Classes of social capital availability (%) 80 60 (b) 40 20 0 (a) Human capital Orica Patzisia El Rosario San Rafael Alauca La Hormiga Totogalpa San Felipe Ipala San Dionisio Jamastran San Manuel Chaparron (b) Social capital El Salvador Guatemala Honduras Nicaragua Low Media High
- 48. Socio-economic results - Household ADAPTABILITY Results: Socio-economic analysis Quantify socio- economic consequences Households adaptive capacity 100 Classes of household's capacity of adaptation 80 60 40 20 (%) 0 Totogalpa Orica Patzisia San Rafael La Hormiga El Rosario San Felipe Ipala San Dionisio Alauca San Manuel Chaparron Jamastran El Salvador Guatemala Honduras Nicaragua Low Media High
- 49. Socio-economic results - Household VULNERABILITY Results: Socio-economic analysis Quantify socio- economic • Households vulnerability consequences 100 80 Classes of vulnerabilility (%) 60 40 20 0 San Manuel Chaparron Totogalpa Patzisia Orica El Rosario San Rafael Ipala La Hormiga San Felipe San Dionisio Alauca Jamastran El Salvador Guatemala Honduras Nicaragua High Medium Low
- 50. Adaptation- & Mitigation strategies
- 51. Result: Local Adaptation- Mitigation strategies We derived five principal strategies for adaptation at farm level • Sustainable intensification: Aimed at increasing physical productivity while preserving natural resources (land and water) in productive systems (eco-efficiency). • Diversification: Increases the amount of consumption sources and income from agriculture • Expansion: Expands the endowment of different types of capitals • Increasing off-farm income: Increase the importance of sources of income from more secure out-of-the-household activities. • Out of agriculture as a livelihood strategy: The household leaves agriculture as a source of income and consumption. 51
- 52. Result: Local Adaptation- Mitigation strategies Sustainable intensification Increase rain water use efficiency! • Improved soil and pest management – Socially integrated soil and pest management with coordinated actions across the community and national actors. • Irrigation and water-catchment – Extent production into drought season with lower temperatures using irrigation and water-catchment systems. • Improve plant nutrition management – water use efficiency can be increased by 15-25% through adequate nutrient management • Genetic improvement for heat stress and drought tolerance – Breeding for common bean improvement in Central America for several stresses associated with climate change. 52
- 53. Result: Local Adaptation- Mitigation strategies Diversification Increase consumption sources and income from agriculture! • Agua-Agro-Silvo-Pastoral Systems – Nutrient cycling is enhanced through the integration of crops and animals resulting in higher crop yields. – Improved soil and water quality and increased biodiversity – Lower greenhouse gas emissions and increased carbon sequestration – Trees and shrubs offer sources of bio-energy – Fruits, nuts, horticulture nursery stock, wood fiber and livestock shelter – Opportunities for restoration of degraded lands – Allow for livestock integration 53
- 54. Result: Local Adaptation- Mitigation strategies Expansion Expansion of land occupation & expansion of the endowment of natural, physical, financial, human and social capitals on farm level! • Natural shift to “Apante” areas – To avoid deforestation, increase effectiveness of bean production by optimal management of abiotic stress and biotic constraints through a multidimensional farming system approach. – Start with farmers’ awareness building to climate change mitigation and build up conservation incentives for farmer groups. • Converting grazing land into cropland – Controlled agricultural land use shift (caused by changing climate patterns) inside existing agricultural frontiers in Central America by using improved forages for livestock and convert liberated grazing land into cropland. • The land tenure complex – Long-term land lease is not common, perspectives investments in sustainable soil and water management will not to be made – Policy interventions are urgently needed • Expansion of human and social capital – Learning framework for farmer groups • Bring Climate Change research to the ground – Generate site-specific adaptation- and mitigation strategies and share them spatially with concrete incentives among farmer communities. 54
- 55. Result: Local Adaptation- Mitigation strategies Increasing off-farm income Central American smallholders traditionally generate off-farm income during e.g. coffee harvest, in processing facilities or mostly for women. These are temporal activities during the dry season associated with migration. Remittances are also an important source of off-farm income and largely spent on consumption. Out of agriculture In general, rural areas provide limited opportunities for income generation which leads to migration to urban areas or outside Central America. 55
- 56. Thank you a.eitzinger@cgiar.org p.laderach@cgiar.org http://dapa.ciat.cgiar.org/ with without Climate Adaptation Strategies
Notes de l'éditeur
- This presentation summarizes the findings and preliminary results of the “Tortillas on the Roaster Project” which started its field operation in March last year. It is a joint effort between CRS, CIAT (Centro Internacional de Agricultura Tropical) and CIMMYT (Centro Internacional de Mejoramiento de Maiz y Trigo) focusing on the impact of climate change on the important maize-bean production systems of four countries in Central America (Nicaragua, Honduras, Salvador and Guatemala). Continue with text on slide 2
- After the first three paragraphs (paraphrasing) …In order to be able to adapt to climate change, smallholders have to know which type of changes and to which extent and ranges these changes will occur and their respective specific impact on their livelihood, from effects on plant growth to market conditions and value chains. Talking about climate change for maize and beans in Central America means also changes/impacts on a complex trade and supply system between countries in the region and also outside the region (e.g. Latin market in the US). We are therefore not only talking about smallholder families but also about the livelihoods of all involved in the value chain and also the consumers since maize and beans are of high cultural value and price increases for these staple crops have a high impact on a growing urban population with social and political implications.Adaptation is only possible if global climate predictions are broken down on local levels, to give farmers a direction on what to adapt to, but also to provide detailed information about the extent of climate change impact and the exact location of the affected population to local, national, regional governments and authorities, and the international cooperation/donors in order to coordinate and focus their interventions in the future.There will be people who will be more affected by climate change than others, some might have to leave the agriculture sector while others will have to change their whole operation. But there will be also new opportunities for those who will adapt quickly making them winners of changes in climate. But everybody has to know….This is the main objective of TOR …. (point on last paragraph on the slide and change to slide 3)Only if we are able to provide specific local information we can help to get people out of the uncertainty of climate change, and they will be able to start managing the risks involved in these changes of climate conditions. Nobody can manage uncertainty, but we can do management of risks.
- To reach our main objectives we follow a methodological pathway which starts with the “downscaling “ of global climate models to local levels followed by the prediction of maize-bean plant growth and production under future climatic conditions. Doing this for all the four countries we can map all changes in bean and maize production and identify location with different degrees of impact. Based on these locations we quantify the socio-economic consequences for the livelihoods of the respective population and value chain (up to the consumer, “put a dollar sign to the impact”). Based on these analyses we can develop adequate adaptation and also some mitigation strategies for the region.Let’s see a few details of these methodologies which includes the latest from science on climate change (as good as it gets) and where we frequently also have to push the limits of available tools (an example is the inclusion of MarkSim in DSSAT).We do not pretend to predict future climate conditions to the exact decimal degree Celsius or mm of precipitation (no fortune telling) but we are very confident that our findings are indicating the necessary and correct directions for climate change adaptation
- For the downscaling of the global climate models we use data from 47,000 weather stations (WorldClim) as baseline with a resolution of 1 km. Please note that the red dots indicate weather stations and that we have still areas such as the Amazon where we have no or only some information available. Also we have to admit that because of the resolution of the map on the slide it seems we have good coverage for a lot of areas, unfortunately this is not the case, even for Central America there is room to improve quantity and quality of available weather data. A similar situation we have on soil data, reason for which CRS started a special activity in GWI locations to monitor these bio-physical parameter for future work in the region. Protocols will be applied in all future CRS agriculture and environmental projects.Up to 24 GCM for different emission scenarios were applied to the weather data, processed and added to the baseline resulting in future climate predictions for all four countries for 2020 (immediate) and 2050 (long-term).
- For the downscaling of the global climate models we use data from 47,000 weather stations (WorldClim) as baseline with a resolution of 1 km. Please note that the red dots indicate weather stations and that we have still areas such as the Amazon where we have no or only some information available. Also we have to admit that because of the resolution of the map on the slide it seems we have good coverage for a lot of areas, unfortunately this is not the case, even for Central America there is room to improve quantity and quality of available weather data. A similar situation we have on soil data, reason for which CRS started a special activity in GWI locations to monitor these bio-physical parameter for future work in the region. Protocols will be applied in all future CRS agriculture and environmental projects.Up to 24 GCM for different emission scenarios were applied to the weather data, processed and added to the baseline resulting in future climate predictions for all four countries for 2020 (immediate) and 2050 (long-term).
- The Decision Support System for Agrotechnology Transfer (DSSAT) is one of the most sophisticated crop simulation models currently available. Its advantages are the possibility to include specific information on weather, soils, plants, management and interactions of these factors.We ran DSSAT with available bean and maize variety calibration sets (2 fertilizer levels, 2 varieties, 2 soils, common smallholder conditions and management) to simulate current average yield and future expected yields. Results for current yields where ground-proofed through expert consultation throughout the region. In addition, field trials with recently introduced bean varieties with higher drought tolerance were conducted in order to obtain calibration data sets for more precise predictions.
- We chose three different types of intervention areas:Adaptation spots: crops suffer a reduction in yield up to 25% but through technical and agronomic management adjustments the crop can still be grown . Furthermore, through early adaptation strategies there might be even a opportunity for certain sites to gain from climate change (an example will be presented later on)Hot-Spots: crops suffer a yield loss of more than 50% indicating that the crop might not be economically feasible anymore for this area and new livelihood strategies are needed.Pressure-Spots: locations with favorable conditions for bean production in the future. These sites are under threat through possible migration and mostly located in forest areas, reserves and close to the agriculture frontier. Pressure-Spots are highly important for national and regional decision makers in order to protect these areas. Pressure spots were not shown to farmers in field workshops to avoid misuse of information.
- Since we know who will be effected to which extent (production)and where, and with the idea to tailor site-specific adaptation strategies, we can now look at each case (location) and analyze the specific vulnerability to climate change and the socio-economic impact.Vulnerability to climate change is the degree of susceptibility and incapability of a system to confront adverse effects of climate change and based on three factors … exposure, sensitivity and adaptive capacity (please read the definition on the slide)We are analyzing these factors at 16 hot and adaptation spots across the four countries through focal group workshops and field surveys on livelihood indicators. These are currently finished (Nicaragua, Honduras and El Salvador last Dec, Guatemala at the moment) and processed.The processed information will give us the last details and indicators needed for the formulation of adaptation strategies.
- As an example we present here the climate prediction of one of the hotspot sites – Alauca, southeast of Tegucigalpa in the El Paraiso department, close to the border to Nicaragua. This site reflects a common pattern of changes we expect for most of the maize and bean areas in Central America.As we can see from the blue bars, precipitation will be low or even lower in the first 4 months of the year which is the typical dry season in the region (more pronounced dry season). For the month of May (planting time) we predict no significant changes in precipitation although there is a tendency towards reduction.For the important month of June (establishment and early development of maize) we see a reduction of rainfall followed by a more severe and extended dry spell, the so called canicula in July and August into September putting the first planting season “la primera” under serious threat.For the second planting season “la postrera” , which is the more important season for beans, there will be less precipitation for the planting month September. Together with the deficit from the prolonged canicula climate conditions might be very unfavorable for the establishment of beans especially in areas with sandy soils.During the month of October and November there is a risk of increased rainfall causing flooding similar to the ones we experienced 2011 with huge damages on agriculture production and infrastructure in Central America. The water deficit is further increased through the increase of the mean and maximum temperature. Higher temperatures cause higher evapotranspiration rates of the plants triggering soil water deficits and heat stresses. High temperature stresses especially high night time temperatures (> 18 °C) and drought conditions have substantial effects on biomass production and reproductive stages of maize and bean plants. Detailed description will be given in a few moments.In syntheses we can say that in the future we will have higher mean temperatures (around +1°C by 2020 and + 2°C by 2050), higher minimum and maximum temperatures and an increasing water deficit due to less precipitation and higher evapotranspiration. We can now feed the current climate data and the future climate prediction into a crop model called DSSAT in order to simulate crop production in the future.
- As an example we present here the climate prediction of one of the hotspot sites – Alauca, southeast of Tegucigalpa in the El Paraiso department, close to the border to Nicaragua. This site reflects a common pattern of changes we expect for most of the maize and bean areas in Central America.As we can see from the blue bars, precipitation will be low or even lower in the first 4 months of the year which is the typical dry season in the region (more pronounced dry season). For the month of May (planting time) we predict no significant changes in precipitation although there is a tendency towards reduction.For the important month of June (establishment and early development of maize) we see a reduction of rainfall followed by a more severe and extended dry spell, the so called canicula in July and August into September putting the first planting season “la primera” under serious threat.For the second planting season “la postrera” , which is the more important season for beans, there will be less precipitation for the planting month September. Together with the deficit from the prolonged canicula climate conditions might be very unfavorable for the establishment of beans especially in areas with sandy soils.During the month of October and November there is a risk of increased rainfall causing flooding similar to the ones we experienced 2011 with huge damages on agriculture production and infrastructure in Central America. The water deficit is further increased through the increase of the mean and maximum temperature. Higher temperatures cause higher evapotranspiration rates of the plants triggering soil water deficits and heat stresses. High temperature stresses especially high night time temperatures (> 18 °C) and drought conditions have substantial effects on biomass production and reproductive stages of maize and bean plants. Detailed description will be given in a few moments.In syntheses we can say that in the future we will have higher mean temperatures (around +1°C by 2020 and + 2°C by 2050), higher minimum and maximum temperatures and an increasing water deficit due to less precipitation and higher evapotranspiration. We can now feed the current climate data and the future climate prediction into a crop model called DSSAT in order to simulate crop production in the future.
- For the downscaling of the global climate models we use data from 47,000 weather stations (WorldClim) as baseline with a resolution of 1 km. Please note that the red dots indicate weather stations and that we have still areas such as the Amazon where we have no or only some information available. Also we have to admit that because of the resolution of the map on the slide it seems we have good coverage for a lot of areas, unfortunately this is not the case, even for Central America there is room to improve quantity and quality of available weather data. A similar situation we have on soil data, reason for which CRS started a special activity in GWI locations to monitor these bio-physical parameter for future work in the region. Protocols will be applied in all future CRS agriculture and environmental projects.Up to 24 GCM for different emission scenarios were applied to the weather data, processed and added to the baseline resulting in future climate predictions for all four countries for 2020 (immediate) and 2050 (long-term).
- The Decision Support System for Agrotechnology Transfer (DSSAT) is one of the most sophisticated crop simulation models currently available. Its advantages are the possibility to include specific information on weather, soils, plants, management and interactions of these factors.We ran DSSAT with available bean and maize variety calibration sets (2 fertilizer levels, 2 varieties, 2 soils, common smallholder conditions and management) to simulate current average yield and future expected yields. Results for current yields where ground-proofed through expert consultation throughout the region. In addition, field trials with recently introduced bean varieties with higher drought tolerance were conducted in order to obtain calibration data sets for more precise predictions.
- The Decision Support System for Agrotechnology Transfer (DSSAT) is one of the most sophisticated crop simulation models currently available. Its advantages are the possibility to include specific information on weather, soils, plants, management and interactions of these factors.We ran DSSAT with available bean and maize variety calibration sets (2 fertilizer levels, 2 varieties, 2 soils, common smallholder conditions and management) to simulate current average yield and future expected yields. Results for current yields where ground-proofed through expert consultation throughout the region. In addition, field trials with recently introduced bean varieties with higher drought tolerance were conducted in order to obtain calibration data sets for more precise predictions.
- We ran the model for all the four countries and mapped the results (in this case the differences between current and future (2020) bean production) for Central America.As we can see there are areas where yields will decrease dramatically whereas others are improving their production potential. The already described changes in climate conditions and their interactions with other location specific conditions determine crop production. Heat and drought stress and high night temperatures are the main culprits for these results. This is broadly sustained by scientific evidence. Some general findings are:Beans : Temperatures > 28/18 C (day/night) decrease biomass production, seed-set, seed number and size (less pods per plant, lessseed per pod, lower seed weight) Elevated CO2 also decreased seed-set Elevated CO2 increased biomass, but benefits of elevated CO2 decreased with increasing temperaturesMaize: High temperature stress decreases pollination and seed set in maize, mainly caused by decreased pollen viability and stigma receptivity High temperature stress decreases seed-set and kernel numbers perplant. High temperature stress also affects negatively kernel quality and density (protein, enzymes) Reproductive stages (pollen development, flowering, early grain filling)are relatively more sensitive to drought stress, drought decreases kernel number and dry weights. Maize needs 50% of the water in the period 10 days before to 20 days after initial flowering. Even with enough water temperature stress affects pollen development. Drought stress decreases kernels numbers and kernel size Higher night temperatures means higher losses from respiration thus biomass and yield lossesFrom the DSSAT results we can now identify the different type of intervention areas in the region (next slide)
- We ran the model for all the four countries and mapped the results (in this case the differences between current and future (2020) bean production) for Central America.As we can see there are areas where yields will decrease dramatically whereas others are improving their production potential. The already described changes in climate conditions and their interactions with other location specific conditions determine crop production. Heat and drought stress and high night temperatures are the main culprits for these results. This is broadly sustained by scientific evidence. Some general findings are:Beans : Temperatures > 28/18 C (day/night) decrease biomass production, seed-set, seed number and size (less pods per plant, lessseed per pod, lower seed weight) Elevated CO2 also decreased seed-set Elevated CO2 increased biomass, but benefits of elevated CO2 decreased with increasing temperaturesMaize: High temperature stress decreases pollination and seed set in maize, mainly caused by decreased pollen viability and stigma receptivity High temperature stress decreases seed-set and kernel numbers perplant. High temperature stress also affects negatively kernel quality and density (protein, enzymes) Reproductive stages (pollen development, flowering, early grain filling)are relatively more sensitive to drought stress, drought decreases kernel number and dry weights. Maize needs 50% of the water in the period 10 days before to 20 days after initial flowering. Even with enough water temperature stress affects pollen development. Drought stress decreases kernels numbers and kernel size Higher night temperatures means higher losses from respiration thus biomass and yield lossesFrom the DSSAT results we can now identify the different type of intervention areas in the region (next slide)
- Maize yield difference between current climate DSSAT model run and average of 2020s predicted climate model outputs for all project countries.Dark green areas in some regions like Highlands of Guatemala indicate sites were yields will increase as higher temperatures improve growing conditions. Pale green areas like in coastal Nicaragua may indicate conditions for maize production improving due to less humidity, as many of those areas are currently to wet for good yields due pest and disease pressure. Yellow areas indicate slight losses whilst orange and red areas indicate places where maize production will be seriously affected like Northern Honduras as well as South West Nicaragua and some areas along Lake Nicaragua.Overall maize yield loss will be limited due to the higher adaptation capacity of maize to higher temperature (C4 plant). However in some smaller areas interventions are necessary.In general it is assumed that through the use of improved varieties and crop management most of the predicted yield loss in maize can be made up for.Because of the relative small impact on maize we will concentrate in this presentation on the impacts on beans.
- Maize yield difference between current climate DSSAT model run and average of 2020s predicted climate model outputs for all project countries.Dark green areas in some regions like Highlands of Guatemala indicate sites were yields will increase as higher temperatures improve growing conditions. Pale green areas like in coastal Nicaragua may indicate conditions for maize production improving due to less humidity, as many of those areas are currently to wet for good yields due pest and disease pressure. Yellow areas indicate slight losses whilst orange and red areas indicate places where maize production will be seriously affected like Northern Honduras as well as South West Nicaragua and some areas along Lake Nicaragua.Overall maize yield loss will be limited due to the higher adaptation capacity of maize to higher temperature (C4 plant). However in some smaller areas interventions are necessary.In general it is assumed that through the use of improved varieties and crop management most of the predicted yield loss in maize can be made up for.Because of the relative small impact on maize we will concentrate in this presentation on the impacts on beans.
- Maize yield difference between current climate DSSAT model run and average of 2020s predicted climate model outputs for all project countries.Dark green areas in some regions like Highlands of Guatemala indicate sites were yields will increase as higher temperatures improve growing conditions. Pale green areas like in coastal Nicaragua may indicate conditions for maize production improving due to less humidity, as many of those areas are currently to wet for good yields due pest and disease pressure. Yellow areas indicate slight losses whilst orange and red areas indicate places where maize production will be seriously affected like Northern Honduras as well as South West Nicaragua and some areas along Lake Nicaragua.Overall maize yield loss will be limited due to the higher adaptation capacity of maize to higher temperature (C4 plant). However in some smaller areas interventions are necessary.In general it is assumed that through the use of improved varieties and crop management most of the predicted yield loss in maize can be made up for.Because of the relative small impact on maize we will concentrate in this presentation on the impacts on beans.
- Maize yield difference between current climate DSSAT model run and average of 2020s predicted climate model outputs for all project countries.Dark green areas in some regions like Highlands of Guatemala indicate sites were yields will increase as higher temperatures improve growing conditions. Pale green areas like in coastal Nicaragua may indicate conditions for maize production improving due to less humidity, as many of those areas are currently to wet for good yields due pest and disease pressure. Yellow areas indicate slight losses whilst orange and red areas indicate places where maize production will be seriously affected like Northern Honduras as well as South West Nicaragua and some areas along Lake Nicaragua.Overall maize yield loss will be limited due to the higher adaptation capacity of maize to higher temperature (C4 plant). However in some smaller areas interventions are necessary.In general it is assumed that through the use of improved varieties and crop management most of the predicted yield loss in maize can be made up for.Because of the relative small impact on maize we will concentrate in this presentation on the impacts on beans.
- The different areas can be mapped and provide people a way to get out of uncertainty and start managing their specific risks at their locations.What we can see on this map is that the red hot-spots are, not surprisingly, lined-up through the dry channel of Central America and include all mayor and important bean production areas of the region, specifically the north of Nicaragua and the center of Honduras. These areas are the main bean producers in the region, not only supplying the national respective national markets but also exporting to other countries. El Salvador is know to buy huge quantities of bean from these areas for its own consumption, but also for the Latin-market in the US. A dramatic decrease in bean supply will have negative effects on all countries in and outside the region, not to mention consumer prices in urban areas and its socio-political impacts.This is further complicated from the huge number and areas of adaptation spots where without adequate and timely intervention bean production will further decline causing even more havoc on the regional bean markets.The green pressure spots were already discussed and deserve mayor attention through the respective authorities. Past and current experiences in the region however raises fears that these areas might be lost in the next decade due to climate change and other factors such as population increase and land tenure problems.This map constitutes the most important product of the TOR project so far. The condensed information in this map is very useful for a number of different stakeholders and decision makers, development agencies and the donor community.What are the next steps?
- As an example for a selected hot-spot location we presentTexistepeque / El Salvador where we find … (read the slide information)While we find several of these characteristics (e.g. coyotes as marketing channels) at other sites, each location shows also unique issues and combinations of factors and resources which make a specific fine-tuned adaptation strategies necessary. We pretend to build on several basic adaptation ideas which must be adapted to local conditions.
- Our second example shows that climate change might open up opportunities for people with advanced adaptation strategies and who will quickly apply these strategies.Although Jamastran will also be challenged from changes in climate conditions their degree of organization, available infrastructure and training may allow them to take advantage of the 1,000 mm of annual rainfall at this site. The already installed irrigation schemes and market intelligence open up opportunities (time windows) to produce bean and other products for markets when e.g. beans are not available (March-May). Also seed production in the dry season could be very lucrative. However, the intelligent use of water resources will be decisive.
- From the field workshops and findings of the TOR project we can suggest the following adaptation measures which for the most part are already on-going activities in different projects in the region. Applying these techniques and concepts will be the cornerstones of successful adaptation to climate change. A more detailed explanation is provided on the handout.The TOR project will present the final results in March during a one day workshop in Honduras. We see it as a very productive example of the collaboration with scientific research institutions to generate highly valuable information for our strategy development and the future work as a development agency.
- From the field workshops and findings of the TOR project we can suggest the following adaptation measures which for the most part are already on-going activities in different projects in the region. Applying these techniques and concepts will be the cornerstones of successful adaptation to climate change. A more detailed explanation is provided on the handout.The TOR project will present the final results in March during a one day workshop in Honduras. We see it as a very productive example of the collaboration with scientific research institutions to generate highly valuable information for our strategy development and the future work as a development agency.
- From the field workshops and findings of the TOR project we can suggest the following adaptation measures which for the most part are already on-going activities in different projects in the region. Applying these techniques and concepts will be the cornerstones of successful adaptation to climate change. A more detailed explanation is provided on the handout.The TOR project will present the final results in March during a one day workshop in Honduras. We see it as a very productive example of the collaboration with scientific research institutions to generate highly valuable information for our strategy development and the future work as a development agency.
- From the field workshops and findings of the TOR project we can suggest the following adaptation measures which for the most part are already on-going activities in different projects in the region. Applying these techniques and concepts will be the cornerstones of successful adaptation to climate change. A more detailed explanation is provided on the handout.The TOR project will present the final results in March during a one day workshop in Honduras. We see it as a very productive example of the collaboration with scientific research institutions to generate highly valuable information for our strategy development and the future work as a development agency.
- From the field workshops and findings of the TOR project we can suggest the following adaptation measures which for the most part are already on-going activities in different projects in the region. Applying these techniques and concepts will be the cornerstones of successful adaptation to climate change. A more detailed explanation is provided on the handout.The TOR project will present the final results in March during a one day workshop in Honduras. We see it as a very productive example of the collaboration with scientific research institutions to generate highly valuable information for our strategy development and the future work as a development agency.