Call Girls in Mira Road Mumbai ( Neha 09892124323 ) College Escorts Service i...
FTA Report 2009
1. High Capacity Transit Corridor Project
Honolulu, Hawaii
(November 2009)
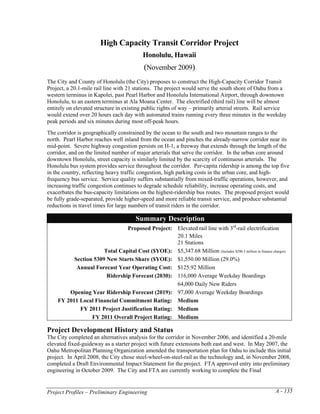
The City and County of Honolulu (the City) proposes to construct the High-Capacity Corridor Transit
Project, a 20.1-mile rail line with 21 stations. The project would serve the south shore of Oahu from a
western terminus in Kapolei, past Pearl Harbor and Honolulu International Airport, through downtown
Honolulu, to an eastern terminus at Ala Moana Center. The electrified (third rail) line will be almost
entirely on elevated structure in existing public rights of way – primarily arterial streets. Rail service
would extend over 20 hours each day with automated trains running every three minutes in the weekday
peak periods and six minutes during most off-peak hours.
The corridor is geographically constrained by the ocean to the south and two mountain ranges to the
north. Pearl Harbor reaches well inland from the ocean and pinches the already-narrow corridor near its
mid-point. Severe highway congestion persists on H-1, a freeway that extends through the length of the
corridor, and on the limited number of major arterials that serve the corridor. In the urban core around
downtown Honolulu, street capacity is similarly limited by the scarcity of continuous arterials. The
Honolulu bus system provides service throughout the corridor. Per-capita ridership is among the top five
in the country, reflecting heavy traffic congestion, high parking costs in the urban core, and high-
frequency bus service. Service quality suffers substantially from mixed-traffic operations, however, and
increasing traffic congestion continues to degrade schedule reliability, increase operating costs, and
exacerbates the bus-capacity limitations on the highest-ridership bus routes. The proposed project would
be fully grade-separated, provide higher-speed and more reliable transit service, and produce substantial
reductions in travel times for large numbers of transit riders in the corridor.
Summary Description
Proposed Project: Elevated rail line with 3rd-rail electrification
20.1 Miles
21 Stations
Total Capital Cost ($YOE): $5,347.68 Million (Includes $290.3 million in finance charges)
Section 5309 New Starts Share ($YOE): $1,550.00 Million (29.0%)
Annual Forecast Year Operating Cost: $125.92 Million
Ridership Forecast (2030): 116,000 Average Weekday Boardings
64,000 Daily New Riders
Opening Year Ridership Forecast (2019): 97,000 Average Weekday Boardings
FY 2011 Local Financial Commitment Rating: Medium
FY 2011 Project Justification Rating: Medium
FY 2011 Overall Project Rating: Medium
Project Development History and Status
The City completed an alternatives analysis for the corridor in November 2006, and identified a 20-mile
elevated fixed-guideway as a starter project with future extensions both east and west. In May 2007, the
Oahu Metropolitan Planning Organization amended the transportation plan for Oahu to include this initial
project. In April 2008, the City chose steel-wheel-on-steel-rail as the technology and, in November 2008,
completed a Draft Environmental Impact Statement for the project. FTA approved entry into preliminary
engineering in October 2009. The City and FTA are currently working to complete the Final
Project Profiles – Preliminary Engineering A - 135
2. High Capacity Transit Corridor Project Honolulu, Hawaii
Environmental Impact Statement. The City’s schedule anticipates a request for entry into Final Design in
mid-2010, and a Full Funding Grant Agreement (FFGA) for the project in 2011.
Project Justification Rating: Medium
The project justification rating is based on the weighted average of the ratings assigned to each of the
following criteria: the cost-effectiveness criterion is weighted 20 percent; the transit supportive land use
criterion is weighted 20 percent; the economic development criterion is weighted 20 percent; the mobility
improvements criterion is weighted 20 percent; the environmental benefits criterion is weighted 10
percent; and the operating efficiencies criterion is weighted 10 percent.
Cost Effectiveness Rating: Medium
The cost effectiveness rating reflects the project’s travel-time savings (63,700 hours each weekday)
relative to the project’s annualized capital and operating costs compared to a baseline alternative.
Cost Effectiveness
New Start vs. Baseline
Cost per Hour of Transportation System User Benefits $16.24*
Cost per Incremental Transit Trip $16.17
*Indicates that measure is a component of Cost Effectiveness rating
Transit-Supportive Land Use Rating: Medium
The land use rating reflects the population and employment densities within ½-mile of proposed station
areas:
Average population density across all station areas is 8,300 persons per square mile. Total
employment served is at least 164,000 (including 48,000 in the central business district (CBD).)
Ranging from west to east, existing land uses in the station areas typically include open,
agricultural land; low-density, single-family residential; moderate-density, multi-family
residential; light-commercial and harbor front industrial; high-density commercial and retail, and
moderate-density, mixed-use retail and residential.
Pedestrian facilities in the corridor’s station areas are non-existent in the undeveloped western
end of the corridor, but generally improve towards the east. Many station areas suffer from wide
arterial streets, considerable surface parking, disconnected residential subdivisions, and
segregated development patterns. The corridor’s eastern areas have adequate pedestrian
infrastructure and better pedestrian amenities and design.
Parking is scarce and expensive in the CBD, but generally free and available in most other areas.
Economic Development Rating: Medium-High
The economic development rating is based upon the average of the ratings assigned to the subfactors
below.
Transit-Supportive Plans and Policies: Medium
Land use in the corridor is controlled by only two entities – the State of Hawaii and the City and
County of Honolulu. Honolulu has specifically sought to concentrate new development in the
Honolulu primary urban center and to establish a secondary urban area to the east in the
community of Kapolei, at the eastern end of the proposed alignment. City and state-developed
regional and subarea plans that cover the corridor include urban growth boundaries with strong
A - 136 Project Profiles – Preliminary Engineering
3. High Capacity Transit Corridor Project Honolulu, Hawaii
protections for agricultural and preserved land outside these boundaries. The majority of the
developable urban area was built up in the 1940s to 1960s and has been redeveloped since.
All current area and sub-area community land use plans contain objectives that explicitly support
the project and that generally encourage transit-oriented projects, pedestrian orientation, and
dense, mixed-use patterns of development. Neighborhood transit-oriented development (TOD)
plans are being developed for each of the station areas, and will serve as the basis for rezoning
and other improvements.
In 2006, the City Council of Honolulu amended its Revised Ordinances to define a Transit-
Oriented Development Ordinance. The ordinance is intended to guide development in and around
transit stations and is currently under development by the city.
Existing zoning statutes allow for relatively high commercial and residential densities and
relatively low parking requirements compared to most suburban areas in the U.S., and in some
cases allow for mixed-use development. Some planned-unit developments and special districts
have provisions for pedestrian amenities, but for the most part pedestrian-oriented design
requirements and guidelines are not included in existing zoning regulations.
Of the several comprehensive plans covering corridor communities, only the initial TOD
Ordinance definition in the Revised Ordinances proposes incentives to explicitly promote transit-
oriented development, including the use of floor area ratio bonuses, shared parking requirements,
and reductions in external trips. Honolulu is currently engaged in a TOD planning process for the
proposed station areas to develop more detailed plans and amendments to zoning ordinances to
implement land use policies and encourage appropriate development.
Performance and Impacts of Policies: Medium-High
Opportunities for redevelopment are greatest near the termini of the alignment in the Ewa Plain to
the west and the Kaka‘ako Community Development District (CDD) to the east. The Ewa Plain
has master plans for major development projects including high densities, a mix of uses, and
pedestrian-friendly design in the vicinity of three proposed stations.
The Kaka’ako CDD has seen an abundance of pedestrian/transit friendly development projects
recently including expansion of open air, pedestrian retail strips, major commercial and shopping
centers located at existing bus transit stations (and the site of a proposed station), and high-
density, live-work developments within walking distance of downtown. In addition, the area has
undergone upgrades to its street network and infrastructure to add or replace sidewalks and
improve the flow of pedestrian and vehicular traffic.
The greatest impact of the transit project, outside of the Ewa Development Area, will be the
redevelopment of existing land uses. Policies and market forces are at work within the Kaka‘ako
CDD to encourage infill and TOD redevelopment. However, areas near stations in the Waipahu,
Pearl City, and Salt Lake communities may be the least adaptable to redevelopment due to the
concentration of industrial/light-commercial uses, U.S. military and state property, and lower
demand than other areas.
Project Profiles – Preliminary Engineering A - 137
4. High Capacity Transit Corridor Project Honolulu, Hawaii
Mobility Improvements Rating: Medium-High
New Start vs. Baseline
Transportation System User Benefit Per Passenger Mile 3.9
Daily Trips by Transit Dependents Using the Project 18,600
Transit Dependent User Benefits per Passenger Mile 1.5
Environmental Benefits Rating: Medium
Criteria Pollutant Status EPA Designation
8-Hour Ozone (O3) Attainment Area
Carbon Monoxide (CO) Attainment Area
Operating Efficiencies Rating: Medium
Baseline New Start
System Operating Cost per
Passenger Mile (current year dollars) $0.41 $0.34
Local Financial Commitment Rating: Medium
The local financial commitment rating is based on the weighted average of the ratings assigned to each of
the following criteria: the New Starts share of project costs is weighted 20 percent; the strength of the
capital finance plan is weighted 50 percent; and the strength of the operating finance plan is weighted 30
percent.
Section 5309 New Starts Share of Total Project Costs: 29.0%
Rating: High
Locally Proposed Financial Plan
Source of Funds Total Funds ($million) Percent of Total
Federal:
Section 5309 New Starts $1,550.00 29.0%
Section 5307 Urbanized Area
Formula Funds $300.72 5.6%
American Recovery and
Reinvestment Act (ARRA) $4.00 0.1%
State/Local:
General Excise Tax (GET) $3,492.96 65.4%
Total: $5,347.68 100.0%
NOTE: The financial plan reflected in this table has been developed by the project sponsor and does not reflect a commitment
by DOT or FTA. The sum of the figures may differ from the total as listed due to rounding.
A - 138 Project Profiles – Preliminary Engineering
5. High Capacity Transit Corridor Project Honolulu, Hawaii
Capital Finance Plan Rating: Medium
The capital finance plan rating is based upon the weighted average of the ratings assigned to each of the
subfactors below. The agency capital condition is weighted 25 percent, the commitment of capital funds
is weighted 25 percent, and the capital cost estimate, planning assumptions and capital funding capacity
subfactor is weighted 50 percent.
Agency Capital Condition: Medium
The average age of the City’s bus fleet is 9.2 years, which is older than the industry average.
The City’s good general obligation bond ratings, which were issued in 2009, are as follows:
Moody’s Investors Service Aa2, Standard & Poor’s Corporation AA, and Fitch AA.
Commitment of Capital Funds: High
Approximately 91 percent of non-New Starts funding is committed. Federal sources include
Section 5307 Formula funds and funds from the American Recovery and Reinvestment Act.
Local funds derive from the general excise tax (GET).
Capital Cost Estimates, Planning Assumptions, and Financial Capacity: Low
Assumptions regarding growth in GET revenues and Section 5309 bus discretionary funds are
optimistic compared to historical experience. Financing costs appear to be understated.
The capital cost estimate is considered reasonable.
The financial plan show the City has little ability to address funding shortfalls or cost increases.
The GET surcharge revenues that will be applied to project-related debt service provide very slim
coverage.
Operating Finance Plan Rating: Medium
The operating finance plan rating is based upon the weighted average of the ratings assigned to each of
the subfactors listed below. The agency operating condition is weighted 25 percent, the commitment of
operating funds is weighted 25 percent, and the operating cost estimates, planning assumptions and
operating funding capacity subfactor is weighted 50 percent.
Agency Operating Condition: Medium
Financial reporting for the operation of transit services by the City of Honolulu is reported in the
City’s Public Transportation System Fund. The current ratio of assets to liabilities for that fund
as reported in its most recent audited financial statements is 1.32.
The City has no recent service cutbacks.
Commitment of Operating Funds: High
All operating funds are considered committed, including Federal formula funds, fare revenues
and other operating income, and subsidies from the City’s General Fund and Highway Fund.
Operating Cost Estimates, Planning Assumptions, and Financial Capacity: Medium-Low
Assumptions regarding state operating subsidies and growth in rail unit operating costs and bus
and paratransit operating costs are optimistic compared to historical experience.
The operating cash flow assumes a balanced budget, with no accrual of an operating surplus or
reserve.
Project Profiles – Preliminary Engineering A - 139
6. High Capacity Transit Corridor Project
Honolulu, Hawaii
II--H
II---H2
IHH2
-H 2
H
H
H
H2
2
Pearl City
Pearl City
Pearl City
Pearl City
Pearl City
Pearl City
Pearl
Pearl
Pearl
Pearl
Pearl
Pearl
Highlands
Highlands
Highlands
Highlands
Highlands
Highlands
yy
yy
wy
I I-H1
I-H 1
I-H1
I-H 1
I-H1
H
I-H3
I-H3
I-H3
I-H3
I-H3
I-H3
Hw
Hw
Hw
Hw
toon
nnH
tonn Leeward
Leeward
Leeward
Leeward
Leeward
Leeward Kaa
Ka
K
Kaam
Kam
K m
ggtoo
gt t meeh
meeh
meh
ea
irning
rririnng
in am
haam
ham
Waipahu
Waipahu Fe
FFe
r
eer
FFerrr Community
Community
Community
Community
Community
Community ehha
eh
eehaaH
eha H
a Hw
Hw
Hwy
Hwyy
w
I
yy
Colllege
Colllege
Colllege
H1
II-H
H1
H1
H1
II---H1
1 Waipahu Transit
Waipahu Transit
Waipahu Transit
Waipahu Transit
Waipahu Transit
Waipahu Transit
Colllege
Colllege
Colllege
Pearlridge
Pearlridge
Pearlridge
Pearlridge
Pearlridge
Pearlridge I
I West Loch
West Loch
West Loch
West Loch
West Loch
West Loch
Center
Center
Center
Center
Middle
Middle
Middle
Middle
Middle
Middle
East Loch
East Loch
East Loch
East Loch
East Loch
East Loch
yy
yy
wy
Hw
Hw
Hw
Loch
Loch
Loch
Loch
Loch
Loch Aloha
Aloha
Aloha
Aloha
Aloha
nnHHw
toon
tonn
ggtoo
gt t
ing Stadium
I Hoòpili
r rririnng
irnin Stadium
Stadium
Stadium
eerr
FFerrr
Fe
FFe
Hoòpili
Hoòpili
Hoòpili
Hoòpili
Hoòpili
II--H
II---H22
Ford
Ford
IH
IH
I 2
P
Pà
PPà
Pààlee
l lehh
l
àlleeh
22011
220
20
20 1
ehhu
uua
huua
a R
uaaR
1
aRR
Rdd
Rd
d
d
West
West
West
West
West
West Island
Island
Loch
Loch
Loch
Loch
Loch
Loch Salt Lake
Salt Lake
UH West
UH West
West
UH West
UH West
West Pearl Harbor
Pearl Harbor
Pearl Harbor
Pearl Harbor
Pearl Harbor
Pearl Harbor
ailway
ailway
lway
I
thh Rdd
dd
Oàhu
Oàhu
Oàhu u Railway
ailway
lway
Rd
Oàhu
Oàhu
Oàhu Oàhu Rai
Oàhu Rai
th R
Oàhu R
Oàhu
Oàhu
uuthhR
hR
Naval Base
Naval Base
Naval Base
Naval Base
Naval Base
Naval Base
Soout t
Souu
Èwa
Èwa
th---So
- o
S
rhh-S
rtthh-S
Pearl Harbor
Pearl Harbor
Noort t
Norr
Noo
N
N
Naval Base
Naval Base
East Kapolei
East Kapolei
East Kapolei
East Kapolei
East Kapolei
East Kapolei I-H1
I-H1
I-H1
I-H1
I-H1 Middle Street
Middle Street
Street
Middle Street
Middle Street
Street
Transit Center
Transit Center
Transit Center
Transit Center
Transit Center
Transit Center
Kapolei
Kapolei
I I
Honolulu
Honolulu
Honolulu
Honolulu
Honolulu
Honolulu I I
Dii
D
DDilill
Di i
iiin
lllilinn
nggh
ngg
gh
ghha
IIII-II-H
International
--H
International
International haam
--H
International Lagoon
Lagoon
Lagoon
-H
m
am
H1
Lagoon
Lagoon
Lagoon m
m BB
11
11
Kalihi
Kalihi
Kalihi
11
Bl
BBlvv
Blllv
Airport
Airport
Airport
Airport
Airport
Airport Drive
Drive
Drive lvdd
vvd
d
dd
Drive
Drive
Drive
Honolulu International Airport
Honolulu International Airport Kapãlama
Kapãlama
Kapãlama
Kapãlama
Kapãlama
Kapãlama I
I Iwilei
Iwilei
Iwilei
Iwilei
Iwilei
Legend Honolulu
Honolulu I Chinatown
Chinatown
Chinatown
Chinatown
Chinatown
I Proposed Station
Harbor
Harbor I Downtown
Downtown
Downtown
Downtown
Downtown
Proposed Station - Park-and-Ride I Civic Center
Civic Center
Civic Center
Civic Center
Civic Center
Civic Center
Maintenance and Storage Facility I Kakaàko Ala
Kakaàko
Kakaàko
Kakaàko
Kakaàko
Kakaàko
Ala
Ala
Ala
Ala
Ala
Proposed System Ala Moana I Moana
Ala Moana Moana
Moana
Moana
Moana
Center
Center
Center
Center
Center
Interstate Highway Beaches
Beaches
PACIFIC OCEAN
PACIFIC OCEAN
Street
Railway
Water Areas
0 0.9 1.8
miles