
Recommandé
Contenu connexe
Tendances
Tendances (16)
Similaire à Creative economy final report (web)
Similaire à Creative economy final report (web) (20)
Plus de cjyeoman
Dernier
Dernier (20)
Creative economy final report (web)
- 1. JULY 2012 THECREATIVE ECONOMY OF HOUSTON A comprehensive study of creative-sector industries and their i m pa c t on the Houston economy
- 2. 2
- 3. JULY 2012 THECREATIVE ECONOMY OF HOUSTON A comprehensive study of creative-sector industries and their i m pa c t on the Houston economy Commissioned by Houston Arts Alliance and University of Houston in partnership with Greater Houston Partnership Data and Analysis by EMSI
- 4. WELCOME LETTER Thank you to all of the many thoughtful participants in bringing this study to a reality. Nearly three years ago, Houston Arts Alliance and University of Houston convened a group of creative, academic and policy leaders to discuss the broad creative sector in Houston. A few preliminary take-aways have informed the work since then. Among them is the sense that the delineation between the for-profit creative sectors and the non-profit arts is now highly porous. Artists and other creatives move fluidly between work in major arts institutions, community-based organizations, film, design and other creative endeavors. The “arts” today are about creative expression and creative experience, and don’t fall neatly within for-profit and non-profit parameters. We need to shift the perception from the arts as a quality of life attraction for a well-qualified workforce, to the creative sectors as a tremendously powerful component of the economy unto itself. I believe this study reflects these early ideas. This is a conservative study. By design, we asked our colleagues at EMSI to mirror the study as much as possible to successful studies in other major US cities, but to tailor it to Houston. The result are findings that are defendable, easy to grasp, and are presented within the context of Houston’s job sectors. We have to extend thanks to the many thoughtful participants in those early conversations, including Patricia Martin, who led us through the initial phase of the study. Thanks also to Don Henderson and the Culture & Tourism Committee of the Greater Houston Partnership—a group of lively community leaders committed to advancing the arts and culture within the business community; and to Karen Farber at University of Houston, our partner from the get-go, with an eye on the academic implications of the study. Finally, thanks to the board at Houston Arts Alliance (HAA), who endorsed the need for this study three plus years ago, and my collegues at HAA who helped realize those early ideas into this final document. This study is, ideally, only a starting point. Houston’s creative sector is poised to grow quickly in the coming years, and with incremental investment and policy leadership, the opportunities are extraordinary. As the story unfolds, please continue to see more profiles like those throughout this study and information about the creative economy on our website at www.houstonartsalliance.com and www.facebook.com/houstonartsalliance. Thank you, Creatives, for advancing our lives, community and economic well-being. Jonathon Glus, CEO, Houston Arts Alliance
- 5. wELCOME LETTER 2 Introduction 5 Executive Summary 7 Houston’s Current Creative Economy 9 What is a Creative Economy? 11 Why the Creative Economy Matters 13 Is Houston a Creative City? 15 Creative Economy at-a-Glance 17 How Houston’s Creative Economy Compares 19 A Tale of Six Cities: Creative Job Growth 21 Creative Job Numbers 23 The Ace in the Hole : Good Pay 25 Creative Earnings 27 The Future OF HOUSTON’S CREATIVE ECONOMY 29 CreativeLY SPeaking, there’s Room to Grow 31 creative leaps in the metro area 33 The Creative Jobs Listing 35 top creative occupations 37 LEADING CREATIVE INDUSTRIES 39 Takeaways and Considerations 41 About the Study 42 glossary of terms 44 projected occupational growth 45 creative industry multipliers 46 ACKNOWLEDGEMENTS 49
- 6. 4
- 7. introduction On the world economic stage, Houston is a big player. It is the fourth largest city in the United States, with a population of more than two million, and a 10-county regional population of approximately 6.1 million people, the country’s fifth largest metropolitan region. With the most recent national census, Houston is the country’s second fastest growing major metro area and is now the most culturally diverse city in the country. Among its assets are a global population, a talented and productive workforce, a comparatively reasonable cost of living and a good quality of life. Urban expert Joel Kotkin touted Houston’s “successful 21st-century urbanism,” noting abundant opportunity due to lower taxes and inexpensive real estate relative to other major cities and a continued rise in white-collar, college-educated residents. In 2008, Houston was rated number one on Kiplinger’s Personal Finance Best Cities report, and The Wall Street Journal and The New York Times are only two of many national dailies recently reporting on Houston’s robust economy and growing profile as a leading 21st century city. As the global energy capital and the American center of space technology, Houston is known as powerful, resourceful and productive. But is it known for its creative economy as well? The following report, commissioned by Houston Arts Alliance and University of Houston, examines that question, analyzing Houston’s creative economy and comparing its creative-business sector (for- profit and non-profit) with those in comparable American cities. The result is a new and compelling view of Houston as a city of great creative activity, employing many tens of thousands and generating billions in economic activity. At a time when the creative economies in other American cities have seen a constriction, this is the story of a city on the rise in creative economy output with potential of tremendous growth with the right investment. Read on to learn more about Houston’s creative outlook—and why the city has good reason to be excited about the future. 5
- 9. executive summary Cities, regions and states across the country—as well as across the world—have been measuring the size, profile and impact of their cre- ative sectors for years. Regions that once relied on industry as the primary engine for the economy, such as New England and portions of Great Britain and Northern Europe, began in earnest decades ago to measure this opportunity area—the creative sector—as a part of retool- ing their economies for intellectual enterprise, tourism and other 21st century economic generators. And here in the States, younger cities and regions considered for this study, only Houston and Dallas they use, revenue that is sent to other communities. such as Seattle, Austin and greater Los Angeles, have saw creative-sector gains in the decade between By growing the local creative sector, Houston can adopted the “creative economy” as a vital and even 2001 and 2011. During that period, the city’s industry meet more of its own demand and keep more revenue critical component to a diversified regional economy. grew by 8 percent. Projections indicate that by 2016 at home. Fortunate to have a growing and diversifying employment in Houston’s creative economy will be Creative economy workers overall are educated, economy, Houston has not been faced with the 16 percent larger than it was in 2001—the largest gain highly compensated workers. Many American cities hard work of rebuilding. The city has reaped great of any city in the study. from Milwaukee to Albuquerque are attempting to rewards by investing in the medical industry, For workers in the creative sector, Houston has attract them to bring their industries and families energy, and the great Port of Houston. And with strong earnings potential. The city ranked ahead to those cities. Without much effort, Houston has that has come a booming construction industry and of Dallas, Philadelphia, Miami, Chicago and Los created one of the country’s larger and more robust services to support. Angeles in median earnings per creative worker. creative economies. With targeted resources, Houston Less measured, but tremendously vital, the With Houston’s low cost of living, these findings could evolve this sector at an even greater rate than is creative economy is a diverse and broad-based could be attractive to creative workers looking to already predicted. collection of industries—non-profit and for-profit— relocate or creative business owners looking to that employ more than 146,000 individuals in move or expand their business. primary and support roles across the ten-county Importantly, Houston is underserved by local region. In 2011, creative businesses in Houston had creative businesses. While demand by city residents an economic impact of more than $9.1 billion. is $20.53 billion in sales, local companies provide only Houston has been on the rise for a decade. $10.77 billion worth of creative goods and services. Comparison data shows that, of the six cities Houstonians import almost half of the creative goods 7
- 10. CHLOE DAO As a young immigrant from Laos, Chloe Dao spent Saturdays at her family’s snack bar at a Houston flea market—making shish kabobs and watching CNN’s “Style with Elsa Klensch.” “That was really my first insight into international fashion.” After eight years in New York, working in fashion and attending the Fashion Institute of Technology, she moved back to Houston in 2000 to open her own boutique. Lot 8 (now called Dao Chloe Dao) was an innovative, gallery-style showcase for young American designers and her own work. In 2005, she auditioned, almost on a whim, for Season 2 of “Project Runway” and ended up winning. She con- siders that achievement a triumph for her mother, a hard-working entrepreneurial type who raised eight daughters, and her hometown. “It lets every- one know that Houston is actually a very, very sophisticated international city.” Houstonians, she says, “are hungry for new stuff. They love fashion. They love the arts. They love to travel.” 8
- 11. HOUSTON’S Current CREATIVE ECONOMY 9
- 12. HOUSTON’S CREATIVE ECONOMY CREATIVE CREATIVE INDUSTRIES OCCUPATIONS 2011 TOTAL EMPLOYMENT 146,625 55,436 35,747 55,442 non-creative workers in creative-artistic workers creative-artistic workers creative industries in creative industries in non-creative industries accountant architect at graphic designer at graphic design company architecture firm at oil & gas company curator at a museum 91,804 91,189 creative INDUSTRIES creative OCCUPATIONS Culture & Heritage Media & Film Artists Designers museums; libraries and archives; Advertising agencies; newspaper Musicians and singers; writers Architects; architectural and civil historical sites publishers; software publishers; and authors; music directors and drafters; multi-media artists and periodical publishers; television composers; entertainers and animators; interior designers; Design broadcasting; radio stations; direct performers; actors; fine artists jewelers and precious stone designers; Built Environment: architectural mail advertising; motion picture and (including painters, sculptors, etc.); landscape architects; set and exhibit services; graphic design services; video production; teleproduction and choreographers; molders, shapers designers; fashion designers interior design services; landscape other postproduction services; record and casters; craft artists; dancers; curators; makeup artists Media architectural services production; sound recording studios Cultural Photographers; graphic designers; Product: interior design services; Performing Arts Librarians; library technicians; marketing managers; art architectural metal work Independent artists, writers, and curators; audio-visual collections directors; editors; producers and manufacturing; fashion and performers; theater companies and specialists directors; radio and television special product design dinner theaters; musical groups; announcers; advertising and musical instrument and supply stores; Communications: advertising; promotions managers, A/V dance companies graphic design; printing equipment technicians; reporters Visual Arts & Crafts and correspondents; broadcast Hobby, toy and game stores; technicians; proofreaders and copy photography studios; jewelry stores; markers; film and video editors fine art schools; book stores; art dealers; commercial photography; lighting 10 equipment manufacturing
- 13. What is a Creative Economy? Who’s in the creative economy? Before a city or region can determine the size and condition of its creative economy it has to answer a question: what is a creative economy? Or more specifically, what is our creative economy? A trucking company isn’t Like so many of the world’s great ponderings, it depends on who you ask. considered “creative,” but the All companies have a creative element and, for all we know, employ an incredible number of weekend sculptors, origami enthusiasts and shower singers. But staffing creative people is not the same thing as operating a creative business. “Creative business” isn’t a subjective label, it’s an employment-category. graphic artist who designs its Still, determining which jobs and businesses fall into the creative sector can be confusing. With so many brochures makes the list. variables, how do you draw a creative line? From a national perspective, there is no one accepted measure for creative economy. Washington D.C. Similarly, a business that defines the sector differently from Chicago or Miami—or Houston. For this study to ring true in Houston, we defined the creative economy more narrowly than other cities. At the same time, we attempted to produces a creative product, identify common employment categories to begin to create more consistent criteria among American cities conducting similar studies. like an architectural firm, In order to make direct comparisons, analysts used accepted classification-criteria in identifying creative will likely employ accountants, businesses for study. So, for the purposes of this report, you’ll need a few definitions: Creative industries are those in which a creative or artistic element is an integral part of the janitors and other delivery of its product or service, e.g. “photography.” non-creative personnel. Creative businesses are those individuals and companies working within that industry, e.g. “recording studio.” And a creative job is any occupation having, as its primary purpose, a task which requires the use of creative or artistic skills, regardless of industry, e.g. “writer.” The economic activity generated from these groups combines to form a creative economy. 11
- 14. GREG CARTER It all began with a film class at Texas A&M. Greg Carter was earning a degree in engineering when he took that course and found his passion. After graduation, he studied film at Rice, then soon went on to write, produce and direct Fifth Ward (1998), winning Best Director and Best Film at the 30th Parallel Film Festival. Now with more than 19 feature films and documentaries under his belt as producer—he directed nine and wrote six of those projects—Carter has worked all over the country. Yet he still contends Houston is who he is. “Nowhere else in the world are people more supportive or friendlier,” says the Texas Filmmakers’ Hall of Fame inductee. “People sincerely want you to succeed here. Maybe that’s why I see everything through those Houston-rose-colored glasses. Houston is my first choice for making a film.” 12
- 15. Why the Creative Economy Matters Creative businesses, in their various forms, conceptualize, create or sell an array of products ranging from architecture, music, photographs and films to textiles, fashion, websites, advertising and much, much more. But there is one thing that they all produce in common—revenue. Creative industries provide a surprisingly sizable component of any city’s economy. They also provide a significant number of jobs. Combine that with the multiplier effect through suppliers and peripheral businesses, and there’s no doubt that the creative sector is a highly desirable and sought-after piece of today’s urban economies. It’s no wonder that cities increasingly are looking to creative businesses as they begin to position themselves for growth in the 21st century. Creative businesses are a symbol of vibrant, clean and forward-thinking communities, which can bring numerous benefits, such as: “The emerging creative • Greater diversity—and thus greater stability—of a local economy economy has become a • Greater ability to attract new employers (quality of life) • Greater ability to attract professionals and families (diverse job opportunities) leading component of • Higher profile in national and international media (“creative” is cool) economic growth, employ- • Proven record as a growth industry with great potential for further expansion ment, trade and innovation, • Elevated tourism appeal and social cohesion in most advanced economies.” —The United Nations Conference on Trade and Development 13
- 16. local employment by sector, 2011 TRANSPORATION 124,400 WHOLESALE TRADE 139,300 FINANCE & REAL ESTATE 141,800 CREATIVE 146,625 CONSTRUCTION 171,700 source: Texas Workforce Commission 0 50k 100k 150k 200k local earnings by industry, 2011 REAL ESTATE $2.58 billion RESTAURANT & FOOD SERVICE $3.27 billion CREATIVE $4.32 billion FINANCE $7.83 billion source: Quarterly Census of Employment & Wages 0 1 2 3 4 5 6 7 8 local median hourly wages, 2011 MEDICAL TRANSCRIPTIONISTS $17.25 STRUCTURAL IRON & STEEL WORKERS $17.87 BRICK MASONS $20.74 ELECTRICIANS $21.45 CREATIVES $22.08 TOOL & DIE MAKERS $22.65 source: U.S. Bureau of Labor Statistics 14 0 5 10 15 20 25
- 17. Is Houston a “Creative City”? Known for its prowess in medical research, health care and energy, and as one of the continent’s most productive sea ports, Houston is also a center of education, anchored by the esteemed Rice University and University of Houston. Both serve as deep training grounds in the creative sectors, including art theory, architecture, film, theatre, dance and industrial design. So while Houston is known as a dynamic city, a productive city, a resourceful city, the question remains: Is Houston a “creative city”? The good news: Houston is a creative city. Creative job growth and revenues confirm that story. Houston’s creative economy has grown during a decade in which similar cities across the nation experienced decline. Some of that is its location—Texas is a jobs-magnet even in a recession—but Houston’s creative sector outgrew even other urban areas in the state. The less than good news: Although Houston’s creative sectors grew more rapidly than other major metro areas, our creative employment figures are still lower than those in Dallas, Chicago, Miami, Philadelphia and Los Angeles. In other words, we are growing rapidly, but other, sometimes smaller, cities still have larger sectors than ours. Why? One reason is likely perception. There is a difference between being a creative city and being Houston’s creative perceived as a creative city. In the 21st century, Houston has an opportunity to redefine itself as a modern, forward-thinking, creative-industry center in the eyes of the world community. By honing that image, economy has grown Houston as the energy capital can also become the global hub for creative energy. during a decade in which similar cities across the nation experienced decline. 15
- 18. DAN WORKMAN People are sometimes surprised that Dan Workman earns his living in the record industry in Houston. “I just remind them it’s a city of two million people and there are lots of people who need music recording,” says the president of SugarHill Recording Studios, the nation’s oldest continuously operating recording studio. “As a result of sticking with it, I have become one of the go-to guys for doing that in a major metropolitan area.” Workman learned the business as a guitarist in the experimental punk band Culturcide and purchased SugarHill with his partners in 1996. “Houston’s biggest asset is its diversity,” says the man who runs the studio where The Rolling Stones, Destiny’s Child and Freddy Fender have all put down tracks. “Oftentimes people are not aware of the huge burgeoning music scene that is literally right next door to them.” 16
- 19. Houston’s Creative Economy At-A-Glance These key facts about the creative economy in Houston tell the high-level story. Details follow elsewhere in this report. • Houston has a growing creative economy. • In 2011, 146,625 jobs made up the creative economy in Houston. • Houston’s creative economy employs more people than the Texas Medical Center. • T he economic impact of Houston’s creative goods and services was $9.1 billion in 2011. • Houston’s creative economy grew by 8% between 2001 and 2011. • By 2016, the city’s creative economy is projected to grow by an additional 7%. • I n a comparison of the Houston, Dallas, Miami, Philadelphia, Chicago and Los Angeles metropolitan areas, only Houston and Dallas added creative-sector jobs between 2001 and 2011. • I n the same comparison, only Houston and Dallas are projected to have more creative-sector jobs in The economic 2016 than they did in 2001. • I n the median earning per worker analysis, Houston was ahead of the other cities in the study. impact of Houston • N ine of ten counties in the Houston metropolitan area increased arts-sector employment between creative goods 2001 and 2011. • T hough growing, Houston’s creative economy is still smaller than the five other cities cited in the study. and services was $9.1 billion in 2011. 17
- 20. saba and sarah jawda Growing up, sisters Saba and Sarah Jawda were encouraged to be creative. As adults that creativity translated into graphic design, advertising, public relations and marketing (for Sarah) and architecture, interior design and art (for Saba). Together they are the design team of Jawda and Jawda. The collaboration came naturally, and while each sister specializes in specific aspects of the design business, they depend upon one another. “We have similar style, but with different takes on how we get there, so it helps to step back and view each project separately and again together,” says Saba Jawda. “We have fun, and we really push one another creatively and professionally.” Right now they are focused on interior design, graphic design and a furniture line JAW[LINE]. “That’s not saying we stop there—we are problem solvers, we don’t limit ourselves,” she concludes. With Houston as their home base, they feel the opportunities are endless. 18
- 21. How Houston’s Creative Economy Compares 19
- 22. CHUY BENITEZ Born in El Paso, Texas, photographer Chuy Benitez came to Houston by way of University of Notre Dame, where he began in engineering and ended up in photography. His college advisor tried to talk him out of it, but Benitez had found his focus. He came by his passion naturally: Growing up in his family’s wedding- planning business, he took tons of photos. Not long after graduating from Notre Dame, he came to Houston, attracted by the reputation of Fotofest and University of Houston’s MFA program. Soon, his signature panoramic portraits had created a buzz. “I don’t have family here in Houston, but Fotofest Co-founders Wendy Watriss and Fred Baldwin are like family to me,” says Benitez. “In fact, everyone at Fotofest is like family. They’ve all just been so supportive of me and of my work.” At Notre Dame, Benitez also discovered he has a knack for the classroom. He now teaches photography at St. John’s School. The students, he says, “have an abundance of talent. They are the real stars.” 20
- 23. A Tale of Six Cities : Creative Job Growth Houston’s creative community is responsible for 146,625 jobs and has an economic impact of $9.1 billion. Of the six cities cited in The figures say a lot about the importance of creative commerce—but, viewed alone, they can’t tell you if you’re keeping up with the Joneses. the study, Houston saw the In this case, the Joneses are five cities across the nation selected for comparison studies—Dallas, Miami, largest creative-job growth Philadelphia, Chicago and Los Angeles. In a side-by-side comparison, the Houston metro area leads the pack in terms of creative-sector job growth between 2001 and 2011. since 2001. Among the findings in the study: • H ouston has added 11,268 creative industry jobs, growing over eight percent over the past ten years. Houston and Dallas were the only cities in the study with positive job growth since 2001, with Dallas reporting one percent in the past ten years. By comparison, Miami shed 13,521, Philadelphia 15,214, Chicago 31,279, and Los Angeles 66,146. • F rom 2001 to 2016, Houston’s creative sector is projected to grow by 16 percent. Dallas is expected to grow by eight percent. Each of the other cities is projected to have net job losses over the same period, with Chicago declining eight percent, Philadelphia and Los Angeles six percent, and Miami four percent. • W hile each of the cities in the study is expected to see creative-sector growth between 2011 and 2016, Houston and Dallas are expected to grow at a more rapid pace. Dallas and Houston are projected to grow at seven percent, Miami by three percent, Chicago and Los Angeles by two percent, and Philadelphia by one percent. • O f the six cities studied, only Houston and Dallas are projected to have larger creative economies in 2016 than they did in 2001. 21
- 24. FIONA MCGETTIGAN AND ALAN KRATHAUS You’ll find CORE Design Studio partners Alan Krathaus and Fiona McGettigan working on projects all around town. That’s because their contemporary design practice finds solutions for a wide range of challenges. “While our primary interest is textual,” says McGettigan, “our work includes environmental design, landscape, exhibit and public art, too.” They look at their studio flexibly, working with cultural, non-profit organizations, educational and architectural offices, urban planning groups and a variety of businesses on projects ranging from identity programs and branding (Academy, Houston Arts Alliance) to environmental graphics, exhibit design and public art and design. For more than a year, the two have researched the history of performances at Jones Hall and designed a series of installations to enliven areas of the hall. Spare time? McGettigan is an associate professor of graphic design at the University of Houston, and Krathaus’s photographs and installations have been exhibited nationally in venues including the Tang Teaching Museum (Saratoga Springs, N.Y.) and the Aldrich Museum of Contemporary Art (Ridgefield, Conn.). Both have exhibited work at the Museum of Fine Arts, Houston. 22
- 25. Creative Job Numbers The good news is that Houston’s creative community is growing; the bad news is that the growth is overdue. Of the six cities studied, Houston has the fewest number of individuals working in creative industries. After declining for a decade in each city but Houston and Dallas, creative jobs are expected to rebound in all six cities. HOUSTON 156,988 MIAMI 172,549 Total Creative ECONOMY Jobs PHILADELPHIA 190,681 2001–2016 DALLAS 230,682 CHICAGO 287,855 LOS ANGELES 800,556 0 100k 200k 300k 400k 500k 600k 700k 800k 900k Number of jobs 2001 2011 2016 23
- 26. TONI WHITAKER Toni Whitaker’s mother taught her to sew when she was 6. “I had a little Singer machine that we would clamp to the dining room table next to hers.” Driving through Texas in the ’80s, after college and a short teaching stint in Phoenix, she fell in love with Houston, and never left. “I thought if I could make it anywhere in fashion, it would be Houston, because they were open to everything.” From her first tiny shop in Rice Village, she became the grand doyenne of Houston style, dressing an influential clientele in her classic Audrey Hepburn- and Jackie O-inspired clothes. “These were women who were not interested necessarily in wearing a Chanel or a Valentino. They just wanted good clothes.” And they wanted personality, which she brought in bolts. She credits her people and business savvy to her dad, a Camden, S.C., pharmacist. “What I bring to the table is that cottage industry. I’m not just the fashion designer. I’m the bookkeeper, accountant, entrepreneur. I do everything.” 24
- 27. The Ace in the Hole : Good Pay One notable figure arising from the comparative study deals with the median earnings per worker in creative fields. The results are encouraging and could prove advantageous as Houston attempts to attract creative workers and creative businesses in the future. According to the study, Houston is number one in median earnings per creative worker. This means that while Houston may have fewer creative workers, they are better paid than in any of the other cities included in the study. The figure becomes more impressive when you consider that Houston has a low cost of living. MEDIAN EARNINGS PER WORKER MIAMI HOUSTON PHILADELPHIA DALLAS CHICAGO LOS ANGELES Houston could promote “higher wages, lower cost of living” in attracting creative workers. 25
- 28. gwendolyn zepeda Gwendolyn Zepeda educated herself on British lit and science fiction. So it wasn’t until she discovered Latina author Sandra Cisneros that she realized Mexican-Americans were “allowed” to write about themselves. “I grew up pretty poor in a bad neighborhood,” says the quirky, introverted daughter of an IBM typewriter repairman. “So I don’t think I ever thought I’d be a writer.” Since 2004, Zepeda has published eight books, including her debut short-story collection (To the Last Man I Slept with and All the Jerks Just Like Him), two Texas-themed novels (Lone Star Legend and Houston, We Have a Problema) and four children’s books. Often marketed as a regional author, Zepeda thinks her latest novel, Better with You Here, will find a mainstream following. A technical writer in the financial-services industry by day, the three-time Houston Arts Alliance New Works Fellowship recipient finds her hometown to be a warm and an embracing creative environment. “Sometimes I feel like I know every artist in this city, no matter what their discipline.” 26
- 29. Creative Earnings What do “creative” jobs create? Everything under the sun, but, from an economic standpoint, they create earnings. Earnings are a key measure of the importance of creative industries. As with the total number of creative sector jobs, Houston’s aggregate earnings are expected to continue to grow over the next five years. 60 24 50 MEDIAN EARNINGS PER WORKER CREATIVE WORKERS’ EARNINGS 40 20 (billions of dollars) regional earnings impact 30 20 16 10 0 12 MIAMI HOUSTON PHILADELPHIA DALLAS CHICAGO LOS ANGELES MEDIAN EARNINGS PER WORKER 27
- 30. RANDY TWADDLE Early in his career as a painter, Randy Twaddle held what he calls a “strident definition of what it means to be an artist.” Over time, he mellowed. More expansive in his thinking, he merged art and business through creative collaborations. When he and music producer David Thompson started the multi-disciplinary, strategic communications and design consultancy ttweak in 1998, they pro- vided their clients with innovative solutions to marketing conundrums always from an artist’s perspective—from producing fund-raising videos to branding wind farms. In 2004, they uncovered Houstonians great affection for their “affliction”- ridden (cockroaches, heat, no mountains) city with a blog, which led to the photo exhibition and now legendary book Houston. It’s Worth It. More recently, Twaddle joined forces with architect Joe Meppelink (see page 40) to create the non-profit It’s Made in Houston. Combining their talents, the two plan to connect Houston’s creative commu- nity with the city’s unique manufacturing infra- structure, promoting the successful outcomes of 28 these collaborations.
- 31. The Future of Houston’s Creative Economy 29
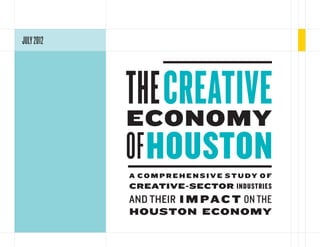
- 32. HOW BIG IS THE CREATIVE INDUSTRY ECONOMY? THE BASICS THE DETAILS $12.18 billion TOTAL SALES $10.77 billion PRODUCED SOLD LOCALLY $4.32 billion TOTAL EARNINGS $21.93 billion TOTAL CREATIVE $1.4 billion PRODUCED LOCALLY EXPORTED INDUSTRY SALES Does not include creative workers in non-creative industries $9.76 billion IMPORTED The creative industries in Houston’s Metropolitan Statistical Area (MSA) drive significant value and output; however, almost half of the demand in the region is met through importing products and services 30 from outside the region.
- 33. Creatively Speaking, There’s Room to Grow Bottom line: Houston’s demand for creative goods and services is greater than its supply of creative goods and services. Currently, demand for creative goods and services in Houston is $20.53 billion. The amount of creative goods and services produced locally is $10.77 billion. So how do consumers and businesses get the additional products they need? Imports. City residents import $9.76 billion in creative goods, sending the money to other communities. Houston’s creative businesses export only about $1.4 billion in creative goods, so the amount of money coming into the city is considerably less than that leaving it. To illustrate, think of the city’s economy as water in a tank. The dollars sent away from the city (import substitution) drain the tank. The loss of that money reduces the multiplier effect that happens when money remains in the city (resource depletion), causing a leak of possible revenue. And since imports of the goods exceed exports, the tank isn’t being refilled as quickly as it is being emptied. A chart of multipliers by industry is available on page 44. When money remains in a When money remains in a city, it tends to benefit other local businesses across the economic spectrum. This is the multiplier effect. With this in mind, Houston could consider different ways to help creative businesses better meet local demand, including: city, there is a multiplier 1. Targeting out-of-town businesses for relocation in fields where the city has an imbalance of supply and demand. 2. Targeting out-of-town creative entrepreneurs to relocate to Houston. effect, benefitting other 3. Seeking buyers in other communities for Houston’s creative products, increasing local exports and bringing in new revenue. local businesses across 4. Telling our story! Elevate the visibility of Houston as a creative hot-bed so that creators, producers and consumers look to Houston for their creative answers. the economic spectrum. 5. Keeping our creatives. Our universities and creative businesses produce more creative professionals than we retain in Houston. Invest in creative entrepreneurs. Keep them in Houston. 6. Training Houstonians. American creative businesses often have to import talent to get the job done. Support legislation that invests in K-12 arts education and high-quality university programs to train Houstonians in creative business. 7. Helping local firms expand in the regional marketplace to meet area demand. (Note: Organic growth, e.g. internal industry/economic expansion, is growing in economic development popularity. Also known as “economic gardening.”) 31
- 34. College Station Conroe 2001–2016 Brenham Beaumont Humble CREATIVE JOB GROWTH HOUSTON Katy Baytown Sugar Land Pasadena Missouri City Rosenberg Friendswood Alvin Galveston 6720 to 13691 Angleton 2324 to 6719 440 to 2323 73 to 439 College Station Conroe 2001–2016 Brenham Beaumont Humble % CREATIVE JOB GROWTH HOUSTON Katy Baytown Sugar Land Pasadena Missouri City Rosenberg Friendswood Alvin Galveston 71 to 96 Angleton 56 to 70 32 to 55 32 23 to 31
- 35. Creative Leaps in the Metro Area The Houston metro area covers ten counties: Harris, Fort Bend, Montgomery, Brazoria, Galveston, Liberty, Austin, Waller, Chambers and San Jacinto. With such a large geographic region, job growth in the surrounding area is of particular significance. Between 2001 and 2011, nine of the ten counties increased their creative occupations employment. Only Austin County experienced creative job losses over that period, which were minimal at 75. Each county in the area is expected to see creative job increases by 2016. The $10.77 billion in creative Since 2001, the greatest gain has occurred in Harris County, which added 3,908 jobs. It is expected to add another 5,147 jobs through 2016, giving the county an eight percent increase over the 15-year period. Fort local activity generated by Bend County is experiencing the highest percentage growth in employment of creative occupations with a 60 percent increase over the 15-year period. Houston’s 10-county metro area would be equal to the 242nd spot on the 2012 list of Fortune 500 companies, ahead of HJ Heinz (Fortune #244) at $10.70 billion in revenues. 33
- 36. TINA ZULU Even as a child, Tina Zulu was into selling. “When I was a little kid, I used to play store all the time,” says Zulu, the founder and self-described “chieftess” of Zulu Creative, a niche-marketing firm catering to fashion, music, art and hospitality clients. Like Manhattan party queen Susanne Bartsch, Zulu started out with a clothing boutique and soon was producing the coolest events in town. “I really like to think we were crucial in the revitalization of downtown,” Zulu says of the DJ-driven fashion shows, record-release parties and themed events that formed her late ’90s salad days. Eventually this daughter of Filipino immigrants earned a degree in marketing and entrepreneurship from University of Houston and after a stint at Continental Airlines started Zulu Creative in 2006. Today she gets paid to promote the things she loves—from jewelry designers to Cajun cooks. “It’s just natural for me to spread the word,” says Zulu, Houston’s guru of hip. 34
- 37. The Creative Jobs Listing The study indicates nearly 150,000 individuals hold creative-sector jobs in the Houston MSA. Those jobs come with a wide-range of titles, but they can be divided into three categories: Jobs for painters, sculptors Creative Workers in Creative Industries Example: Graphic artist working at an advertising agency and illustrators in Houston Creative Workers in Non-Creative Industries Example: Musical director at a house of worship are expected to grow Non-Creative Workers in Creative Industries Example: Office manager at an architectural firm by 13% through 2016. Who is the creative community? The complete list of job titles are listed at the back of this report. They include video and film producers, graphic artists, architects, web designers, choreographers, photographers, fashion designers, novelists, and that’s just the beginning. The creative community is a broad term that reaches far beyond the obvious sculptors, painters, dancers and musicians. The study looked at individual professions within the creative sector and found expanding opportunities in each of the categories. The bottom line: Houston’s creative sector is a broad-based community on the rise. With the range of jobs included under the creative umbrella, the city has many opportunities to enlarge its creative profile. 35
- 38. 76 5 6 7 1 13, 7 5 , 01 4 , 89 4 , 00 3 , 75 5 16,80 6, 772 6, 105 5, 633 3, 935 3 18,21 7,630 6,776 6,403 4,180 Photographers MUSICIANS SINGERS GRAPHIC DESIGNERS WRITERS AUTHORS ARCHITECTS except landscape naval 2 0 6 5 1 3 , 05 2 , 67 3 , 38 2 , 24 1 , 94 3, 868 3, 323 3, 366 2, 991 2, 589 4,186 3,700 3,528 3,348 2,904 MERCHANDISE DISPLAYERS MARKETING MANAGERS ARCHITECTURAL ART DIRECTORS MULTI-MEDIA ARTISTS WINDOW DRESSERS CIVIL DRAFTERS ANIMATORS Number of jobs Top Creative OCCUPATIONS by Year 2001 2011 36 2016
- 39. Top Creative Occupations As industries change, so do their occupations. The lamplighter, the typist, the newspaper typesetter, the switchboard operator—each saw his/her industry dwindle only to be replaced by something new and exciting. Industry employment figures change for a variety of reasons—new technologies, emerging trends, geographic shifts, cost benefits, economic conditions—which, depending upon the industry you happen to work in, can be a plus or minus. For the past decade, employment of creative occupations has been a net positive for the Houston Metropolitan Area. Of the top ten creative occupations, all are projected to see their numbers grow by 2016. Photography is the top creative occupation in Houston. The number of photographers in Houston is projected to grow over the next four years by 11% to more than 18,000 by 2016. 37
- 40. 85 8 1 9 4 10, 0 4 , 61 3 , 31 2 , 33 2 , 49 7 13,08 4, 367 3, 625 3, 349 3, 035 0 14,55 4,713 3,919 4,027 3,560 INDEPENDENT ARTISTS, ARCHITECTURAL SERVICES HOBBY, TOY, GAME STORES PHOTOGRAPHY STUDIOS, GRAPHIC DESIGN SERVICES WRITERS, PERFORMERS PORTRAIT 3 4 0 3 3 2 , 08 2 , 05 2 , 87 4 , 75 1 , 75 3, 062 3, 190 2, 778 2, 530 1, 873 3,481 3,762 3,013 2,456 2,110 INTERIOR DESIGN SERVICES FINE ARTS SCHOOLS ADVERTISING AGENCIES SOFTWARE PUBLISHERS MUSEUMS Number of jobs Top Creative Industries by Year 2001 2011 Examined by industry, eight of the top ten industries 38 2016 are expected to see growth by 2016.
- 41. Leading Creative Industries Creative Industries Growing Compared with National Figures Employment in film has declined significantly Overall, Houston’s creative industries continue to grow at a faster rate than comparable cities across the over the last 10 years, and production of big budget nation. The region has a higher than average number of theater and dinner theater companies, and above features has eroded due, in part, to the lack of average growth rates are expected to continue through 2016. Houston also boasts numbers of architectural financial incentives. However, the industry has services, record producers, museums and ornamental and architectural metal work manufacturing. Of stabilized with commercials, reality T.V. shows, those industries, only ornamental and architectural metal work manufacturing is projected to see job music videos, industrials and documentaries as losses through 2016. its primary markets. For film, Houston’s diversity provides its creative synergy: its greatest growth is within the indigenous industry of locally produced, low-budget films created by Indian, Latino, African-American and women filmmakers. 39
- 42. Andrew VRANA and Joe MEPPELINK Innovation. Sustainability. Functionality. These elements are the trademarks of Andrew Vrana and Joe Meppelink’s architectural practice Metalab Studio. With previous experience as metal fabricators and project managers, the principal partners have extensive knowledge of materials, processes and methods of construction with an emphasis on digital fabrication, which they also teach at University of Houston. They are equally at home working on civic art projects (such as Jaume Plensa’s stainless-steel human figures, Tolerance); designing a mobile solar powered sales center for a green developer; or coming up with a better way to install solar panels on rooftops—a nifty improvement that won them Architect Magazine’s 2012 Research Development Award. An advocate for Houston’s small manufacturing businesses, Meppelink is collaborating with artist Randy Twaddle to connect creatives with manufacturers through their non-profit, It’s Made in Houston (see page 28) “Houston has the largest manufacturing workforce in North America,” points out Meppelink. “From biomedical to shipping, oil and gas, and aerospace, our unique manufacturing environment just doesn’t exist anywhere else in the country.” 40
- 43. Takeaways and Considerations Creative-sector jobs are important to a city’s economy, future growth and identity in the world community. Houston’s creative job picture is big news, with more employees than the Medical Center and more than $12 billion in sales activity. It is on the rise, but it still lags behind cities with similar attributes. The data in this report provides an overview of the current state of the city’s creative economy. With it, community leaders can begin discussing a number of issues, such as: • Are we preparing students for creative economy jobs? • What resources are currently being used to expand the creative economy? • Are we investing in creative industries like other cities—even Austin and Dallas? • D oes Houston actively recruit creatives that are looking to leave less business-friendly environments like California? • A re tools available—tax incentives, small-business loans, subsidized space, incubators, public relations and promotional programs—that could grow the creative sector and provide additional benefits to the broader community? • A re there existing assets—warehouse space, vacant storefronts—that can be converted into innovative venues, galleries or shared-use? • C an Houston’s attractive characteristics—climate, cost of living, educational facilities, unique neighborhoods—be promoted to creative industries that might consider relocating? • What steps can Houston take to enhance its image as a “creative city” in the public eye? Image matters. Houston has the opportunity to change its “brand” and promote itself as a creative center of the 21st century. Among the available options: What resources • Airport messaging touting Houston’s creative growth are currently being • An online presence targeting creative industries • Advertising and public relations campaigns touting the city’s creative side used to expand the • Affiliating a creative-centered “tagline” with Houston outreach initiatives • E nhanced tourism promotions emphasizing the city’s creative offerings such as tours of film sites, art galleries and artist studios creative economy? • Press junkets for business and travel writers focused on the creative business-side of Houston 41
- 44. about the study The study was commissioned by Houston Arts Alliance and University of Houston. Information used in the findings was provided by EMSI (Economic Modeling Specialists, Inc.), a firm specializing in compiling high- quality employment data and economic analysis. Before gathering the data, EMSI, with the clients, selected the industries to be studied. Since the term “creative industry” is subjective, EMSI narrowed the field by referencing creative reports prepared for similar cities, as well as a list of creative industries developed by Dunn Bradstreet. The list developed is based on the North American Industrial Classification System (NAICS), the primary coding system used by most federal and state government data sources. The occupations selected for analysis are based on Standard Occupational Classification (SOC) codes. The competency categories of primary interest were “creativity” and knowledge of “fine arts,” though other factors were considered in the selection process. Comparison findings are based on data derived from creative economy analyses of Dallas, Philadelphia, Chicago, Miami and Los Angeles. 42
- 45. About EMSI EMSI (Economic Modeling Specialists, Inc.), is an Idaho-based company specializing in compiling high- quality employment data and economic analysis. EMSI works with businesses, community colleges, universities, workforce boards, economic development groups and other organizations. About Houston Arts Alliance Houston Arts Alliance (HAA) is a 501(c)(3) nonprofit arts organization that exists to enhance the quality of life and tourism in the Houston region by supporting and promoting the arts through programs, initiatives and alliances. HAA distributes grants to more than 220 nonprofit arts organizations and individual artists on behalf of the City of Houston. In addition, HAA advances Houston’s thriving creative community by cultivating business volunteers, commissioning the work of artists for public spaces, managing the city’s civic art collection of 450 artworks, showcasing Houston’s rich folklife traditions, and empowering arts organizations through capacity building. For information on all the arts, visit HAA’s online resource at artshound.com. About University of Houston Founded in 1927, the University of Houston is the leading public research university in the vibrant international city of Houston. Each year, the University of Houston educates more than 39,800 students in more than 300 undergraduate and graduate academic programs, on campus and online. UH awards more than 7,800 degrees annually, with more than 200,000 alumni. 43
- 46. Glossary of Terms The following definitions may prove helpful in Location Quotient: Several tables refer to a measurement National Change Effect: The national growth effect understanding the creative economy data included often used in regional sciences called location quotient. explains how much of the regional industry’s growth is Location quotient (LQ) is a way of comparing a region to a explained by the overall health of the national economy: if in the EMSI report: larger reference region according to some characteristic the nation’s whole economy is growing, you would gener- Creative Industries: EMSI’s customized list of 145 indus- or asset. The process for deriving this number is to divide ally expect to see some positive change in each industry tries which are predominantly focused on producing artis- the percentage of the whole which that asset composes at in your local region (the proverbial “a rising tide lifts all tic-creative goods and services. This is a compilation of the regional level by the percentage of the whole which boats” analogy). public, non-profit, and for-profit businesses, categorized that asset composes at the national level. For instance, if Industrial/Occupational Mix Effect: The industrial mix by 6-digit North American Industrial Classification System graphic designers make up 0.5% of the regional popula- effect represents the share of regional industry growth (NAICS) codes. Industries that require an element of cre- tion and 0.3% of the national population, we divide the explained by the growth of the industry at the national ative thinking but are not artistic have been excluded. first quotient by the second to obtain the location quo- level. To arrive at this number, the national growth rate of Creative Occupations: EMSI’s customized list of 51 occu- tient: (0.005/0.003 = 1.67). the total economy is subtracted from the national growth pations which are chiefly focused on the production and These data are fairly simple to translate into everyday lan- rate of the specific industry, and this growth percentage is distribution of artistic goods and services. These occu- guage. If the LQ score for any asset is above 1.00, then the applied to the regional jobs in that industry. pations were selected from the Standard Occupational region has a greater concentration of that asset than the Regional Competitiveness Effect: The regional competi- Classification (SOC) codes due to significantly higher nation. Conversely if the LQ score for any asset is below tiveness effect is the most important of the three indi- than average knowledge in areas critical to the arts; these 1.00, then the region has a lower concentration of that cators, as it explains how much of the change in a given include fine arts, creative thinking, and original thinking. asset than the nation. Using the previous example, if the industry is due to some unique competitive advantage Aggregate Earnings: This measure is the best simple regional LQ for graphic designers is 1.67, this means that that the region possesses, because the growth cannot approximation of the financial impact of the creative the region is 67 percent more concentrated with such be explained by national trends in that industry or the economy. Aggregate earnings for each industry and occu- workers than the nation as a whole. Another way of saying economy as whole. This effect is calculated by taking the pation are equivalent to the total amount of earnings this is that there are 67% more graphic designers, per total regional growth and subtracting the national growth paid to workers on an annual basis in the given category. capita, than the national average. and industrial mix effects. Note that this effect can be For instance, the industry 711110: Theater Companies and Shift Share Analysis: Shift share is a standard regional higher than actual job growth if national and/or industry Dinner Theaters pays its employees an average of $23,000/ analysis method that attempts to determine how much mix effects are negative while regional growth is posi- year and there are 1,900 workers employed by these com- of regional job growth can be attributed to national tive. This is because the regional competitiveness effect panies. Therefore, the aggregate earnings for the industry trends and how much is due to unique regional factors. accounts for jobs “saved” from declining national trends on an annual basis is $43.7 Million ($23,000*1,900= $43.7 This analysis is intended to answer the question “Why is as well as new jobs created. Million). The same calculation is performed for occupa- employment growing or declining in this regional indus- tional categories. try or occupation?” To do this, shift share analysis splits regional job growth into three components: the national change effect, industrial mix effect, and regional compet- itiveness effect. For the sake of simplicity, the following descriptions are restricted to the industry context but the same principles would apply in the occupational context. 44
- 47. Projected Occupational Growth 2011 Median 2011 Avg 2011 2016 SOC Code Description 2011 Jobs 2016 Jobs Change % Change Openings % Openings Hourly Wage Hourly Wage Aggregate Earnings Aggregate Earnings Average Education Level 27-4021 Photographers 16,805 18,213 1,857 11% 3,088 18% $21.12 $30.71 $1,073,449,624 $1,163,388,158 Long-term on-the-job training 27-2042 Musicians and singers 6,772 7,630 858 13% 1,541 23% $8.38 $11.13 $156,774,509 $176,637,552 Long-term on-the-job training 27-1024 Graphic designers 6,105 6,776 671 11% 1,609 26% $19.38 $23.89 $303,364,776 $336,707,571 Bachelor’s degree 27-3043 Writers and authors 5,633 6,403 770 14% 1,360 24% $11.37 $15.26 $178,795,926 $203,236,342 Bachelor’s degree 11-9041 Engineering managers 4,623 4,950 327 7% 799 17% $64.19 $68.54 $659,069,674 $705,687,840 Degree plus work experience 27-1026 Merchandise displayers and window trimmers 3,868 4,186 318 8% 913 24% $12.84 $15.56 $125,187,046 $135,479,053 Moderate-term on-the-job training 17-1011 Architects, except landscape and naval 3,935 4,180 245 6% 576 15% $35.41 $43.20 $353,583,360 $375,598,080 Bachelor’s degree 11-2021 Marketing managers 3,323 3,700 377 11% 735 22% $46.44 $52.87 $365,428,981 $406,887,520 Degree plus work experience 17-3011 Architectural and civil drafters 3,366 3,528 162 5% 523 16% $24.88 $25.83 $180,843,062 $189,546,739 Postsecondary vocational award 27-1011 Art directors 2,991 3,348 357 12% 690 23% $15.24 $21.97 $136,681,522 $152,995,565 Degree plus work experience 27-1014 Multi-media artists and animators 2,589 2,904 315 12% 605 23% $15.31 $19.87 $107,002,334 $120,021,158 Bachelor’s degree 25-4021 Librarians 2,555 2,900 345 14% 680 27% $25.53 $26.11 $138,758,984 $157,495,520 Master’s degree 27-2041 Music directors and composers 2,257 2,478 221 10% 449 20% $9.65 $12.20 $57,273,632 $62,881,728 Degree plus work experience 27-3041 Editors 2,243 2,396 153 7% 446 20% $19.37 $22.33 $104,179,275 $111,285,574 Bachelor’s degree 27-1025 Interior designers 1,938 2,106 168 9% 466 24% $21.55 $25.22 $101,662,829 $110,475,706 Associate’s degree 41-3011 Advertising sales agents 1,818 1,930 109 6% 291 16% $20.76 $29.11 $110,077,718 $116,859,184 Moderate-term on-the-job training 51-9071 Jewelers and precious stone and metal workers 1,548 1,625 (17) (1%) 237 15% $25.70 $29.48 $94,920,883 $99,642,400 Postsecondary vocational award 27-1023 Floral designers 1,489 1,566 77 5% 307 21% $11.09 $12.73 $39,426,338 $41,465,174 Moderate-term on-the-job training 27-2099 Entertainers and performers, sports and related workers, all other 1,327 1,497 170 13% 330 25% $12.71 $18.30 $50,510,928 $56,981,808 Long-term on-the-job training 27-2012 Producers and directors 1,283 1,356 73 6% 274 21% $18.74 $23.01 $61,405,406 $64,899,245 Degree plus work experience 27-2011 Actors 1,178 1,311 133 11% 275 23% $8.09 $16.20 $39,693,888 $44,175,456 Long-term on-the-job training 27-3011 Radio and television announcers 1,108 1,182 74 7% 230 21% $13.41 $18.79 $43,304,186 $46,196,342 Long-term on-the-job training 11-2011 Advertising and promotions managers 916 962 46 5% 154 17% $32.04 $34.25 $65,255,840 $68,532,880 Degree plus work experience 25-4031 Library technicians 794 908 114 14% 291 37% $12.34 $12.59 $20,792,637 $23,777,978 Postsecondary vocational award 27-1013 Fine artists, including painters, sculptors, and illustrators 772 876 104 13% 190 25% $9.62 $12.68 $20,361,037 $23,103,974 Long-term on-the-job training 27-3099 Media and communication workers, all other 787 873 86 11% 179 23% $19.10 $24.80 $40,596,608 $45,032,832 Long-term on-the-job training 27-4011 Audio and video equipment technicians 784 852 68 9% 186 24% $17.03 $18.59 $30,315,085 $32,944,454 Long-term on-the-job training 27-1021 Commercial and industrial designers 746 837 91 12% 206 28% $23.45 $29.85 $46,317,648 $51,967,656 Bachelor’s degree 27-1019 Artists and related workers, all other 713 799 86 12% 166 23% $10.27 $13.41 $19,887,566 $22,286,347 Long-term on-the-job training 27-3022 Reporters and correspondents 812 799 (13) (2%) 122 15% $14.06 $18.77 $31,701,779 $31,194,238 Degree plus work experience 17-2121 Marine engineers and naval architects 739 794 55 7% 133 18% $39.82 $45.08 $69,293,370 $74,450,522 Bachelor’s degree 27-2032 Choreographers 519 595 76 15% 195 38% $22.00 $22.42 $24,202,838 $27,746,992 Work experience in a related field 51-9195 Molders, shapers, and casters, except metal and plastic 532 567 4 1% 169 32% $16.65 $19.35 $21,411,936 $22,820,616 Moderate-term on-the-job training 27-1012 Craft artists 456 512 56 12% 107 23% $10.83 $13.89 $13,174,387 $14,792,294 Long-term on-the-job training 17-1012 Landscape architects 456 491 35 8% 74 16% $28.69 $34.10 $32,343,168 $34,825,648 Bachelor’s degree 27-3012 Public address system and other announcers 414 464 50 12% 107 26% $12.51 $15.36 $13,226,803 $14,824,243 Long-term on-the-job training 27-4012 Broadcast technicians 417 418 1 0% 74 18% $18.71 $21.30 $18,474,768 $18,519,072 Associate’s degree 27-1022 Fashion designers 304 352 48 16% 95 31% $16.21 $21.40 $13,531,648 $15,668,224 Associate’s degree 27-1027 Set and exhibit designers 305 340 35 11% 81 27% $18.38 $19.42 $12,320,048 $13,733,824 Bachelor’s degree 43-9081 Proofreaders and copy markers 308 332 19 6% 49 16% $13.67 $16.63 $10,653,843 $11,484,013 Short-term on-the-job training 27-2031 Dancers 272 304 32 12% 94 35% $13.35 $15.83 $8,955,981 $10,009,626 Long-term on-the-job training 27-4031 Camera operators, television, video, and motion picture 259 275 18 7% 48 19% $15.73 $21.51 $11,587,867 $12,303,720 Moderate-term on-the-job training 27-4032 Film and video editors 241 241 1 0% 39 16% $15.52 $19.76 $9,905,293 $9,905,293 Bachelor’s degree 27-1029 Designers, all other 212 235 23 11% 56 26% $18.54 $24.92 $10,988,723 $12,180,896 Bachelor’s degree 25-9011 Audio-visual collections specialists 138 160 22 16% 37 27% $19.17 $20.38 $5,849,875 $6,782,464 Moderate-term on-the-job training 27-4014 Sound engineering technicians 145 160 14 10% 37 26% $11.38 $14.58 $4,397,328 $4,852,224 Postsecondary vocational award 27-3021 Broadcast news analysts 109 117 8 7% 23 21% $16.11 $26.35 $5,974,072 $6,412,536 Degree plus work experience 27-4099 Media and communication equipment workers, all other 105 113 8 8% 21 20% $24.64 $26.34 $5,752,656 $6,190,954 Moderate-term on-the-job training 25-4012 Curators 92 108 16 17% 29 32% $18.72 $23.09 $4,418,502 $5,186,938 Master’s degree 39-5091 Makeup artists, theatrical and performance 70 80 9 13% 15 21% $12.00 $16.17 $2,354,352 $2,690,688 Postsecondary vocational award 27-4013 Radio operators 14 15 1 7% 4 29% $23.06 $27.15 $790,608 $847,080 Moderate-term on-the-job training Total 89,807 97,880 8,073 9% 19,405 22% $21.58 $26.66 $5,056,231,149 $5,503,611,942 Source: EMSI Complete Employment - 2011.4