SlideShare une entreprise Scribd logo
1  sur  10
Télécharger pour lire hors ligne
221


The Relationship Between Neuropsychologic Function and
Level of Caregiver Supervision at 1 Year After Traumatic
Brain Injury
Tessa Hart, PhD, Scott Millis, PhD, Thomas Novack, PhD, Jeffrey Englander, MD,
Rebecca Fidler-Sheppard, BA, Kathleen R. Bell, MD
  ABSTRACT. Hart T, Millis S, Novack T, Englander J,                                         © 2003 by the American Congress of Rehabilitation Medi-
Fidler-Sheppard R, Bell KR. The relationship between                                      cine and the American Academy of Physical Medicine and
neuropsychologic function and level of caregiver supervision at                           Rehabilitation
1 year after traumatic brain injury. Arch Phys Med Rehabil
2003;84:221-30.
   Objectives: To evaluate distribution of levels of caregiver                            T90,000 persons BRAIN States, leavingdegreea of permanent
                                                                                          to
                                                                                             RAUMATIC
                                                                                             problem in the United
                                                                                                                   INJURY (TBI) is major health

                                                                                                            per year with some
                                                                                                                                an estimated 80,000
supervision at 1 year after traumatic brain injury, and to deter-
mine neuropsychologic predictors of supervision level.                                    disability relative to their preinjury status.1 TBI can alter role
   Design: Prospective longitudinal design, concurrent mea-                               relationships, create marital disruption, and place great strain
surement of neuropsychologic function and supervision level.                              on the family system.2 Although persons of any age may be
   Setting: Seventeen Traumatic Brain Injury Model Systems                                injured, TBI affects primarily young adults, bringing societal
centers.                                                                                  burden and personal hardship in the form of many years of lost
   Participants: A total of 563 adults tested at 1 year postin-                           productivity. Of the multiple impairments caused by TBI, cogni-
jury; and a subgroup of 452 studied for neuropsychologic                                  tive and behavioral deficits are more likely than physical limita-
function in the absence of impairment in mobility or basic                                tions to preclude successful return to work or other forms of social
self-care, as assessed by high FIM™ instrument motor scores.                              productivity.3 Caring for survivors with physical and cognitive
   Interventions: Not applicable.                                                         disabilities places financial demands as well as less tangible bur-
   Main Outcome Measure: Supervision level measured by                                    dens on family members and government-funded institutions.
scores on Supervision Rating Scale (SRS).                                                    One important aspect of the caregiving role in relation to
   Results: Two thirds (69%) of the sample was rated as                                   moderate and severe TBI is the amount of supervision that is
independent of supervision. Participants without significant                               given to the injured person. Supervision implies the continuous
dysfunction on motor FIM were grouped into supervision                                    or intermittent presence of another person to provide physical
groups differing in intensity of time commitment from care-                               care, instructions for or set-up of daily living tasks, problem
giver (independent, moderate supervision, heavy supervision).                             solving in case of emergency, or some combination of these.
In univariate analyses, groups differed on demographic vari-                              For adults who were functioning independently before their
ables (education, race, productivity prior to injury), duration of                        TBI, supervision means a major lifestyle change for both the
altered consciousness, and all but 1 neuropsychologic measure.                            person with TBI and the involved caregiver(s). Research sug-
A binomial regression model (complementary log-log model)                                 gests that degree of supervision is 1 variable affecting per-
revealed that supervision at 1 year was predicted by education                            ceived burden of caregivers, either directly or indirectly. For
and scores on the Trail Making Test Part B and digits back-                               example, Marsh et al studied lifestyle changes that were both
ward.                                                                                     common and distressing to caregivers at 6 months4 and 12
   Conclusions: Findings confirm the importance of preinjury                               months5 after severe TBI. At 6 months, having “less time for
status and measures of working memory and cognitive flexi-                                 myself” was rated as the most common change for caregivers,
bility in predicting functional independence after TBI. The                               but was not rated as the most distressing. At 12 months, less
SRS appears prone to ceiling effects in persons followed pro-                             time for oneself was rated both the most common and the most
spectively after moderate to severe TBI.                                                  distressing change. This implies that the extra time devoted to
   Key Words: Brain injuries; Cognition; Outcomes Research;                               caring for a family member, or simply being in a constant state
Rehabilitation.                                                                           of responsibility for someone else, may be more difficult to
                                                                                          cope with as the need becomes chronic. Similarly, Wallace et
                                                                                          al6 found that high proportions of caregivers of persons with
                                                                                          TBI reported having to work less (30%), participating in fewer
                                                                                          leisure pursuits (43%), and having difficulty conducting usual
   From Moss Rehabilitation Research Institute (Hart, Fidler-Sheppard) and Depart-        activities (67%). Although the lifestyle changes in these studies
ment of Rehabilitation Medicine (Hart), Jefferson Medical College, Thomas Jefferson       are not measures of supervision alone, supervision needs may
University, Philadelphia, PA; Kessler Medical Rehabilitation Research and Education
Corp, West Orange, NJ (Millis); Spain Rehabilitation Center, University of Alabama,
                                                                                          comprise a significant portion of the extra time and energy
Birmingham, AL (Novack); Department of Physical Medicine and Rehabilitation,              required of caregivers at the expense of other activities. Yet for
Santa Clara Valley Medical Center, San Jose, CA (Englander); and Department of            all its potential importance as a clinical construct with impact
Rehabilitation Medicine, University of Washington, Seattle, WA (Bell).                    on the injured person and the family system, supervision has
   Supported by the National Institute on Disability and Rehabilitation Research
(grant nos. H133A70033, H133A980010, H133A980023).
                                                                                          not yet been extensively studied as an outcome of TBI.
   No commercial party having a direct financial interest in the results of the research      A few descriptive studies have directly measured the amount
supporting this article has or will confer a benefit upon the authors or upon any          and nature of supervision required for persons with TBI. For
organization with which the authors are associated.                                       example, Hawkins et al7 performed 3- and 12-month follow-
   Reprint requests to Tessa Hart, PhD, Moss Rehabilitation Research Institute, 1200
W Tabor Rd, Philadelphia, PA 19141, e-mail: thart@einstein.edu.
                                                                                          ups on a sample of 55 persons, most with severe TBI. These
   0003-9993/03/8402-7442$35.00/0                                                         investigators reported that only one third of their sample was
   doi:10.1053/apmr.2003.50023                                                            independent of supervision at 3 months postinjury. By 12

                                                                                                               Arch Phys Med Rehabil Vol 84, February 2003
222                                  NEUROPSYCHOLOGIC FUNCTION AND SUPERVISION, Hart


months postinjury, 59% were independent of supervision, but         ment of outcome, which was number of falls sustained in the
another 18% needed it full-time or nearly full-time. Granger et     hospital setting. Again, measures of executive function ex-
al8 explored aspects of caregiver help and supervision in more      plained a significant amount of variance in the real-world
depth by asking 22 community-based persons with TBI and             outcome measure.
their caregivers to keep a journal of the amount and type of           It stands to reason that both memory and executive function
assistance needed at home. The subjects were fairly evenly          would be associated with functional outcomes after TBI. The
divided among 5 supervision levels, ranging from “constant” to      ability to learn and retain novel information over time is
“none.” Although the findings of Granger may be difficult to          essential to safe, adaptive function in a changing environment.
generalize because of the small sample size, the data suggested     Executive function is a catch-all term used to describe a host of
that for those with intense supervision needs, the degree of        complex skills related to goal-directed behavior.20 Executive
motor impairment was important for distinguishing levels of         skills enable the organism to choose and deploy flexible be-
supervision required. However, for distinguishing among less        haviors in response to environmental demands, to regulate
intense levels of supervision, cognitive impairments were more      those behaviors via self-monitoring processes, and to sustain
important than physical status. Time postinjury seems to be a       plans of action over time. This class of functions is not con-
factor in determining supervision level in longer term outcome      sidered to be very well tapped by objective neuropsychologic
studies. For example, Corrigan et al9 followed 95 patients for 5    measures, which are commonly administered under structured
years and reported a decrease in the need for assistance and        and standardized conditions requiring little flexibility and de-
supervision from the first year after the injury (60%) to 4 to 5     cision making from the subject. Nonetheless, measures that do
years after the trauma (25%).                                       demand some degree of mental flexibility such as the Wiscon-
   The clinical and research literature10 suggests that cognitive   sin Card Sorting Test (WCST), the Trail Making Test Part B
and behavioral deficits caused by TBI are more strongly asso-        (TMT-B), and measures of fluency or generativity appear fairly
ciated with caregiver burden than are physical impairments.         robustly related to activities that demand executive function in
The Wallace6 study reported that of various domains rated by        real life.21,22 An excellent example is the demonstration in
the caregiver, only cognition accounted for significant variance     multiple studies23-25 of the TMT as a predictor of return to
in caregiver lifestyle change. Similarly, Hawkins et al7 found      driving after acquired brain disorder.
that only cognitive function ratings at 3 months postinjury            The measurement of supervision level has varied in previous
predicted degree of supervision at 1 year. In a study of persons    work on this topic, with most previous studies developing their
with TBI and their families 3 months postinjury, Smith and          own system, usually an ordinal scheme for rating the intensity
Schwirian11 found that the combination of impaired cognition        of care.7,8 The instrument used in the current investigation, the
and need for supervision was perceived as especially burden-        Supervision Rating Scale (SRS), was published by Boake in
some. In a French sample of persons with TBI, Mazaux et al12        1996.26 The SRS is an instrument for rating the degree of
reported that lack of mental flexibility and poor planning (as       supervision received on a 13-point ordinal scale from “inde-
rated by an experienced clinician) were associated with long-       pendent” to “full-time direct supervision (with patient in phys-
term impairment of “social autonomy” (ie, need for caregiver        ical restraints).” In his initial validation study on 114 persons
assistance and supervision). Clinical experience suggests, as       with TBI at an average of 4 years postinjury, Boake26 reported
noted by Granger,8 that there is sizeable group of persons with     that about 75% of the sample received at least part-time super-
moderate to severe TBI who require supervision for cognitive        vision. However, Hall et al27 reported the opposite finding in
or behavioral deficits, but whose physical function is relatively    their sample of 48 persons with TBI between 2 and 9 years
intact. In fact, supervising these individuals may be more          postinjury: about 71% were at the ceiling, that is, functioning
difficult because they are mobile. Little is known about the         without supervision. It is not clear what differences between
specific cognitive deficits that are present in these individuals,    these samples accounted for the discrepant findings, and it
and which deficits are most indicative of need for caregiver         remains unknown whether similar ceiling effects would be
presence or assistance.                                             found closer to the time of injury (eg, at 1y post-TBI).
   In the studies cited earlier, cognitive status was not deter-       One aspect of the SRS noted by Boake is that it contains no
mined objectively but was based on caregiver or clinician           provision to describe or explain the reasons why the person
ratings (eg, by using the cognitive items on the FIM™ instru-       with TBI is, or is not, receiving supervision. Thus, it is of
ment13). However, objective measures of cognitive function          interest to examine the correlates of SRS ratings to help elu-
(ie, neuropsychologic test scores) have been shown repeatedly       cidate the deficits and impairments that are associated with
to predict real-world functional outcomes. Ratings of func-         supervision outcome in this population. For the present study,
tional disability are significantly correlated with scores in a      we undertook analyses of SRS ratings performed on a sample
variety of cognitive domains in postacute TBI.14 Neuropsycho-       of persons at 1 year after moderate to severe TBI. These
logic testing after TBI provides significant incremental predic-     participants, who were enrolled in the Traumatic Brain Injury
tion of vocational status at 1 year postinjury, over and above      Model Systems (TBIMS) national database, had also under-
measures of initial injury severity and functional status mea-      gone neuropsychologic testing at the same follow-up interval.
sures.15,16 Measures of learning and memory and executive              The objectives of the study were 3-fold. First, we wanted
function appear to be overall good predictors of productivity       simply to examine the distribution of rated supervision levels,
outcome.17 Outcomes other than productivity and return to           both to determine the supervision characteristics of a large,
work have been studied, at varying intervals between testing        prospectively followed sample of persons with moderate to
and outcome measurement. For example, Hanks et al18 studied         severe TBI and to determine the extent of ceiling effects, if any,
the utility of neuropsychologic testing in inpatient rehabilita-    at 1 year postinjury. Second, we wanted to provide clinically
tion for predicting a range of social and functional outcomes at    accessible demographic, injury, and neuropsychologic data on
6 months post-TBI. Test scores, particularly in the areas of        the characteristics of persons with TBI at different levels of
executive function and memory, predicted outcome over and           supervision. To explore characteristics of a clinically signifi-
above the contributions of motor and sensory deficits. Another       cant subgroup, we elected to compare subjects at different
study by the same investigators19 used concurrent prediction,       levels of supervision in the relative absence of physical dis-
that is, testing conducted during the same time as the measure-     ability. Finally, we performed multivariable analyses to esti-

Arch Phys Med Rehabil Vol 84, February 2003
NEUROPSYCHOLOGIC FUNCTION AND SUPERVISION, Hart                                             223

mate the relative contributions of different aspects of neuro-      ment in the acute care hospital; the LOC, defined as the interval
psychologic function to variation in supervision level in the       in days between the TBI and the date at which the patient
absence of physical care needs, over and above that accounted       followed simple commands on 2 consecutive assessments
for by demographic variables and indices of injury severity.        within 24 hours; and the duration of posttraumatic amnesia
Based on previous research, we hypothesized that measures of        (PTA), defined as the interval in days between the TBI and the
learning, delayed memory, and executive function would pro-         first of 2 consecutive (within 72h) scores above 75 on the
vide significant incremental prediction of the need for super-       Galveston Orientation and Amnesia Test30 (GOAT). Neuropsy-
vision in persons who did not require supervision for mobility      chologic measures were derived from a comprehensive battery
or basic self-care activities.                                      of tests in wide clinical use, which was composed for the
                                                                    purpose of longitudinal study within the TBIMS project.31 The
                         METHODS                                    tests in the battery and the scores used in the present study are
                                                                    in table 1. Outcome measures were also selected from the
Participants                                                        comprehensive set of measures administered at 1-year follow-
   Participants were selected from persons enrolled in the          up. The main outcome variable of interest was the SRS, de-
TBIMS longitudinal database from the 17 TBIMS centers in            scribed earlier. Participants’ level of supervision was obtained
the United States. All participants met criteria for inclusion in   by interview with the patient and caregiver at follow-up. The
the Model Systems project by having sustained a penetrating or      13 ordinal levels of supervision rated on the original scale are
nonpenetrating TBI as evidenced by loss of consciousness            in table 2. A second outcome variable from the national data-
(LOC), focal brain lesion on neuroimaging, or abnormality on        base was used to select a subgroup of subjects for further study
neurologic examination consistent with external trauma. All         as described later. This was the FIM.13 The FIM is an 18-item
Model Systems enrollees were age 16 or older, received med-         rating scale assessing patients’ level of independence in motor,
ical care in a TBIMS-affiliated acute care hospital within 24        self-care, and cognitive items. Each item is rated on a scale of
hours of injury, and were transferred directly from acute care to   1 (total assistance) to 7 (complete independence). Rasch anal-
an affiliated inpatient rehabilitation hospital. All participants    ysis has revealed 2 main dimensions underlying FIM scores, a
provided informed consent directly or by legal proxy.               physical dimension that includes 13 items rating motor func-
   As has been described in detail elsewhere,28 longitudinal        tion and self-care abilities, and a cognitive dimension including
data collection for the TBIMS project occurs from acute emer-       the 5 cognitive items.32 Neuropsychologic and follow-up data
gency care to long-term follow-up. Initial data collection in-      were collected at 12 months post-TBI with a 2-month window
cludes demographic and social information, data on the type         in either direction (ie, between 10 and 14mo postinjury).
and severity of the TBI, and other medical data such as com-
plications. Data collected during the rehabilitation stay pertain   Data Analysis
primarily to functional status on admission and discharge.
                                                                       Descriptive statistics were calculated on the whole sample
Follow-up data collection, with which the present investigation
                                                                    with respect to the 13 SRS levels and the demographic and
is primarily concerned, is done at annual anniversaries of the
                                                                    injury variables listed previously. The large sample (N 563)
TBI for as long as contact may be maintained. The first-year
                                                                    was used primarily to characterize the distribution of scores on
follow-up information is collected in a 2- to 3-hour testing and
                                                                    the SRS. For inferential analyses on the differences related to
interview session with the patient and, if possible, a caregiver
                                                                    supervision level and the contribution of neuropsychologic
or significant other. This session includes a neuropsychologic
                                                                    factors, we selected a subset of participants who, at follow-up,
test battery and several outcome measures to assess functional
                                                                    did not show significant disability with respect to physical or
and social status, including the SRS, which was added to the
                                                                    self-care function. The purpose of this was to examine the
TBIMS data collection protocol in 1997. Normally, if personal
                                                                    characteristics of persons receiving supervision in the relative
contact is not possible at follow-up, telephone interviews are
                                                                    absence of physical assistance. Participants were assumed to be
conducted to obtain a portion of the data set. The current study
                                                                    physically independent if they received scores of 6 (modified
used only follow-up data collected in person because we were
                                                                    independence) or 7 (independent) on all 13 motor FIM items:
primarily interested in persons who had undergone neuropsy-
                                                                    feeding, grooming, bowel and bladder management and toilet-
chologic testing. Thus, in selecting a study sample, we selected
                                                                    ing, dressing (upper and lower body), transfers (bed, toilet and
from the national database all participants who had received all
                                                                    tub), bathing, locomotion, and stairs. There were 452 partici-
or any portion of the follow-up neuropsychologic test battery
                                                                    pants meeting this criterion. This subsample of physically
and had been rated on the SRS. These criteria were met by 563
                                                                    independent participants was used for all analyses described
participants. A subsample of 452 participants without signifi-
                                                                    later.
cant physical disability were used for most of the analyses, as
                                                                       For inferential statistical analyses, the 13 original levels in
described in the Data Analysis section below.
                                                                    the SRS were collapsed in 2 different ways. For 1 set of
                                                                    analyses, we used SRS scores to create groups of participants
Measures                                                            at 3 clinically meaningful levels of supervision. SRS levels 1
   Four types of variables were collected on each participant       and 2 were combined into a level considered as “independent.”
from the national database: demographic measures, injury se-        Levels 3 through 5 were combined into a level considered
verity variables, neuropsychologic test scores, and outcome         “moderate supervision.” The commonality among these 3 lev-
measures. Demographic measures were obtained by chart re-           els is that a caregiver may be absent for the time needed to
view and patient/family interview. They included age at injury,     work full-time (see table 2). Levels 6 through 13 were com-
gender, race, education, productivity status (eg, employment)       bined into a “heavy supervision” level in which a caregiver
at the time of injury, marital status, and primary person with      would not be able to work full-time. These 3 levels were used
whom the patient resided at follow-up. Injury variables in-         as a grouping variable for chi-square and Kruskal-Wallis tests
cluded the etiology of injury and 3 measures commonly used to       to examine differences on selected demographic and injury
estimate the severity of TBI. These were the Glasgow Coma           variables and on neuropsychologic test scores. In view of the
Scale29 (GCS) score on admission to the emergency depart-           large number of univariate comparisons, Bonferroni correction

                                                                                        Arch Phys Med Rehabil Vol 84, February 2003
224                                   NEUROPSYCHOLOGIC FUNCTION AND SUPERVISION, Hart


                                         Table 1: Neuropsychologic Tests in Follow-Up Battery

           Test                                   Description                                  Score                       Impairment Criterion

 GOAT                       Questions assessing orientation to time, place, and     Error points                       24
                              person and recall of recent events
 Token Test                 Measure of auditory comprehension (subject              No. correct                        37
                              follows commands using colored tokens)
 Logical memory             Immediate and 30-min delayed recall of stories          No. of story elements              5th percentile for age
   immediate/delayed          presented auditorially                                  recalled
 Digit span, forward and    Repetition of digit strings in forward/reverse order;   Based on no. of digits             5th percentile for age
   backward                   measure of attention/concentration and                  repeated
                              immediate recall
 Grooved Pegboard           Motor speed, fine coordination; subject places 25        Time (s)                           89
                              pegs in board with dominant hand
 Benton Visual              Perceptual matching using multiple-choice stimuli       No. correct                        25
   Discrimination Test
 Controlled Oral Word       Verbal fluency/generativity; subject generates words     No. of words (corrected            23
   Association Test           beginning with specific letters in 1-min trials          for age, education)
 Rey Auditory Verbal        Word list learning: 15 words 5 trials                   Total no. of words                 37
   Learning Test                                                                      recalled
 Symbol Digit               Visual scanning under timed conditions; subject         No. correct responses              36 written,     40 oral
   Modalities Test,           matches symbols to numbers using written and            within time limit
   written/oral               oral responses, respectively
 TMT-A, TMT-B               Visuomotor sequencing; subject connects numbers         Time (s)                           10th percentile for age
                              in order (Part A), then alternates numbers and
                              letters, requiring set-shifting (Part B)
 Block design               Visual construction; subject arranges 3-dimensional     No. correct/points for             4
                              blocks to match designs within time limits             speed (corrected for
                                                                                     age)
 WCST                       Reasoning/concept formation, set-shifting; subject      No. of perseverative               5th percentile for age,
                              deduces principles by which to sort cards via          responses                         education level
                              feedback on performance


was used to set at .003 for the neuropsychologic test score             gression model. The dependent variable or outcome variable,
analyses (ie, .05/16 tests .003).                                       supervision level, was dichotomized as either independent
   In the next analysis, we examined the relative contribution of       (SRS levels 1–2) or supervised (SRS levels 3–13). The demo-
neuropsychologic test performance while controlling for the             graphic variables (age, education) were entered first, followed
effects of demographic and injury variables on level of super-          by the injury severity variables (length of PTA, LOC). Nine of
vision. For this analysis we used a generalized linear modeling         the 16 neuropsychologic test scores were entered last as a
approach in which we initially fitted a sequential logistic re-          group. The scores selected were 4 measures of memory (digits


                         Table 2: Distribution of Ratings on Supervision Rating Scale in Overall Sample (N 563)

                                             SRS Level*                                                        n                         %

        1: Lives alone or with nonresponsible others (eg, children)                                           294                      52.2
        2: Lives with others who could be responsible, but is unsupervised                                     93                      16.5
        3: Supervised overnight, not during day                                                                32                       5.7
        4: Supervised overnight and part-time during day, may go on independent outings                        40                       7.1
        5: Supervised overnight, part-time during day, unsupervised during full-time work                      11                       2.0
         hours
        6: Supervised overnight, part-time during day, caregivers absent 1h at a time, but                    35                         6.2
         less than time needed to work full-time
        7: Supervised overnight and during most of day; left alone 1h at a time                               18                         3.2
        8: Full-time indirect supervision; someone always present, checks on patient once                     19                         3.4
         every 30min or less often
        9: Same as 8, with overnight safety precautions such as lock on front door                             4                         0.7
       10: Full-time direct supervision; someone always present, checks on patient more than                  12                         2.1
         once per 30min
       11: Lives in setting in which exits are physically controlled (eg, locked unit)                             5                     0.9
       12: Same as 11, plus line-of-sight supervision (eg, escape watch)                                           0                     0
       13: Patient in physical restraints                                                                          0                     0

*Defined by Boake.26


Arch Phys Med Rehabil Vol 84, February 2003
NEUROPSYCHOLOGIC FUNCTION AND SUPERVISION, Hart                                            225

forward and backward, Rey Auditory Verbal Learning Test              Characteristics of Physically Independent Persons by
[RAVLT] total, logical memory– delayed score), 3 measures of         Supervision Level
executive function (TMT-B, Controlled Oral Word Association
                                                                        Demographic and injury characteristics of the physically
Test [COWAT], WCST perseverative responses), and 2 scores
                                                                     independent subsample sorted by the 3 supervision groups
expected to vary by overall severity of deficit rather than
                                                                     (independent, moderate, heavy supervision) are in table 3. The
specific neuropsychologic impairment (TMT-A, Digit Symbol
                                                                     groups did not differ significantly by age or gender. Three other
Modalities Test–Oral administration).
                                                                     demographic variables, which are themselves interrelated
   We then investigated whether the logit link function used in
                                                                     (race, education, productivity status prior to injury), showed
logistic regression was appropriate for our data. The logit link
                                                                     significant overall differences by supervision level. Post hoc
is often compared with the complementary log-log link. The
                                                                     chi-square tests showed that members of ethnic minorities,
expected value of the response variable is modeled as a linear
                                                                     persons not productively employed before injury, and persons
combination of the predictor variables by way of a link func-
                                                                     with less than a high school education were disproportionately
tion. The logit link is (ln[p/(1 p)]), whereas the complemen-
                                                                     represented in the supervised groups.
tary log-log link function is (ln[ ln(1 )]). The complemen-
                                                                        With respect to injury characteristics, neither etiology nor
tary log-log function is asymmetrically sigmoidal with the
                                                                     admission GCS score varied systematically by supervision
upper part of the sigmoid being more elongated in comparison
                                                                     level. Duration of unconsciousness was significantly shorter for
to the symmetric logit function. We used Stata,a version 7.0,33
                                                                     the independent group than for each of the 2 supervised groups
to develop our generalized linear models.
                                                                     (all P .0001, Mann-Whitney tests). Duration of PTA was
                           RESULTS                                   significantly longer for the moderate group compared with the
                                                                     independent group (P .001, Mann-Whitney).
Characteristics of the Sample
   Descriptive demographic and injury characteristics were cal-      Neuropsychologic Characteristics by Supervision Level
culated for the whole sample of 563 participants. The sample            The neuropsychologic test scores were analyzed by super-
was predominantly male (72%) with a mean age           standard      vision level in 2 ways. Scores on each test were compared
deviation (SD) of 36.8 16.0 (range, 16 – 89y). Whites com-           across the 3 groups by using Kruskal-Wallis tests. In addition,
prised 66% of the sample and African Americans 24%. A little         for each group, the proportion of scores falling into the im-
less than one third (28%) had less than a high school education      paired range was calculated and the groups compared by chi-
and another third (31%) had a high school diploma or General         square tests. Impaired performance was defined as scores fall-
Educational Development (GED). About half (48%) were sin-            ing at or worse than the 5th percentile according to available
gle, and 64% were competitively employed before injury.              normative data, or according to other criteria for scores within
These demographic characteristics are typical of samples of          the “abnormal range.” These scores were derived from pub-
persons with moderate to severe TBI. In terms of injury char-        lished test manuals and, in a few cases, adopted from previous
acteristics, the overall mean GCS score on admission to emer-        work performing similar analyses on the same tests.34 For tests
gency care was 9.0 4.3 (range, 3–15), mean LOC was                   sensitive to age and education, criteria were adjusted by those
8.1 15.9 days (range, 0 –220), and mean length of PTA was            factors. The scores used to determine impairment on each test
29.8 25.7 days (range, 0 –234). These values confirm the              are in table 1.
predominance of moderate to severe TBI in the sample. The               Results of both types of analyses, along with summary
majority of cases were caused by vehicular crashes (68%).            statistics for each group, are in table 4. All measures showed an
Falls accounted for an additional 16% and violence-related           average pattern of worse performance as intensity of supervi-
injury for 15%.                                                      sion increased (ie, worst performance in the heavy supervision
   At 1-year follow-up, as is also typical in moderate and           group, best performance in the independent group). For all tests
severe TBI, an even smaller proportion of the participants           except for the Benton Visual Discrimination Test (BVDT;
reported being competitively employed (29%). The majority            performance on which appeared to be near ceiling for all
(83%) were living with relatives or significant others, and 13%       groups), overall Kruskal-Wallis test results were significant at
reported living alone.                                               P less than .001. Post hoc tests (Mann-Whitney U) indicated
                                                                     that all tests showing significant differences discriminated the
Distribution of SRS Scores                                           independent group from 1 or both of the supervision groups.
   The distribution of cases in the 13 original SRS levels over      Only the COWAT differed significantly between the moderate
the entire sample of 563 participants is in table 2. Slightly over   and heavy supervision groups. Perseverative errors on the
half the participants were rated as independent (level 1) at 1       WCST showed a trend toward significance between the 2
year postinjury. Another 16.5% were rated at level 2, which is       supervision groups (P .006).
also an independent level because the only difference from              Results of the chi-square analyses, comparing the percentage
level 1 is that the patient lives with someone who could be          of persons within the impaired range on each test across
responsible if supervision were needed. Thus, about 69% of           groups, essentially agreed with the Kruskal-Wallis tests (see
this sample were rated as unsupervised.                              table 4). Again, results were significant for all tests except the
   Of the higher scores indicating that some supervision was         BVDT, with the independent group differing from 1 or both
received, several values were infrequently used relative to their    supervision groups in all post hoc analyses. However, the
neighboring values (eg, levels 5, 9). No participants in this        percentage of impaired in the moderate versus heavy supervi-
sample received either of the 2 highest scores (12, 13).             sion groups differed significantly only on the backward digit
   As expected, physical and self-care functioning was signif-       span measure.
icantly related to level of supervision. SRS score correlated           Participants in the 3 groups also differed from each other in
negatively with total motor score on the FIM (Spearman               terms of the number of tests on which they scored within the
      .45, P .00001). The remainder of the analyses focused          impaired range. On average, participants in the independent
on the subsample of 452 participants with no scores on motor         group scored in the impaired range on 14% of the tests they
FIM items less than 6.                                               completed (about 2/16 tests, for those completing the entire

                                                                                         Arch Phys Med Rehabil Vol 84, February 2003
226                                   NEUROPSYCHOLOGIC FUNCTION AND SUPERVISION, Hart


              Table 3: Demographic and Injury Characteristics of Physically Independent Participants by Supervision Level

                                                                     Moderate                  Heavy
                                            Independent             Supervision              Supervision              Overall Group
                                             (n 359) (%)            (n 57) (%)               (n 36) (%)               Comparisons

   Age (y)
     Mean SD                                 35.0 14.5              34.7 16.2                36.6 19.7                      NS
     Range                                    16–86                  16–78                    16–89
   Gender
     Male                                     259 (80)               39 (12)                   25 (8)                       NS
     Female                                   100 (76)               18 (14)                   11 (9)
   Race
                                                                                                                  2
     White                                    262 (84)               31 (10)                    20 (6)                11.4, P .005
     Ethnic minority                           97 (70)               26 (19)                   16 (12)
   Education
                                                                                                                  2
       High school                             82 (69)               21 (18)                   15 (13)                13.7, P .005
     High school or GED                       116 (81)               14 (10)                   14 (10)
       High school                            158 (84)               22 (12)                    7 (4)
   Productivity status
                                                                                                                  2
     Productive*                              296 (82)               40 (11)                    26 (7)                6.2, P .05
     Nonproductive                             63 (70)               17 (19)                   10 (11)
   Etiology
     Vehicular                                247 (80)               37 (12)                   23 (7)                       NS
     Violence-related                          46 (72)               11 (17)                   7 (11)
     Falls/other                               66 (81)                9 (11)                    6 (7)
   GCS score (emergency admission)
        (n 436)
     Mean SD                                  9.3 4.2                8.9 4.4                  8.4 4.2                       NS
     Range                                      3–15                   3–15                     3–15
   LOC, d (n 542)
     Mean SD                                  4.9 8.8               10.5 11.4                11.7 15.6           KW 28.0, P .00001
     Range                                      0–63                   0–38                     0–64
   Duration of PTA, d (n 416)
     Mean SD                                 24.6 19.3              37.1 25.7                32.7 22.7           KW 13.4, P .001
     Range                                      0–144                  5–102                    0–94

Abbreviations: NS, not significant; KW, Kruskal-Wallis.
* Includes full-time workers, full-time students, and homemakers.


battery). Those in the moderate supervision group were im-                 Table 5 presents summary information for the sequential
paired on a mean 27% of completed tests (about 4/16) and                cloglog model. A total of 281 subject records contributed to
those in the heavy supervision group were impaired on a mean            this analysis by virtue of having complete data sets. Age and
44% (7 tests). These proportions differed between all pairs of          education were entered first with education reliably predicting
groups at P less than .01 (Kruskal-Wallis tests).                       level of supervision. Length of PTA and length of LOC were
                                                                        entered next, but neither made statistically significant contri-
Sequential Binomial Regression Models                                   butions. The neuropsychologic tests were entered last as a
   As noted above, supervision was dichotomized for this anal-          group. Only 2 of the 9 tests, digits backward and TMT-B, were
ysis, with participants rated independent (SRS levels 1–2),             reliable predictors of supervision level. It was interesting to
coded as 1, and the supervised participants (SRS levels 3–13),          note that the sign of the coefficient of digits backward was
coded as 0, in our regression models. Because most participants         opposite to what would be predicted on the basis of both
were independent, our dependent variable contained signifi-              clinical expectation and its point biserial correlation with the
cantly more 1’s than 0’s. On the basis of this distribution, we         ordinal dependent variable, SRS. That is, we would expect that
expected that a complementary log-log model (cloglog) would             higher scores on digits backward would be associated with an
fit our data better than a standard logistic regression model. In        increased likelihood of independent functioning. Indeed, its
fact, the cloglog had a lower deviance statistic (192.24) than          correlation with SRS was rb equal to .15 (P .002). This pattern
the logit link (197.68). Furthermore, the difference between the        of findings suggests that digits backward may be a negative or
models’ Bayesian information criterion statistics (5.45) pro-           net suppressor variable.35 A suppressor variable enhances the
vided positive evidence for selecting the cloglog model. The            importance of other predictor variables by suppressing variance
remaining analyses involved the cloglog model. Substantial              that is irrelevant in the prediction of the outcome variable,
multicolinearity among the predictor variables was ruled out by         rather than contributing variance in its own right.
calculating the variance inflation factor (VIF) for each; the VIF           In terms of evaluating the overall model, receiver operating
provides an index of the strength of the relationship between           characteristic (ROC) curve analysis revealed that this model
each predictor variable and all other predictors remaining in the       had excellent discrimination (area under the curve .83; fig 1).
equation. The mean VIF for this set of predictors was 1.71, and         Overall correct classification was 85%. The prevalence of
the highest VIF for an individual variable was 2.38; all VIFs           supervision in this sample of persons with TBI was relatively
were well below 20.                                                     low. Deriving models to predict low prevalence events is

Arch Phys Med Rehabil Vol 84, February 2003
Table 4: Neuropsychologic Test Results by Supervision Level

                                                               Moderate           Heavy Supervision
                                  Independent (Level 1)   Supervision (Level 2)       (Level 3)                 Group Differences
              Test                      (n 359)                 (n 57)                 (n 36)                      (at P .003)

  GOAT
    Median                                1.0                     5.0                   7.0           1 vs 2         1 vs 3
    Mean SD                            4.5 7.6                 10.0 15.3             17.7 21.5
    % impaired                           1.7                      9.1                  31.4           1 vs 2         1 vs 3
  Token Test
    Median                               44.0                    43.0                  40.0
    Mean SD                           41.9 4.3                 40.9 4.4              35.7 10.0                       1 vs 3
    % impaired                            8.1                    17.0                  42.4                          1 vs 3
  Logical memory, immediate
    Median                               22.0                    17.5                  16.0           1 vs 2         1 vs 3
    Mean SD                           22.1 8.2                 18.6 9.3              15.4 9.4
    % impaired                           13.5                    27.8                  48.5                          1 vs 3
  Logical memory, delayed
    Median                               18.0                    12.5                   9.0           1 vs 2         1 vs 3
    Mean SD                           17.9 8.7                 13.6 10.8             10.8 9.0
    % impaired                           11.6                    31.5                  40.6           1 vs 2         1 vs 3
  Digit span, forward
    Median                                 8.0                    7.0                    6.0          1 vs 2*        1 vs 3
    Mean SD                            8.2 2.3                  7.3 2.3                6.4 2.4
    % impaired                           10.9                    19.6                   31.4                         1 vs 3
  Digit span, backward
    Median                                6.0                     5.5                    4.0                         1 vs 3
    Mean SD                            6.2 2.3                  5.8 2.3                4.6 2.4
    % impaired                            9.1                     8.9                   34.3                         1 vs 3         2 vs 3
  Grooved Pegboard
    Median                               78.0                    82.0                 100.0                          1 vs 3
    Mean SD                           87.0 34.8                92.7 38.1            117.7 63.7
    % impaired                           29.1                    38.2                  64.7                          1 vs 3
  BVDT
    Median                               30.0                    30.0                  28.0                           NS
    Mean SD                           29.3 3.2                 29.1 3.7              27.4 3.6
    % impaired                           12.6                    10.9                  17.6                           NS
  COWAT
    Median                               34.0                    27.0                  23.5           1 vs 2         1 vs 3         2 vs 3
    Mean SD                           33.8 10.8                28.9 10.1             22.1 9.0
    % impaired                           16.2                    30.2                  50.0                          1 vs 3
  RAVLT
    Median                               45.0                    38.0                  30.5
    Mean SD                           44.3 11.5                36.8 14.4             30.2 11.6        1 vs 2         1 vs 3
    % impaired                           29.5                    48.1                  71.9           1 vs 2*        1 vs 3
  SDMT, written
    Median                               46.0                    35.0                  29.5
    Mean SD                           44.5 13.3                35.5 12.1             30.8 12.4        1 vs 2         1 vs 3
    % impaired                           25.5                    52.7                  51.9            1 vs 2        1 vs 3
  SDMT, oral
    Median                               50.0                    40.0                  33.5
    Mean SD                           51.4 14.8                41.1 15.2             36.3 15.3        1 vs 2         1 vs 3
    % impaired                           20.1                    45.4                  62.5            1 vs 2        1 vs 3
  TMT-A
    Median                               29.0                    38.0                  43.0
    Mean SD                           34.6 20.4                50.5 35.4             63.0 56.6        1 vs 2         1 vs 3
    % impaired                            6.3                    20.0                  28.1            1 vs 2        1 vs 3
  TMT-B
    Median                               69.0                    95.5                 141.0           1 vs 2         1 vs 3
    Mean SD                           82.3 48.8               120.7 71.5            159.4 92.0
    % impaired                            6.5                    17.3                  37.9                          1 vs 3
  Block design
    Median                               10.0                     8.0                    7.0
    Mean SD                           10.1 2.9                  8.6 3.3                7.4 3.1        1 vs 2         1 vs 3
    % impaired                            2.0                     5.8                   14.7                         1 vs 3
  WCST
    Median                               10.0                    21.0                  42.0                          1 vs 3         2 vs 3*
    Mean SD                           19.0 19.6                26.2 23.2             40.9 24.2
    % impaired                           16.9                    24.5                  51.9                          1 vs 3

Abbreviation: SDMT, Symbol Digit Modalities Test.
* Trend, at P .006
228                                    NEUROPSYCHOLOGIC FUNCTION AND SUPERVISION, Hart


                    Table 5: Summary of Complementary Log-Log Regression Analysis Predicting Level of Supervision

              Predictor                  Coefficient          SE            z            P z                     95% CI

      Age                                   .003             .009        0.31            .758              .014             .019
      Education                             .222             .103        2.15            .032              .019             .424
      PTA                                   .006             .006        1.06            .289              .017             .005
      LOC                                   .001             .012        0.011           .916              .023             .026
      Digit span, forward                   .031             .058        0.53            .596              .083             .145
      Digit span, backward                  .107             .052        2.05            .040              .209             .005
      TMT-A                                 .012             .008        1.64            .100              .027             .002
      TMT-B                                 .006             .003        2.14            .032              .012             .001
      COWAT                                 .015             .011        0.033           .184              .007             .038
      RAVLT                                 .010             .011        0.92            .358              .012             .032
      SDMT oral                             .000             .010        0.02            .983              .019             .020
      WCST                                  .001             .005        0.27            .789              .012             .009
      Logical memory delayed                .010             .011        0.90            .370              .012             .033
      Constant                              .505             .890        0.57            .570             1.239            2.249

Abbreviations: SE, standard error; CI, confidence interval.


challenging because one tends to predict more accurately in the     found to be at ceiling on the SRS in the study of Hall et al,27
long run by simply using base rates, that is, predicting the most   which obtained ratings on 48 subjects between 2 and 9 years
commonly occurring event. Hence, our model had high sensi-          after TBI. Although these findings might be interpreted as
tivity (96%) and low specificity (30%) with respect to receipt       indicating good outcome for groups of individuals with mod-
of supervision. In other words, in samples such as this in which    erate to severe TBI, we must note that, as a measure of
independence is a more common outcome than supervision,             community outcome after TBI, the SRS appears to be prone to
statistical models such as the model under study may be most        ceiling effects. Furthermore, in the present sample, the ordinal
useful in ruling out patients who will be independent (ie,          structure of the original scale was not completely retained. That
specifying who will be supervised) as opposed to ruling in who      is, we did not find progressively fewer participants in each
will be independent.                                                defined category of more intensive supervision. Further re-
                                                                    search may be needed to determine whether the descriptors for
                         DISCUSSION                                 different levels of this scale represent meaningful increments of
   In this sample of persons with moderate and severe TBI who       caregiver burden with regard to supervision or whether other
were prospectively followed and who received follow-up neu-         aspects of this construct should be emphasized instead.
ropsychologic evaluation within the TBIMS longitudinal                 The observed relationships between supervision level in
project, we found 69% to be rated as independent of supervi-        postacute stages of recovery and demographic factors predating
sion at 1 year postinjury. This value is quite close to the 71%     injury (education, race, productivity status) have not been
                                                                    reported previously, although premorbid factors are increas-
                                                                    ingly recognized as important in TBI outcome prediction.36,37
                                                                    In the logistic regression analysis reported here, education was
                                                                    a stronger predictor than the majority of neuropsychologic
                                                                    measures. Level of education may be a proxy variable for
                                                                    general intellectual capacity, which may be called on as a
                                                                    “reserve” after TBI or other insult to the central nervous
                                                                    system. It is possible that persons with higher level of educa-
                                                                    tion have better preinjury executive and organizational abili-
                                                                    ties, thus a stronger capacity for independent function in com-
                                                                    munity settings and/or more capacity for developing
                                                                    compensatory strategies after injury. With respect to the dis-
                                                                    crepancy between white participants and members of ethnic
                                                                    minorities, supervision may simply be more available in some
                                                                    American subcultures that emphasize participation of extended
                                                                    family members in caring for ill or disabled persons. On the
                                                                    other hand, members of minority groups have been reported to
                                                                    experience less favorable outcomes from TBI compared with
                                                                    whites.38 A higher proportion of persons supervised at 1 year
                                                                    postinjury might be another reflection of that outcome discrep-
                                                                    ancy. We also found preinjury productivity status to be related
                                                                    to postinjury supervision, albeit not as strongly as education or
                                                                    race. One limitation of the current study is that we did not have
                                                                    any measure of need for assistance (or supervision) prior to
                                                                    injury. Thus, it is possible that at least some persons who were
                                                                    nonproductive at the time of injury were already in need of
                                                                    assistance from family members. New variables on preinjury
  Fig 1. ROC curve showing the model’s discrimination ability.      status have been added to the TBIMS data collection protocol

Arch Phys Med Rehabil Vol 84, February 2003
NEUROPSYCHOLOGIC FUNCTION AND SUPERVISION, Hart                                                    229

to define better the contribution of premorbid status to outcome      do better with supervision, or whether some rated as supervised
assessment in future research on this population.                    could be seen as overprotected.
   With respect to injury severity variables, the stronger rela-
tionship between the durations of the variables reflecting al-                                  CONCLUSION
tered consciousness compared with the initial GCS was not
surprising because the later in the continuum of care a variable        Both preinjury characteristics and neuropsychologic vari-
is collected, the more likely it is to be associated with outcome    ables are important for understanding supervision received at 1
measures.39 Although unconsciousness and PTA durations did           year after TBI. In persons without physical disability, the
not contribute significantly to the regression model, both were       assessment of cognitive function, particularly executive func-
significantly different for supervised versus unsupervised per-       tion, added to the prediction of supervision level. In the future,
sons in the univariate analysis; independent participants had a      further exploration of the scaling characteristics of the SRS
mean coma about half as long as those who received supervi-          would help ensure that an accurate representation of supervi-
sion.                                                                sion needs is achieved. Further research on the predictors of
   Our hypotheses about neuropsychologic predictors of super-        long-term supervision requirements from the acute hospital or
vision status were only partially supported. In the univariate       rehabilitation phases of recovery would help families and pro-
analyses, nearly all neuropsychologic measures differentiated        viders plan and budget for needed resources. Additional re-
supervised from nonsupervised persons; we did not find spec-          search is needed to clarify the contribution of cultural, social,
ificity for measures of memory or executive function. How-            and financial factors that were not addressed in the present
ever, only a few measures (digit span backward, COWAT,               investigation.
WCST) differentiated between persons receiving moderate ver-
sus heavy supervision. These measures have in common that              Acknowledgments: We thank members of the TBIMS Neuropsy-
they place demands on mental flexibility and working memory,          chology Committee for helpful comments and suggestions during the
important aspects of executive function. In the logistic regres-     design of this project.
sion model, which included measures of injury severity and
demographic status and controlled for shared variance among                                         References
predictor variables, only digit span backward and the TMT-B           1. Thurman D, Alverson C, Dunn K, Guerrero J, Sniezek J. Trau-
emerged as significant neuropsychologic predictors of super-              matic brain injury in the United States: a public health perspective.
vision status; only the TMT-B was straightforwardly predictive           J Head Trauma Rehabil 1999;14:602-15.
of supervision, however, with digits backward acting as a             2. Sander A, Kreutzer J. A holistic approach to family assessment
suppressor variable. Like the COWAT, the TMT-B requires                  after brain injury. In: Rosenthal M, editor. Rehabilitation of the
flexibility and set-shifting in addition to cognitive speed; it has       adult and child with traumatic brain injury. Philadelphia: FA
been shown to correlate strongly with functional outcome in              Davis; 1999. p 199-216.
previous studies.15,17,18                                             3. Ben-Yishay Y, Silver S, Piasetsky E, Rattok J. Relationship be-
   In the present study, memory measures did not provide                 tween employability and vocational outcome after intensive ho-
                                                                         listic cognitive rehabilitation. J Head Trauma Rehabil 1987;2(1):
incremental prediction of supervision level, despite their asso-         35-48.
ciation with functional outcomes in previous research.17 Mem-         4. Marsh N, Kersel D, Havill J, Sleigh J. Caregiver burden at 6
ory abilities may be less crucial to independent functioning in          months following severe traumatic brain injury. Brain Inj 1998;
a familiar home setting, compared with the executive functions           12:225-38.
of mental flexibility and generativity that are required to plan       5. Marsh N, Kersel D, Havill J, Sleigh J. Caregiver burden at 1 year
and execute actions and to adapt to unexpected changes in the            following severe traumatic brain injury. Brain Inj 1998;12:1045-
environment. It may be this flexibility and adaptiveness, rather          59.
than the ability to learn and recall novel information, that          6. Wallace C, Bogner J, Corrigan J, Clinchot D, Mysiw W, Fugate L.
allows a person to function in a familiar setting without super-         Primary caregivers of persons with brain injury: life change 1 year
                                                                         after injury. Brain Inj 1998;12:483-93.
vision. Although studies comparing the contribution of specific        7. Hawkins M, Lewis F, Mederios R. Serious traumatic brain injury:
neuropsychologic skills to functional outcomes are lacking in            an evaluation of functional outcomes. J Trauma 1996;41:257-63;
TBI, several studies in geriatric populations suggest that exec-         discussion 263-4.
utive skills and visuospatial functions are more predictive of        8. Granger C, Divan N, Fiedler R. Functional assessment scales: a
ability in instrumental activities of daily living than are verbal       study of persons after traumatic brain injury. Am J Phys Rehabil
skills, including verbal memory.40,41                                    1995;74:107-13.
   There are several limitations to the present investigation,        9. Corrigan J, Smith-Knapp K, Granger C. Outcomes in the first 5
aside from those mentioned earlier. First, only subjects were            years after traumatic brain injury. Arch Phys Med Rehabil 1998;
included who attended follow-up sessions in person and un-               79:298-305.
                                                                     10. Knight R, Devereux R, Godfrey H. Caring for a family member
derwent at least part of a battery of neuropsychologic tests.            with a traumatic brain injury. Brain Inj 1998;12:467-81.
Relationships between cognitive function and supervision level       11. Smith A, Schwirian P. The relationship between caregiver burden
may differ in subjects who are unable or unwilling to attend             and TBI survivors’ cognition and functional ability after dis-
follow-ups, either because their overall level of impairment is          charge. Rehabil Nurs 1998;23:252-7.
too severe or because they are lost to follow-up for unknown         12. Mazaux J, Masson F, Levin H, Alaoui P, Maurette P, Barat M.
reasons. Several investigations37,42 have demonstrated sources           Long-term neuropsychological outcome and loss of social auton-
of bias in longitudinal samples, including the TBIMS sample.             omy after traumatic brain injury. Arch Phys Med Rehabil 1997;
Second, this study used only 1 measure of supervision (the               78:1316-20.
SRS), and thus its conclusions are limited by any limitations of     13. Hamilton B, Granger C, Sherwin F, Zielezny M, Tashman J. A
                                                                         uniform national data system for medical rehabilitation. In:
that instrument. In particular, the SRS rating is based on the           Fuhrer, editor. Rehabilitation outcomes: analysis and measure-
supervision actually received by a person, rather than supervi-          ment. Baltimore: Brooks; 1987. p 137-47.
sion he/she may need. In the current sample, we have no way          14. Neese L, Caroselli J, Klaas P, High WM Jr, Becker L, Scheibel R.
to measure needed supervision to know, for example, whether              Neuropsychological assessment and the Disability Rating Scale
some persons rated as independent would actually be judged to            (DRS): a concurrent validity study. Brain Inj 2000;14:719-24.


                                                                                           Arch Phys Med Rehabil Vol 84, February 2003
230                                      NEUROPSYCHOLOGIC FUNCTION AND SUPERVISION, Hart


15. Boake C, Millis SR, High WM Jr, et al. Using early neuropsy-           29. Teasdale G, Jennett B. Assessment of coma and impaired con-
    chologic testing to predict long-term productivity outcome from            sciousness: a practical scale. Lancet 1974:2(7872):81-3.
    traumatic brain injury. Arch Phys Med Rehabil 2001;82:761-8.           30. Levin H, O’Donnell V, Grossman R. The Galveston Orientation
16. Sherer M, Sander AA, Nick TG, High WM Jr, Malec JF,                        and Amnesia Test: a practical scale to assess cognition after head
    Rosenthal M. Early cognitive status and productivity outcome               injury. J Nerv Ment Dis 1979;167:675-84.
    after traumatic brain injury: findings from the TBI Model Sys-          31. Kreutzer J, Gordon W, Rosenthal M, Marwitz J. Neuropsycho-
    tems. Arch Phys Med Rehabil 2002;83:183-200.                               logical characteristics of patients with brain injury: preliminary
17. Ross S, Millis S, Rosenthal M. Neuropsychological prediction of            findings from a multicenter investigation. J Head Trauma Rehabil
    psychosocial outcome after traumatic brain injury. Appl Neuro-             1993;8(2):47-59.
                                                                           32. Heinemann A, Linacre J, Wright B, Hamilton B, Granger C.
    psychol 1997;4:165-70.
                                                                               Relationships between impairment and physical disability as mea-
18. Hanks R, Rapport L, Millis S, Deshpande S. Measures of execu-              sured by the Functional Independence Measure. Arch Phys Med
    tive functioning as predictors of functional ability and social            Rehabil 1993;74:566-73.
    integration in a rehabilitation sample. Arch Phys Med Rehabil          33. Stata Statistical Software. College Station (TX): Stata Corp; 2001.
    1999;80:1030-7.                                                        34. Millis S, Rosenthal M, Novack T, et al. Long-term neuropsycho-
19. Rapport L, Hanks R, Millis S, Deshpande S. Executive function-             logical outcome after traumatic brain injury. J Head Trauma
    ing and predictors of falls in the rehabilitation setting. Arch Phys       Rehabil 2001;16:343-55.
    Med Rehabil 1998;79:629-33.                                            35. Tabachnick B, Fidell L. Using multivariate statistics. Boston:
20. Hart T, Schwartz M, Mayer N. Executive function: some current              Allyn & Bacon; 2001.
    theories and their applications. In: Varney N, Roberts R, editors.     36. Novack T, Bush B, Meythaler J, Canupp K. Outcome after trau-
    The evaluation and treatment of mild traumatic brain injury.               matic brain injury: pathway analysis of contributions from pre-
    Mahwah (NJ): Lawrence Erlbaum Associates; 1999. p 133-48.                  morbid, injury severity, and recovery variables. Arch Phys Med
21. Girard D, Brown J, Burnett-Stolnack M, et al. The relationship of          Rehabil 2001;82:300-5.
    neuropsychological status and productive outcomes following            37. Hall K, Wallborn A, Englander J. Premorbid history and traumatic
    traumatic brain injury. Brain Inj 1996;10:663-76.                          brain injury. NeuroRehabilitation 1998;10(1):3-12.
22. Burgess P, Alderman N, Evans J, Emslie H, Wilson B. The                38. Rosenthal M, Dijkers M, Harrison-Felix C, et al. Impact of mi-
    ecological validity of tests of executive function. J Int Neuropsy-        nority status on functional outcome and community integration
    chol Soc 1998;4:547-58.                                                    following traumatic brain injury. J Head Trauma Rehabil 1996;
                                                                               11(5):40-57.
23. Mazer B, Korner-Bitensky N, Sofer S. Predicting ability to drive
                                                                           39. Whyte J, Cifu D, Dikmen S, Temkin N. Prediction of functional
    after stroke. Arch Phys Med Rehabil 1998;79:743-9.                         outcomes after traumatic brain injury: a comparison of 2 measures
24. Korteling J, Kaptein N. Neuropsychological driving fitness tests            of duration of unconsciousness. Arch Phys Med Rehabil 2001;82:
    for brain-damaged subjects. Arch Phys Med Rehabil 1996;77:138-             1355-9.
    46.                                                                    40. Cahn-Weiner D, Malloy P, Boyle P, Marran M, Salloway S.
25. van Zomeren A, Brouwer W, Rothengatter J, Snock J. Fitness to              Prediction of functional status from neuropsychological tests in
    drive a car after recovery from severe head injury. Arch Phys Med          community-dwelling elderly individuals. Clin Neuropsychol
    Rehabil 1988;69:90-6.                                                      2000;14:187-95.
26. Boake C. Supervision Rating Scale: a measure of functional             41. Carlson M, Fried L, Xue Q, Bandeen-Roche K, Zeger S, Brandt J.
    outcome from brain injury. Arch Phys Med Rehabil 1996;77:765-              Association between executive attention and physical functional
    72.                                                                        performance in community-dwelling older women. J Gerontol B
27. Hall K, Bushnik T, Lakisic-Kazazic B, Wright J, Cantagallo A.              Psychol Sci Soc Sci 1999;54:S262-70.
    Assessing traumatic brain injury outcome measures for long-term        42. Corrigan J, Bogner J, Mysiw J, Clinchot D. Systematic bias in
    follow-up of community-based individuals. Arch Phys Med Re-                outcome studies of persons with traumatic brain injury. Arch Phys
    habil 2001;82:367-74.                                                      Med Rehabil 1997;78:132-7.
28. Dabmer E, Shilling M, Hamilton B, et al. A model systems
    database for traumatic brain injury. J Head Trauma Rehabil 1993;                                   Supplier
    8(2):12-25.                                                            a. Stata Corp, 4905 Lakeway Dr, College Station, TX 77845.


Arch Phys Med Rehabil Vol 84, February 2003

Contenu connexe

Tendances

Dementia And Aggression Psy 492 M7a2 Levea. B
Dementia And Aggression Psy 492 M7a2 Levea. BDementia And Aggression Psy 492 M7a2 Levea. B
Dementia And Aggression Psy 492 M7a2 Levea. Bhannah06
 
Hamiel article on prevention
Hamiel article on preventionHamiel article on prevention
Hamiel article on preventionDr. ARNON ROLNICK
 
Resiliency Program R. Davis U10A1
Resiliency Program R. Davis U10A1Resiliency Program R. Davis U10A1
Resiliency Program R. Davis U10A1Rachel Davis
 
Pediatric physical therapy
Pediatric physical therapyPediatric physical therapy
Pediatric physical therapyphyteh20
 
Complimentarymedicine
ComplimentarymedicineComplimentarymedicine
Complimentarymedicinejenik01jeep
 
Healthcare Quarterly Vol.16 No.1
Healthcare Quarterly Vol.16 No.1Healthcare Quarterly Vol.16 No.1
Healthcare Quarterly Vol.16 No.1Raymond L. Greaves
 
Treatment of Catastrophizing
Treatment of CatastrophizingTreatment of Catastrophizing
Treatment of CatastrophizingPaul Coelho, MD
 
Influential Determinants of Capacity Building to Cope With Stress among Unive...
Influential Determinants of Capacity Building to Cope With Stress among Unive...Influential Determinants of Capacity Building to Cope With Stress among Unive...
Influential Determinants of Capacity Building to Cope With Stress among Unive...iosrjce
 
4 secondary traumatic stress
4 secondary traumatic stress4 secondary traumatic stress
4 secondary traumatic stressSusan Reed
 
Effect of a motivational intervention on exercise behavior in
Effect of a motivational intervention on exercise behavior inEffect of a motivational intervention on exercise behavior in
Effect of a motivational intervention on exercise behavior inThiraporn Panyowat
 
Somatic problems with biofeedback
Somatic problems with biofeedbackSomatic problems with biofeedback
Somatic problems with biofeedbackDr. ARNON ROLNICK
 
Research Sahaja Yoga Meditation and Medicine
Research Sahaja Yoga Meditation and MedicineResearch Sahaja Yoga Meditation and Medicine
Research Sahaja Yoga Meditation and Medicineioana_ip
 
STOPS Back Pain - Graded Activity and Exposure
STOPS Back Pain - Graded Activity and ExposureSTOPS Back Pain - Graded Activity and Exposure
STOPS Back Pain - Graded Activity and ExposureSTOPS Back Pain
 
Dissertation - Somatic Experiencing Treatment for Reduction of Symptoms of De...
Dissertation - Somatic Experiencing Treatment for Reduction of Symptoms of De...Dissertation - Somatic Experiencing Treatment for Reduction of Symptoms of De...
Dissertation - Somatic Experiencing Treatment for Reduction of Symptoms of De...Michael Changaris
 

Tendances (19)

Dementia And Aggression Psy 492 M7a2 Levea. B
Dementia And Aggression Psy 492 M7a2 Levea. BDementia And Aggression Psy 492 M7a2 Levea. B
Dementia And Aggression Psy 492 M7a2 Levea. B
 
Hamiel article on prevention
Hamiel article on preventionHamiel article on prevention
Hamiel article on prevention
 
Resiliency Program R. Davis U10A1
Resiliency Program R. Davis U10A1Resiliency Program R. Davis U10A1
Resiliency Program R. Davis U10A1
 
Pediatric physical therapy
Pediatric physical therapyPediatric physical therapy
Pediatric physical therapy
 
Comp 9
Comp 9Comp 9
Comp 9
 
Complimentarymedicine
ComplimentarymedicineComplimentarymedicine
Complimentarymedicine
 
Healthcare Quarterly Vol.16 No.1
Healthcare Quarterly Vol.16 No.1Healthcare Quarterly Vol.16 No.1
Healthcare Quarterly Vol.16 No.1
 
Treatment of Catastrophizing
Treatment of CatastrophizingTreatment of Catastrophizing
Treatment of Catastrophizing
 
Resilience
ResilienceResilience
Resilience
 
Emotional responses
Emotional responsesEmotional responses
Emotional responses
 
Influential Determinants of Capacity Building to Cope With Stress among Unive...
Influential Determinants of Capacity Building to Cope With Stress among Unive...Influential Determinants of Capacity Building to Cope With Stress among Unive...
Influential Determinants of Capacity Building to Cope With Stress among Unive...
 
Thesis_40093281
Thesis_40093281Thesis_40093281
Thesis_40093281
 
4 secondary traumatic stress
4 secondary traumatic stress4 secondary traumatic stress
4 secondary traumatic stress
 
Effect of a motivational intervention on exercise behavior in
Effect of a motivational intervention on exercise behavior inEffect of a motivational intervention on exercise behavior in
Effect of a motivational intervention on exercise behavior in
 
Somatic problems with biofeedback
Somatic problems with biofeedbackSomatic problems with biofeedback
Somatic problems with biofeedback
 
Research Sahaja Yoga Meditation and Medicine
Research Sahaja Yoga Meditation and MedicineResearch Sahaja Yoga Meditation and Medicine
Research Sahaja Yoga Meditation and Medicine
 
Dale
DaleDale
Dale
 
STOPS Back Pain - Graded Activity and Exposure
STOPS Back Pain - Graded Activity and ExposureSTOPS Back Pain - Graded Activity and Exposure
STOPS Back Pain - Graded Activity and Exposure
 
Dissertation - Somatic Experiencing Treatment for Reduction of Symptoms of De...
Dissertation - Somatic Experiencing Treatment for Reduction of Symptoms of De...Dissertation - Somatic Experiencing Treatment for Reduction of Symptoms of De...
Dissertation - Somatic Experiencing Treatment for Reduction of Symptoms of De...
 

Similaire à Neuropsychologic function and level of caregiver supervision

Interventions to Improve Cognitive Functioning After TBI
Interventions to Improve Cognitive Functioning After TBIInterventions to Improve Cognitive Functioning After TBI
Interventions to Improve Cognitive Functioning After TBILoki Stormbringer
 
1 The Outcomes of Neural Stem Cell Transplantation and .docx
1  The Outcomes of Neural Stem Cell Transplantation and .docx1  The Outcomes of Neural Stem Cell Transplantation and .docx
1 The Outcomes of Neural Stem Cell Transplantation and .docxhoney725342
 
TBIhomeless_FINAL.ppt
TBIhomeless_FINAL.pptTBIhomeless_FINAL.ppt
TBIhomeless_FINAL.pptOgunsina1
 
The Journal of Head Trauma Rehabilitation 2008 Niedzwecki
The Journal of Head Trauma Rehabilitation 2008 NiedzweckiThe Journal of Head Trauma Rehabilitation 2008 Niedzwecki
The Journal of Head Trauma Rehabilitation 2008 NiedzweckiChristian Niedzwecki
 
Hardt Literature Review
Hardt Literature ReviewHardt Literature Review
Hardt Literature ReviewGabriel Hardt
 
Neuroimmune responses in the developing brain following traumatic brain injur...
Neuroimmune responses in the developing brain following traumatic brain injur...Neuroimmune responses in the developing brain following traumatic brain injur...
Neuroimmune responses in the developing brain following traumatic brain injur...Adventist University of the Philippines
 
CLINICAL SCHOLARSHIP Illness.docx
CLINICAL SCHOLARSHIP Illness.docxCLINICAL SCHOLARSHIP Illness.docx
CLINICAL SCHOLARSHIP Illness.docxstudywriters
 
Biglan et al the critical role of nurturing environments for promoting human ...
Biglan et al the critical role of nurturing environments for promoting human ...Biglan et al the critical role of nurturing environments for promoting human ...
Biglan et al the critical role of nurturing environments for promoting human ...Dennis Embry
 
Me, Myself and Trauma: But What Does it Mean For My Health? by Soraya Matthews
Me, Myself and Trauma: But What Does it Mean For My Health? by Soraya MatthewsMe, Myself and Trauma: But What Does it Mean For My Health? by Soraya Matthews
Me, Myself and Trauma: But What Does it Mean For My Health? by Soraya MatthewsPsychological Society of Ireland
 
NURS 4435 TUTA Critically Read and Critique Nursing Research Articles.docx
NURS 4435 TUTA Critically Read and Critique Nursing Research Articles.docxNURS 4435 TUTA Critically Read and Critique Nursing Research Articles.docx
NURS 4435 TUTA Critically Read and Critique Nursing Research Articles.docxstirlingvwriters
 
Quality Of Life, Spirituality and Social Support among Caregivers of Cancer P...
Quality Of Life, Spirituality and Social Support among Caregivers of Cancer P...Quality Of Life, Spirituality and Social Support among Caregivers of Cancer P...
Quality Of Life, Spirituality and Social Support among Caregivers of Cancer P...iosrjce
 
Temperament, Childhood Illness Burden, and Illness Behavior in.docx
Temperament, Childhood Illness Burden, and Illness Behavior in.docxTemperament, Childhood Illness Burden, and Illness Behavior in.docx
Temperament, Childhood Illness Burden, and Illness Behavior in.docxmanningchassidy
 
Temperament, Childhood Illness Burden, and Illness Behavior in.docx
Temperament, Childhood Illness Burden, and Illness Behavior in.docxTemperament, Childhood Illness Burden, and Illness Behavior in.docx
Temperament, Childhood Illness Burden, and Illness Behavior in.docxbradburgess22840
 
Stress and adaptation
Stress and adaptationStress and adaptation
Stress and adaptationJyoti Gaver
 
Holistic Healing TBI study
Holistic Healing TBI studyHolistic Healing TBI study
Holistic Healing TBI studyBriana Boykin
 
Resilience in physicians Texas Medical Association Wooten 2.24.2018
Resilience in physicians Texas Medical Association Wooten 2.24.2018Resilience in physicians Texas Medical Association Wooten 2.24.2018
Resilience in physicians Texas Medical Association Wooten 2.24.2018Bill Wooten
 
Resilience in physicians final tma wooten 2.24.2018
Resilience in physicians final tma wooten 2.24.2018Resilience in physicians final tma wooten 2.24.2018
Resilience in physicians final tma wooten 2.24.2018Bill M Wooten, PhD
 

Similaire à Neuropsychologic function and level of caregiver supervision (20)

Interventions to Improve Cognitive Functioning After TBI
Interventions to Improve Cognitive Functioning After TBIInterventions to Improve Cognitive Functioning After TBI
Interventions to Improve Cognitive Functioning After TBI
 
1 The Outcomes of Neural Stem Cell Transplantation and .docx
1  The Outcomes of Neural Stem Cell Transplantation and .docx1  The Outcomes of Neural Stem Cell Transplantation and .docx
1 The Outcomes of Neural Stem Cell Transplantation and .docx
 
TBIhomeless_FINAL.ppt
TBIhomeless_FINAL.pptTBIhomeless_FINAL.ppt
TBIhomeless_FINAL.ppt
 
Tb ihomeless final
Tb ihomeless finalTb ihomeless final
Tb ihomeless final
 
The Journal of Head Trauma Rehabilitation 2008 Niedzwecki
The Journal of Head Trauma Rehabilitation 2008 NiedzweckiThe Journal of Head Trauma Rehabilitation 2008 Niedzwecki
The Journal of Head Trauma Rehabilitation 2008 Niedzwecki
 
TBI and Family Dynamics
TBI and Family DynamicsTBI and Family Dynamics
TBI and Family Dynamics
 
Hardt Literature Review
Hardt Literature ReviewHardt Literature Review
Hardt Literature Review
 
Neuroimmune responses in the developing brain following traumatic brain injur...
Neuroimmune responses in the developing brain following traumatic brain injur...Neuroimmune responses in the developing brain following traumatic brain injur...
Neuroimmune responses in the developing brain following traumatic brain injur...
 
CLINICAL SCHOLARSHIP Illness.docx
CLINICAL SCHOLARSHIP Illness.docxCLINICAL SCHOLARSHIP Illness.docx
CLINICAL SCHOLARSHIP Illness.docx
 
Biglan et al the critical role of nurturing environments for promoting human ...
Biglan et al the critical role of nurturing environments for promoting human ...Biglan et al the critical role of nurturing environments for promoting human ...
Biglan et al the critical role of nurturing environments for promoting human ...
 
Me, Myself and Trauma: But What Does it Mean For My Health? by Soraya Matthews
Me, Myself and Trauma: But What Does it Mean For My Health? by Soraya MatthewsMe, Myself and Trauma: But What Does it Mean For My Health? by Soraya Matthews
Me, Myself and Trauma: But What Does it Mean For My Health? by Soraya Matthews
 
NURS 4435 TUTA Critically Read and Critique Nursing Research Articles.docx
NURS 4435 TUTA Critically Read and Critique Nursing Research Articles.docxNURS 4435 TUTA Critically Read and Critique Nursing Research Articles.docx
NURS 4435 TUTA Critically Read and Critique Nursing Research Articles.docx
 
B010611115
B010611115B010611115
B010611115
 
Quality Of Life, Spirituality and Social Support among Caregivers of Cancer P...
Quality Of Life, Spirituality and Social Support among Caregivers of Cancer P...Quality Of Life, Spirituality and Social Support among Caregivers of Cancer P...
Quality Of Life, Spirituality and Social Support among Caregivers of Cancer P...
 
Temperament, Childhood Illness Burden, and Illness Behavior in.docx
Temperament, Childhood Illness Burden, and Illness Behavior in.docxTemperament, Childhood Illness Burden, and Illness Behavior in.docx
Temperament, Childhood Illness Burden, and Illness Behavior in.docx
 
Temperament, Childhood Illness Burden, and Illness Behavior in.docx
Temperament, Childhood Illness Burden, and Illness Behavior in.docxTemperament, Childhood Illness Burden, and Illness Behavior in.docx
Temperament, Childhood Illness Burden, and Illness Behavior in.docx
 
Stress and adaptation
Stress and adaptationStress and adaptation
Stress and adaptation
 
Holistic Healing TBI study
Holistic Healing TBI studyHolistic Healing TBI study
Holistic Healing TBI study
 
Resilience in physicians Texas Medical Association Wooten 2.24.2018
Resilience in physicians Texas Medical Association Wooten 2.24.2018Resilience in physicians Texas Medical Association Wooten 2.24.2018
Resilience in physicians Texas Medical Association Wooten 2.24.2018
 
Resilience in physicians final tma wooten 2.24.2018
Resilience in physicians final tma wooten 2.24.2018Resilience in physicians final tma wooten 2.24.2018
Resilience in physicians final tma wooten 2.24.2018
 

Plus de Connie Dello Buono

Frm 820.90 complaint form cdb 7 9-2013 rev 1
Frm 820.90 complaint form cdb 7 9-2013 rev 1Frm 820.90 complaint form cdb 7 9-2013 rev 1
Frm 820.90 complaint form cdb 7 9-2013 rev 1Connie Dello Buono
 
Excerpts the-magic-of-thinking-big refuse to worry about ur health
Excerpts the-magic-of-thinking-big refuse to worry about ur healthExcerpts the-magic-of-thinking-big refuse to worry about ur health
Excerpts the-magic-of-thinking-big refuse to worry about ur healthConnie Dello Buono
 
Malunggay, a horseradish tree, as useful as the multivitamin
Malunggay, a horseradish tree, as useful as the multivitaminMalunggay, a horseradish tree, as useful as the multivitamin
Malunggay, a horseradish tree, as useful as the multivitaminConnie Dello Buono
 
MSDS SDS labelling SOP GHS of classification labelling of chem
MSDS SDS labelling SOP GHS of classification labelling of chemMSDS SDS labelling SOP GHS of classification labelling of chem
MSDS SDS labelling SOP GHS of classification labelling of chemConnie Dello Buono
 
Msds form template connie dello buono 2012
Msds form template connie dello buono 2012Msds form template connie dello buono 2012
Msds form template connie dello buono 2012Connie Dello Buono
 
Corrections, Investigations and CAPA Details in Medical Device Setting
Corrections, Investigations and CAPA Details in Medical Device SettingCorrections, Investigations and CAPA Details in Medical Device Setting
Corrections, Investigations and CAPA Details in Medical Device SettingConnie Dello Buono
 
Corrective and preventive action plan CAPA report form
Corrective and preventive action plan  CAPA report formCorrective and preventive action plan  CAPA report form
Corrective and preventive action plan CAPA report formConnie Dello Buono
 
What is quality, Quality Policy and Objectives?
What is  quality, Quality Policy and Objectives?What is  quality, Quality Policy and Objectives?
What is quality, Quality Policy and Objectives?Connie Dello Buono
 
Supplier collaboration in quality improvement programs
Supplier collaboration in quality improvement programsSupplier collaboration in quality improvement programs
Supplier collaboration in quality improvement programsConnie Dello Buono
 
Stop vascular disease risk factors early to prevent alzheimer's disease bayar...
Stop vascular disease risk factors early to prevent alzheimer's disease bayar...Stop vascular disease risk factors early to prevent alzheimer's disease bayar...
Stop vascular disease risk factors early to prevent alzheimer's disease bayar...Connie Dello Buono
 
Living will an advance directive or durable power of attorney healthcare cali...
Living will an advance directive or durable power of attorney healthcare cali...Living will an advance directive or durable power of attorney healthcare cali...
Living will an advance directive or durable power of attorney healthcare cali...Connie Dello Buono
 
Survivor universal life insurance 4088541883 san jose california connie dello...
Survivor universal life insurance 4088541883 san jose california connie dello...Survivor universal life insurance 4088541883 san jose california connie dello...
Survivor universal life insurance 4088541883 san jose california connie dello...Connie Dello Buono
 
Multi choice index single premium life insurance 4088541883 san jose californ...
Multi choice index single premium life insurance 4088541883 san jose californ...Multi choice index single premium life insurance 4088541883 san jose californ...
Multi choice index single premium life insurance 4088541883 san jose californ...Connie Dello Buono
 
Aviva fixed annuity tax deferral growth guarantees
Aviva fixed annuity tax deferral growth guaranteesAviva fixed annuity tax deferral growth guarantees
Aviva fixed annuity tax deferral growth guaranteesConnie Dello Buono
 
Aviva index universal life insurance crediting interest to your cash value
Aviva index universal life insurance crediting interest to your cash valueAviva index universal life insurance crediting interest to your cash value
Aviva index universal life insurance crediting interest to your cash valueConnie Dello Buono
 

Plus de Connie Dello Buono (20)

retire in 5yrs kaizenplan.pdf
retire in 5yrs kaizenplan.pdfretire in 5yrs kaizenplan.pdf
retire in 5yrs kaizenplan.pdf
 
Empowered caregivers
Empowered caregiversEmpowered caregivers
Empowered caregivers
 
Frm 820.90 complaint form cdb 7 9-2013 rev 1
Frm 820.90 complaint form cdb 7 9-2013 rev 1Frm 820.90 complaint form cdb 7 9-2013 rev 1
Frm 820.90 complaint form cdb 7 9-2013 rev 1
 
Excerpts the-magic-of-thinking-big refuse to worry about ur health
Excerpts the-magic-of-thinking-big refuse to worry about ur healthExcerpts the-magic-of-thinking-big refuse to worry about ur health
Excerpts the-magic-of-thinking-big refuse to worry about ur health
 
Malunggay, a horseradish tree, as useful as the multivitamin
Malunggay, a horseradish tree, as useful as the multivitaminMalunggay, a horseradish tree, as useful as the multivitamin
Malunggay, a horseradish tree, as useful as the multivitamin
 
MSDS SDS labelling SOP GHS of classification labelling of chem
MSDS SDS labelling SOP GHS of classification labelling of chemMSDS SDS labelling SOP GHS of classification labelling of chem
MSDS SDS labelling SOP GHS of classification labelling of chem
 
Msds form template connie dello buono 2012
Msds form template connie dello buono 2012Msds form template connie dello buono 2012
Msds form template connie dello buono 2012
 
Corrections, Investigations and CAPA Details in Medical Device Setting
Corrections, Investigations and CAPA Details in Medical Device SettingCorrections, Investigations and CAPA Details in Medical Device Setting
Corrections, Investigations and CAPA Details in Medical Device Setting
 
Corrective and preventive action plan CAPA report form
Corrective and preventive action plan  CAPA report formCorrective and preventive action plan  CAPA report form
Corrective and preventive action plan CAPA report form
 
Supply chain risk management
Supply chain risk managementSupply chain risk management
Supply chain risk management
 
What is quality, Quality Policy and Objectives?
What is  quality, Quality Policy and Objectives?What is  quality, Quality Policy and Objectives?
What is quality, Quality Policy and Objectives?
 
Capa system management
Capa system managementCapa system management
Capa system management
 
Supplier collaboration in quality improvement programs
Supplier collaboration in quality improvement programsSupplier collaboration in quality improvement programs
Supplier collaboration in quality improvement programs
 
Stop vascular disease risk factors early to prevent alzheimer's disease bayar...
Stop vascular disease risk factors early to prevent alzheimer's disease bayar...Stop vascular disease risk factors early to prevent alzheimer's disease bayar...
Stop vascular disease risk factors early to prevent alzheimer's disease bayar...
 
Living will an advance directive or durable power of attorney healthcare cali...
Living will an advance directive or durable power of attorney healthcare cali...Living will an advance directive or durable power of attorney healthcare cali...
Living will an advance directive or durable power of attorney healthcare cali...
 
Client retirement roadmap
Client retirement roadmapClient retirement roadmap
Client retirement roadmap
 
Survivor universal life insurance 4088541883 san jose california connie dello...
Survivor universal life insurance 4088541883 san jose california connie dello...Survivor universal life insurance 4088541883 san jose california connie dello...
Survivor universal life insurance 4088541883 san jose california connie dello...
 
Multi choice index single premium life insurance 4088541883 san jose californ...
Multi choice index single premium life insurance 4088541883 san jose californ...Multi choice index single premium life insurance 4088541883 san jose californ...
Multi choice index single premium life insurance 4088541883 san jose californ...
 
Aviva fixed annuity tax deferral growth guarantees
Aviva fixed annuity tax deferral growth guaranteesAviva fixed annuity tax deferral growth guarantees
Aviva fixed annuity tax deferral growth guarantees
 
Aviva index universal life insurance crediting interest to your cash value
Aviva index universal life insurance crediting interest to your cash valueAviva index universal life insurance crediting interest to your cash value
Aviva index universal life insurance crediting interest to your cash value
 

Dernier

Kolkata Call Girls Services 9907093804 @24x7 High Class Babes Here Call Now
Kolkata Call Girls Services 9907093804 @24x7 High Class Babes Here Call NowKolkata Call Girls Services 9907093804 @24x7 High Class Babes Here Call Now
Kolkata Call Girls Services 9907093804 @24x7 High Class Babes Here Call NowNehru place Escorts
 
Call Girls Service in Bommanahalli - 7001305949 with real photos and phone nu...
Call Girls Service in Bommanahalli - 7001305949 with real photos and phone nu...Call Girls Service in Bommanahalli - 7001305949 with real photos and phone nu...
Call Girls Service in Bommanahalli - 7001305949 with real photos and phone nu...narwatsonia7
 
Call Girls Service Chennai Jiya 7001305949 Independent Escort Service Chennai
Call Girls Service Chennai Jiya 7001305949 Independent Escort Service ChennaiCall Girls Service Chennai Jiya 7001305949 Independent Escort Service Chennai
Call Girls Service Chennai Jiya 7001305949 Independent Escort Service ChennaiNehru place Escorts
 
Call Girls Whitefield Just Call 7001305949 Top Class Call Girl Service Available
Call Girls Whitefield Just Call 7001305949 Top Class Call Girl Service AvailableCall Girls Whitefield Just Call 7001305949 Top Class Call Girl Service Available
Call Girls Whitefield Just Call 7001305949 Top Class Call Girl Service Availablenarwatsonia7
 
Ahmedabad Call Girls CG Road 🔝9907093804 Short 1500 💋 Night 6000
Ahmedabad Call Girls CG Road 🔝9907093804  Short 1500  💋 Night 6000Ahmedabad Call Girls CG Road 🔝9907093804  Short 1500  💋 Night 6000
Ahmedabad Call Girls CG Road 🔝9907093804 Short 1500 💋 Night 6000aliya bhat
 
Call Girls Electronic City Just Call 7001305949 Top Class Call Girl Service A...
Call Girls Electronic City Just Call 7001305949 Top Class Call Girl Service A...Call Girls Electronic City Just Call 7001305949 Top Class Call Girl Service A...
Call Girls Electronic City Just Call 7001305949 Top Class Call Girl Service A...narwatsonia7
 
Call Girls Hosur Just Call 7001305949 Top Class Call Girl Service Available
Call Girls Hosur Just Call 7001305949 Top Class Call Girl Service AvailableCall Girls Hosur Just Call 7001305949 Top Class Call Girl Service Available
Call Girls Hosur Just Call 7001305949 Top Class Call Girl Service Availablenarwatsonia7
 
Bangalore Call Girls Marathahalli 📞 9907093804 High Profile Service 100% Safe
Bangalore Call Girls Marathahalli 📞 9907093804 High Profile Service 100% SafeBangalore Call Girls Marathahalli 📞 9907093804 High Profile Service 100% Safe
Bangalore Call Girls Marathahalli 📞 9907093804 High Profile Service 100% Safenarwatsonia7
 
Call Girls In Andheri East Call 9920874524 Book Hot And Sexy Girls
Call Girls In Andheri East Call 9920874524 Book Hot And Sexy GirlsCall Girls In Andheri East Call 9920874524 Book Hot And Sexy Girls
Call Girls In Andheri East Call 9920874524 Book Hot And Sexy Girlsnehamumbai
 
Russian Call Girl Brookfield - 7001305949 Escorts Service 50% Off with Cash O...
Russian Call Girl Brookfield - 7001305949 Escorts Service 50% Off with Cash O...Russian Call Girl Brookfield - 7001305949 Escorts Service 50% Off with Cash O...
Russian Call Girl Brookfield - 7001305949 Escorts Service 50% Off with Cash O...narwatsonia7
 
Russian Call Girls in Pune Riya 9907093804 Short 1500 Night 6000 Best call gi...
Russian Call Girls in Pune Riya 9907093804 Short 1500 Night 6000 Best call gi...Russian Call Girls in Pune Riya 9907093804 Short 1500 Night 6000 Best call gi...
Russian Call Girls in Pune Riya 9907093804 Short 1500 Night 6000 Best call gi...Miss joya
 
Call Girls Thane Just Call 9910780858 Get High Class Call Girls Service
Call Girls Thane Just Call 9910780858 Get High Class Call Girls ServiceCall Girls Thane Just Call 9910780858 Get High Class Call Girls Service
Call Girls Thane Just Call 9910780858 Get High Class Call Girls Servicesonalikaur4
 
Mumbai Call Girls Service 9910780858 Real Russian Girls Looking Models
Mumbai Call Girls Service 9910780858 Real Russian Girls Looking ModelsMumbai Call Girls Service 9910780858 Real Russian Girls Looking Models
Mumbai Call Girls Service 9910780858 Real Russian Girls Looking Modelssonalikaur4
 
Low Rate Call Girls Pune Esha 9907093804 Short 1500 Night 6000 Best call girl...
Low Rate Call Girls Pune Esha 9907093804 Short 1500 Night 6000 Best call girl...Low Rate Call Girls Pune Esha 9907093804 Short 1500 Night 6000 Best call girl...
Low Rate Call Girls Pune Esha 9907093804 Short 1500 Night 6000 Best call girl...Miss joya
 
Call Girls ITPL Just Call 7001305949 Top Class Call Girl Service Available
Call Girls ITPL Just Call 7001305949 Top Class Call Girl Service AvailableCall Girls ITPL Just Call 7001305949 Top Class Call Girl Service Available
Call Girls ITPL Just Call 7001305949 Top Class Call Girl Service Availablenarwatsonia7
 
VIP Call Girls Mumbai Arpita 9910780858 Independent Escort Service Mumbai
VIP Call Girls Mumbai Arpita 9910780858 Independent Escort Service MumbaiVIP Call Girls Mumbai Arpita 9910780858 Independent Escort Service Mumbai
VIP Call Girls Mumbai Arpita 9910780858 Independent Escort Service Mumbaisonalikaur4
 
Call Girls Hsr Layout Just Call 7001305949 Top Class Call Girl Service Available
Call Girls Hsr Layout Just Call 7001305949 Top Class Call Girl Service AvailableCall Girls Hsr Layout Just Call 7001305949 Top Class Call Girl Service Available
Call Girls Hsr Layout Just Call 7001305949 Top Class Call Girl Service Availablenarwatsonia7
 
Call Girl Service Bidadi - For 7001305949 Cheap & Best with original Photos
Call Girl Service Bidadi - For 7001305949 Cheap & Best with original PhotosCall Girl Service Bidadi - For 7001305949 Cheap & Best with original Photos
Call Girl Service Bidadi - For 7001305949 Cheap & Best with original Photosnarwatsonia7
 
Call Girls Jp Nagar Just Call 7001305949 Top Class Call Girl Service Available
Call Girls Jp Nagar Just Call 7001305949 Top Class Call Girl Service AvailableCall Girls Jp Nagar Just Call 7001305949 Top Class Call Girl Service Available
Call Girls Jp Nagar Just Call 7001305949 Top Class Call Girl Service Availablenarwatsonia7
 

Dernier (20)

Kolkata Call Girls Services 9907093804 @24x7 High Class Babes Here Call Now
Kolkata Call Girls Services 9907093804 @24x7 High Class Babes Here Call NowKolkata Call Girls Services 9907093804 @24x7 High Class Babes Here Call Now
Kolkata Call Girls Services 9907093804 @24x7 High Class Babes Here Call Now
 
Call Girls Service in Bommanahalli - 7001305949 with real photos and phone nu...
Call Girls Service in Bommanahalli - 7001305949 with real photos and phone nu...Call Girls Service in Bommanahalli - 7001305949 with real photos and phone nu...
Call Girls Service in Bommanahalli - 7001305949 with real photos and phone nu...
 
Call Girls Service Chennai Jiya 7001305949 Independent Escort Service Chennai
Call Girls Service Chennai Jiya 7001305949 Independent Escort Service ChennaiCall Girls Service Chennai Jiya 7001305949 Independent Escort Service Chennai
Call Girls Service Chennai Jiya 7001305949 Independent Escort Service Chennai
 
Call Girls Whitefield Just Call 7001305949 Top Class Call Girl Service Available
Call Girls Whitefield Just Call 7001305949 Top Class Call Girl Service AvailableCall Girls Whitefield Just Call 7001305949 Top Class Call Girl Service Available
Call Girls Whitefield Just Call 7001305949 Top Class Call Girl Service Available
 
Ahmedabad Call Girls CG Road 🔝9907093804 Short 1500 💋 Night 6000
Ahmedabad Call Girls CG Road 🔝9907093804  Short 1500  💋 Night 6000Ahmedabad Call Girls CG Road 🔝9907093804  Short 1500  💋 Night 6000
Ahmedabad Call Girls CG Road 🔝9907093804 Short 1500 💋 Night 6000
 
Call Girls Electronic City Just Call 7001305949 Top Class Call Girl Service A...
Call Girls Electronic City Just Call 7001305949 Top Class Call Girl Service A...Call Girls Electronic City Just Call 7001305949 Top Class Call Girl Service A...
Call Girls Electronic City Just Call 7001305949 Top Class Call Girl Service A...
 
Call Girls Hosur Just Call 7001305949 Top Class Call Girl Service Available
Call Girls Hosur Just Call 7001305949 Top Class Call Girl Service AvailableCall Girls Hosur Just Call 7001305949 Top Class Call Girl Service Available
Call Girls Hosur Just Call 7001305949 Top Class Call Girl Service Available
 
Bangalore Call Girls Marathahalli 📞 9907093804 High Profile Service 100% Safe
Bangalore Call Girls Marathahalli 📞 9907093804 High Profile Service 100% SafeBangalore Call Girls Marathahalli 📞 9907093804 High Profile Service 100% Safe
Bangalore Call Girls Marathahalli 📞 9907093804 High Profile Service 100% Safe
 
Call Girls In Andheri East Call 9920874524 Book Hot And Sexy Girls
Call Girls In Andheri East Call 9920874524 Book Hot And Sexy GirlsCall Girls In Andheri East Call 9920874524 Book Hot And Sexy Girls
Call Girls In Andheri East Call 9920874524 Book Hot And Sexy Girls
 
Russian Call Girl Brookfield - 7001305949 Escorts Service 50% Off with Cash O...
Russian Call Girl Brookfield - 7001305949 Escorts Service 50% Off with Cash O...Russian Call Girl Brookfield - 7001305949 Escorts Service 50% Off with Cash O...
Russian Call Girl Brookfield - 7001305949 Escorts Service 50% Off with Cash O...
 
sauth delhi call girls in Bhajanpura 🔝 9953056974 🔝 escort Service
sauth delhi call girls in Bhajanpura 🔝 9953056974 🔝 escort Servicesauth delhi call girls in Bhajanpura 🔝 9953056974 🔝 escort Service
sauth delhi call girls in Bhajanpura 🔝 9953056974 🔝 escort Service
 
Russian Call Girls in Pune Riya 9907093804 Short 1500 Night 6000 Best call gi...
Russian Call Girls in Pune Riya 9907093804 Short 1500 Night 6000 Best call gi...Russian Call Girls in Pune Riya 9907093804 Short 1500 Night 6000 Best call gi...
Russian Call Girls in Pune Riya 9907093804 Short 1500 Night 6000 Best call gi...
 
Call Girls Thane Just Call 9910780858 Get High Class Call Girls Service
Call Girls Thane Just Call 9910780858 Get High Class Call Girls ServiceCall Girls Thane Just Call 9910780858 Get High Class Call Girls Service
Call Girls Thane Just Call 9910780858 Get High Class Call Girls Service
 
Mumbai Call Girls Service 9910780858 Real Russian Girls Looking Models
Mumbai Call Girls Service 9910780858 Real Russian Girls Looking ModelsMumbai Call Girls Service 9910780858 Real Russian Girls Looking Models
Mumbai Call Girls Service 9910780858 Real Russian Girls Looking Models
 
Low Rate Call Girls Pune Esha 9907093804 Short 1500 Night 6000 Best call girl...
Low Rate Call Girls Pune Esha 9907093804 Short 1500 Night 6000 Best call girl...Low Rate Call Girls Pune Esha 9907093804 Short 1500 Night 6000 Best call girl...
Low Rate Call Girls Pune Esha 9907093804 Short 1500 Night 6000 Best call girl...
 
Call Girls ITPL Just Call 7001305949 Top Class Call Girl Service Available
Call Girls ITPL Just Call 7001305949 Top Class Call Girl Service AvailableCall Girls ITPL Just Call 7001305949 Top Class Call Girl Service Available
Call Girls ITPL Just Call 7001305949 Top Class Call Girl Service Available
 
VIP Call Girls Mumbai Arpita 9910780858 Independent Escort Service Mumbai
VIP Call Girls Mumbai Arpita 9910780858 Independent Escort Service MumbaiVIP Call Girls Mumbai Arpita 9910780858 Independent Escort Service Mumbai
VIP Call Girls Mumbai Arpita 9910780858 Independent Escort Service Mumbai
 
Call Girls Hsr Layout Just Call 7001305949 Top Class Call Girl Service Available
Call Girls Hsr Layout Just Call 7001305949 Top Class Call Girl Service AvailableCall Girls Hsr Layout Just Call 7001305949 Top Class Call Girl Service Available
Call Girls Hsr Layout Just Call 7001305949 Top Class Call Girl Service Available
 
Call Girl Service Bidadi - For 7001305949 Cheap & Best with original Photos
Call Girl Service Bidadi - For 7001305949 Cheap & Best with original PhotosCall Girl Service Bidadi - For 7001305949 Cheap & Best with original Photos
Call Girl Service Bidadi - For 7001305949 Cheap & Best with original Photos
 
Call Girls Jp Nagar Just Call 7001305949 Top Class Call Girl Service Available
Call Girls Jp Nagar Just Call 7001305949 Top Class Call Girl Service AvailableCall Girls Jp Nagar Just Call 7001305949 Top Class Call Girl Service Available
Call Girls Jp Nagar Just Call 7001305949 Top Class Call Girl Service Available
 

Neuropsychologic function and level of caregiver supervision

  • 1. 221 The Relationship Between Neuropsychologic Function and Level of Caregiver Supervision at 1 Year After Traumatic Brain Injury Tessa Hart, PhD, Scott Millis, PhD, Thomas Novack, PhD, Jeffrey Englander, MD, Rebecca Fidler-Sheppard, BA, Kathleen R. Bell, MD ABSTRACT. Hart T, Millis S, Novack T, Englander J, © 2003 by the American Congress of Rehabilitation Medi- Fidler-Sheppard R, Bell KR. The relationship between cine and the American Academy of Physical Medicine and neuropsychologic function and level of caregiver supervision at Rehabilitation 1 year after traumatic brain injury. Arch Phys Med Rehabil 2003;84:221-30. Objectives: To evaluate distribution of levels of caregiver T90,000 persons BRAIN States, leavingdegreea of permanent to RAUMATIC problem in the United INJURY (TBI) is major health per year with some an estimated 80,000 supervision at 1 year after traumatic brain injury, and to deter- mine neuropsychologic predictors of supervision level. disability relative to their preinjury status.1 TBI can alter role Design: Prospective longitudinal design, concurrent mea- relationships, create marital disruption, and place great strain surement of neuropsychologic function and supervision level. on the family system.2 Although persons of any age may be Setting: Seventeen Traumatic Brain Injury Model Systems injured, TBI affects primarily young adults, bringing societal centers. burden and personal hardship in the form of many years of lost Participants: A total of 563 adults tested at 1 year postin- productivity. Of the multiple impairments caused by TBI, cogni- jury; and a subgroup of 452 studied for neuropsychologic tive and behavioral deficits are more likely than physical limita- function in the absence of impairment in mobility or basic tions to preclude successful return to work or other forms of social self-care, as assessed by high FIM™ instrument motor scores. productivity.3 Caring for survivors with physical and cognitive Interventions: Not applicable. disabilities places financial demands as well as less tangible bur- Main Outcome Measure: Supervision level measured by dens on family members and government-funded institutions. scores on Supervision Rating Scale (SRS). One important aspect of the caregiving role in relation to Results: Two thirds (69%) of the sample was rated as moderate and severe TBI is the amount of supervision that is independent of supervision. Participants without significant given to the injured person. Supervision implies the continuous dysfunction on motor FIM were grouped into supervision or intermittent presence of another person to provide physical groups differing in intensity of time commitment from care- care, instructions for or set-up of daily living tasks, problem giver (independent, moderate supervision, heavy supervision). solving in case of emergency, or some combination of these. In univariate analyses, groups differed on demographic vari- For adults who were functioning independently before their ables (education, race, productivity prior to injury), duration of TBI, supervision means a major lifestyle change for both the altered consciousness, and all but 1 neuropsychologic measure. person with TBI and the involved caregiver(s). Research sug- A binomial regression model (complementary log-log model) gests that degree of supervision is 1 variable affecting per- revealed that supervision at 1 year was predicted by education ceived burden of caregivers, either directly or indirectly. For and scores on the Trail Making Test Part B and digits back- example, Marsh et al studied lifestyle changes that were both ward. common and distressing to caregivers at 6 months4 and 12 Conclusions: Findings confirm the importance of preinjury months5 after severe TBI. At 6 months, having “less time for status and measures of working memory and cognitive flexi- myself” was rated as the most common change for caregivers, bility in predicting functional independence after TBI. The but was not rated as the most distressing. At 12 months, less SRS appears prone to ceiling effects in persons followed pro- time for oneself was rated both the most common and the most spectively after moderate to severe TBI. distressing change. This implies that the extra time devoted to Key Words: Brain injuries; Cognition; Outcomes Research; caring for a family member, or simply being in a constant state Rehabilitation. of responsibility for someone else, may be more difficult to cope with as the need becomes chronic. Similarly, Wallace et al6 found that high proportions of caregivers of persons with TBI reported having to work less (30%), participating in fewer leisure pursuits (43%), and having difficulty conducting usual From Moss Rehabilitation Research Institute (Hart, Fidler-Sheppard) and Depart- activities (67%). Although the lifestyle changes in these studies ment of Rehabilitation Medicine (Hart), Jefferson Medical College, Thomas Jefferson are not measures of supervision alone, supervision needs may University, Philadelphia, PA; Kessler Medical Rehabilitation Research and Education Corp, West Orange, NJ (Millis); Spain Rehabilitation Center, University of Alabama, comprise a significant portion of the extra time and energy Birmingham, AL (Novack); Department of Physical Medicine and Rehabilitation, required of caregivers at the expense of other activities. Yet for Santa Clara Valley Medical Center, San Jose, CA (Englander); and Department of all its potential importance as a clinical construct with impact Rehabilitation Medicine, University of Washington, Seattle, WA (Bell). on the injured person and the family system, supervision has Supported by the National Institute on Disability and Rehabilitation Research (grant nos. H133A70033, H133A980010, H133A980023). not yet been extensively studied as an outcome of TBI. No commercial party having a direct financial interest in the results of the research A few descriptive studies have directly measured the amount supporting this article has or will confer a benefit upon the authors or upon any and nature of supervision required for persons with TBI. For organization with which the authors are associated. example, Hawkins et al7 performed 3- and 12-month follow- Reprint requests to Tessa Hart, PhD, Moss Rehabilitation Research Institute, 1200 W Tabor Rd, Philadelphia, PA 19141, e-mail: thart@einstein.edu. ups on a sample of 55 persons, most with severe TBI. These 0003-9993/03/8402-7442$35.00/0 investigators reported that only one third of their sample was doi:10.1053/apmr.2003.50023 independent of supervision at 3 months postinjury. By 12 Arch Phys Med Rehabil Vol 84, February 2003
  • 2. 222 NEUROPSYCHOLOGIC FUNCTION AND SUPERVISION, Hart months postinjury, 59% were independent of supervision, but ment of outcome, which was number of falls sustained in the another 18% needed it full-time or nearly full-time. Granger et hospital setting. Again, measures of executive function ex- al8 explored aspects of caregiver help and supervision in more plained a significant amount of variance in the real-world depth by asking 22 community-based persons with TBI and outcome measure. their caregivers to keep a journal of the amount and type of It stands to reason that both memory and executive function assistance needed at home. The subjects were fairly evenly would be associated with functional outcomes after TBI. The divided among 5 supervision levels, ranging from “constant” to ability to learn and retain novel information over time is “none.” Although the findings of Granger may be difficult to essential to safe, adaptive function in a changing environment. generalize because of the small sample size, the data suggested Executive function is a catch-all term used to describe a host of that for those with intense supervision needs, the degree of complex skills related to goal-directed behavior.20 Executive motor impairment was important for distinguishing levels of skills enable the organism to choose and deploy flexible be- supervision required. However, for distinguishing among less haviors in response to environmental demands, to regulate intense levels of supervision, cognitive impairments were more those behaviors via self-monitoring processes, and to sustain important than physical status. Time postinjury seems to be a plans of action over time. This class of functions is not con- factor in determining supervision level in longer term outcome sidered to be very well tapped by objective neuropsychologic studies. For example, Corrigan et al9 followed 95 patients for 5 measures, which are commonly administered under structured years and reported a decrease in the need for assistance and and standardized conditions requiring little flexibility and de- supervision from the first year after the injury (60%) to 4 to 5 cision making from the subject. Nonetheless, measures that do years after the trauma (25%). demand some degree of mental flexibility such as the Wiscon- The clinical and research literature10 suggests that cognitive sin Card Sorting Test (WCST), the Trail Making Test Part B and behavioral deficits caused by TBI are more strongly asso- (TMT-B), and measures of fluency or generativity appear fairly ciated with caregiver burden than are physical impairments. robustly related to activities that demand executive function in The Wallace6 study reported that of various domains rated by real life.21,22 An excellent example is the demonstration in the caregiver, only cognition accounted for significant variance multiple studies23-25 of the TMT as a predictor of return to in caregiver lifestyle change. Similarly, Hawkins et al7 found driving after acquired brain disorder. that only cognitive function ratings at 3 months postinjury The measurement of supervision level has varied in previous predicted degree of supervision at 1 year. In a study of persons work on this topic, with most previous studies developing their with TBI and their families 3 months postinjury, Smith and own system, usually an ordinal scheme for rating the intensity Schwirian11 found that the combination of impaired cognition of care.7,8 The instrument used in the current investigation, the and need for supervision was perceived as especially burden- Supervision Rating Scale (SRS), was published by Boake in some. In a French sample of persons with TBI, Mazaux et al12 1996.26 The SRS is an instrument for rating the degree of reported that lack of mental flexibility and poor planning (as supervision received on a 13-point ordinal scale from “inde- rated by an experienced clinician) were associated with long- pendent” to “full-time direct supervision (with patient in phys- term impairment of “social autonomy” (ie, need for caregiver ical restraints).” In his initial validation study on 114 persons assistance and supervision). Clinical experience suggests, as with TBI at an average of 4 years postinjury, Boake26 reported noted by Granger,8 that there is sizeable group of persons with that about 75% of the sample received at least part-time super- moderate to severe TBI who require supervision for cognitive vision. However, Hall et al27 reported the opposite finding in or behavioral deficits, but whose physical function is relatively their sample of 48 persons with TBI between 2 and 9 years intact. In fact, supervising these individuals may be more postinjury: about 71% were at the ceiling, that is, functioning difficult because they are mobile. Little is known about the without supervision. It is not clear what differences between specific cognitive deficits that are present in these individuals, these samples accounted for the discrepant findings, and it and which deficits are most indicative of need for caregiver remains unknown whether similar ceiling effects would be presence or assistance. found closer to the time of injury (eg, at 1y post-TBI). In the studies cited earlier, cognitive status was not deter- One aspect of the SRS noted by Boake is that it contains no mined objectively but was based on caregiver or clinician provision to describe or explain the reasons why the person ratings (eg, by using the cognitive items on the FIM™ instru- with TBI is, or is not, receiving supervision. Thus, it is of ment13). However, objective measures of cognitive function interest to examine the correlates of SRS ratings to help elu- (ie, neuropsychologic test scores) have been shown repeatedly cidate the deficits and impairments that are associated with to predict real-world functional outcomes. Ratings of func- supervision outcome in this population. For the present study, tional disability are significantly correlated with scores in a we undertook analyses of SRS ratings performed on a sample variety of cognitive domains in postacute TBI.14 Neuropsycho- of persons at 1 year after moderate to severe TBI. These logic testing after TBI provides significant incremental predic- participants, who were enrolled in the Traumatic Brain Injury tion of vocational status at 1 year postinjury, over and above Model Systems (TBIMS) national database, had also under- measures of initial injury severity and functional status mea- gone neuropsychologic testing at the same follow-up interval. sures.15,16 Measures of learning and memory and executive The objectives of the study were 3-fold. First, we wanted function appear to be overall good predictors of productivity simply to examine the distribution of rated supervision levels, outcome.17 Outcomes other than productivity and return to both to determine the supervision characteristics of a large, work have been studied, at varying intervals between testing prospectively followed sample of persons with moderate to and outcome measurement. For example, Hanks et al18 studied severe TBI and to determine the extent of ceiling effects, if any, the utility of neuropsychologic testing in inpatient rehabilita- at 1 year postinjury. Second, we wanted to provide clinically tion for predicting a range of social and functional outcomes at accessible demographic, injury, and neuropsychologic data on 6 months post-TBI. Test scores, particularly in the areas of the characteristics of persons with TBI at different levels of executive function and memory, predicted outcome over and supervision. To explore characteristics of a clinically signifi- above the contributions of motor and sensory deficits. Another cant subgroup, we elected to compare subjects at different study by the same investigators19 used concurrent prediction, levels of supervision in the relative absence of physical dis- that is, testing conducted during the same time as the measure- ability. Finally, we performed multivariable analyses to esti- Arch Phys Med Rehabil Vol 84, February 2003
  • 3. NEUROPSYCHOLOGIC FUNCTION AND SUPERVISION, Hart 223 mate the relative contributions of different aspects of neuro- ment in the acute care hospital; the LOC, defined as the interval psychologic function to variation in supervision level in the in days between the TBI and the date at which the patient absence of physical care needs, over and above that accounted followed simple commands on 2 consecutive assessments for by demographic variables and indices of injury severity. within 24 hours; and the duration of posttraumatic amnesia Based on previous research, we hypothesized that measures of (PTA), defined as the interval in days between the TBI and the learning, delayed memory, and executive function would pro- first of 2 consecutive (within 72h) scores above 75 on the vide significant incremental prediction of the need for super- Galveston Orientation and Amnesia Test30 (GOAT). Neuropsy- vision in persons who did not require supervision for mobility chologic measures were derived from a comprehensive battery or basic self-care activities. of tests in wide clinical use, which was composed for the purpose of longitudinal study within the TBIMS project.31 The METHODS tests in the battery and the scores used in the present study are in table 1. Outcome measures were also selected from the Participants comprehensive set of measures administered at 1-year follow- Participants were selected from persons enrolled in the up. The main outcome variable of interest was the SRS, de- TBIMS longitudinal database from the 17 TBIMS centers in scribed earlier. Participants’ level of supervision was obtained the United States. All participants met criteria for inclusion in by interview with the patient and caregiver at follow-up. The the Model Systems project by having sustained a penetrating or 13 ordinal levels of supervision rated on the original scale are nonpenetrating TBI as evidenced by loss of consciousness in table 2. A second outcome variable from the national data- (LOC), focal brain lesion on neuroimaging, or abnormality on base was used to select a subgroup of subjects for further study neurologic examination consistent with external trauma. All as described later. This was the FIM.13 The FIM is an 18-item Model Systems enrollees were age 16 or older, received med- rating scale assessing patients’ level of independence in motor, ical care in a TBIMS-affiliated acute care hospital within 24 self-care, and cognitive items. Each item is rated on a scale of hours of injury, and were transferred directly from acute care to 1 (total assistance) to 7 (complete independence). Rasch anal- an affiliated inpatient rehabilitation hospital. All participants ysis has revealed 2 main dimensions underlying FIM scores, a provided informed consent directly or by legal proxy. physical dimension that includes 13 items rating motor func- As has been described in detail elsewhere,28 longitudinal tion and self-care abilities, and a cognitive dimension including data collection for the TBIMS project occurs from acute emer- the 5 cognitive items.32 Neuropsychologic and follow-up data gency care to long-term follow-up. Initial data collection in- were collected at 12 months post-TBI with a 2-month window cludes demographic and social information, data on the type in either direction (ie, between 10 and 14mo postinjury). and severity of the TBI, and other medical data such as com- plications. Data collected during the rehabilitation stay pertain Data Analysis primarily to functional status on admission and discharge. Descriptive statistics were calculated on the whole sample Follow-up data collection, with which the present investigation with respect to the 13 SRS levels and the demographic and is primarily concerned, is done at annual anniversaries of the injury variables listed previously. The large sample (N 563) TBI for as long as contact may be maintained. The first-year was used primarily to characterize the distribution of scores on follow-up information is collected in a 2- to 3-hour testing and the SRS. For inferential analyses on the differences related to interview session with the patient and, if possible, a caregiver supervision level and the contribution of neuropsychologic or significant other. This session includes a neuropsychologic factors, we selected a subset of participants who, at follow-up, test battery and several outcome measures to assess functional did not show significant disability with respect to physical or and social status, including the SRS, which was added to the self-care function. The purpose of this was to examine the TBIMS data collection protocol in 1997. Normally, if personal characteristics of persons receiving supervision in the relative contact is not possible at follow-up, telephone interviews are absence of physical assistance. Participants were assumed to be conducted to obtain a portion of the data set. The current study physically independent if they received scores of 6 (modified used only follow-up data collected in person because we were independence) or 7 (independent) on all 13 motor FIM items: primarily interested in persons who had undergone neuropsy- feeding, grooming, bowel and bladder management and toilet- chologic testing. Thus, in selecting a study sample, we selected ing, dressing (upper and lower body), transfers (bed, toilet and from the national database all participants who had received all tub), bathing, locomotion, and stairs. There were 452 partici- or any portion of the follow-up neuropsychologic test battery pants meeting this criterion. This subsample of physically and had been rated on the SRS. These criteria were met by 563 independent participants was used for all analyses described participants. A subsample of 452 participants without signifi- later. cant physical disability were used for most of the analyses, as For inferential statistical analyses, the 13 original levels in described in the Data Analysis section below. the SRS were collapsed in 2 different ways. For 1 set of analyses, we used SRS scores to create groups of participants Measures at 3 clinically meaningful levels of supervision. SRS levels 1 Four types of variables were collected on each participant and 2 were combined into a level considered as “independent.” from the national database: demographic measures, injury se- Levels 3 through 5 were combined into a level considered verity variables, neuropsychologic test scores, and outcome “moderate supervision.” The commonality among these 3 lev- measures. Demographic measures were obtained by chart re- els is that a caregiver may be absent for the time needed to view and patient/family interview. They included age at injury, work full-time (see table 2). Levels 6 through 13 were com- gender, race, education, productivity status (eg, employment) bined into a “heavy supervision” level in which a caregiver at the time of injury, marital status, and primary person with would not be able to work full-time. These 3 levels were used whom the patient resided at follow-up. Injury variables in- as a grouping variable for chi-square and Kruskal-Wallis tests cluded the etiology of injury and 3 measures commonly used to to examine differences on selected demographic and injury estimate the severity of TBI. These were the Glasgow Coma variables and on neuropsychologic test scores. In view of the Scale29 (GCS) score on admission to the emergency depart- large number of univariate comparisons, Bonferroni correction Arch Phys Med Rehabil Vol 84, February 2003
  • 4. 224 NEUROPSYCHOLOGIC FUNCTION AND SUPERVISION, Hart Table 1: Neuropsychologic Tests in Follow-Up Battery Test Description Score Impairment Criterion GOAT Questions assessing orientation to time, place, and Error points 24 person and recall of recent events Token Test Measure of auditory comprehension (subject No. correct 37 follows commands using colored tokens) Logical memory Immediate and 30-min delayed recall of stories No. of story elements 5th percentile for age immediate/delayed presented auditorially recalled Digit span, forward and Repetition of digit strings in forward/reverse order; Based on no. of digits 5th percentile for age backward measure of attention/concentration and repeated immediate recall Grooved Pegboard Motor speed, fine coordination; subject places 25 Time (s) 89 pegs in board with dominant hand Benton Visual Perceptual matching using multiple-choice stimuli No. correct 25 Discrimination Test Controlled Oral Word Verbal fluency/generativity; subject generates words No. of words (corrected 23 Association Test beginning with specific letters in 1-min trials for age, education) Rey Auditory Verbal Word list learning: 15 words 5 trials Total no. of words 37 Learning Test recalled Symbol Digit Visual scanning under timed conditions; subject No. correct responses 36 written, 40 oral Modalities Test, matches symbols to numbers using written and within time limit written/oral oral responses, respectively TMT-A, TMT-B Visuomotor sequencing; subject connects numbers Time (s) 10th percentile for age in order (Part A), then alternates numbers and letters, requiring set-shifting (Part B) Block design Visual construction; subject arranges 3-dimensional No. correct/points for 4 blocks to match designs within time limits speed (corrected for age) WCST Reasoning/concept formation, set-shifting; subject No. of perseverative 5th percentile for age, deduces principles by which to sort cards via responses education level feedback on performance was used to set at .003 for the neuropsychologic test score gression model. The dependent variable or outcome variable, analyses (ie, .05/16 tests .003). supervision level, was dichotomized as either independent In the next analysis, we examined the relative contribution of (SRS levels 1–2) or supervised (SRS levels 3–13). The demo- neuropsychologic test performance while controlling for the graphic variables (age, education) were entered first, followed effects of demographic and injury variables on level of super- by the injury severity variables (length of PTA, LOC). Nine of vision. For this analysis we used a generalized linear modeling the 16 neuropsychologic test scores were entered last as a approach in which we initially fitted a sequential logistic re- group. The scores selected were 4 measures of memory (digits Table 2: Distribution of Ratings on Supervision Rating Scale in Overall Sample (N 563) SRS Level* n % 1: Lives alone or with nonresponsible others (eg, children) 294 52.2 2: Lives with others who could be responsible, but is unsupervised 93 16.5 3: Supervised overnight, not during day 32 5.7 4: Supervised overnight and part-time during day, may go on independent outings 40 7.1 5: Supervised overnight, part-time during day, unsupervised during full-time work 11 2.0 hours 6: Supervised overnight, part-time during day, caregivers absent 1h at a time, but 35 6.2 less than time needed to work full-time 7: Supervised overnight and during most of day; left alone 1h at a time 18 3.2 8: Full-time indirect supervision; someone always present, checks on patient once 19 3.4 every 30min or less often 9: Same as 8, with overnight safety precautions such as lock on front door 4 0.7 10: Full-time direct supervision; someone always present, checks on patient more than 12 2.1 once per 30min 11: Lives in setting in which exits are physically controlled (eg, locked unit) 5 0.9 12: Same as 11, plus line-of-sight supervision (eg, escape watch) 0 0 13: Patient in physical restraints 0 0 *Defined by Boake.26 Arch Phys Med Rehabil Vol 84, February 2003
  • 5. NEUROPSYCHOLOGIC FUNCTION AND SUPERVISION, Hart 225 forward and backward, Rey Auditory Verbal Learning Test Characteristics of Physically Independent Persons by [RAVLT] total, logical memory– delayed score), 3 measures of Supervision Level executive function (TMT-B, Controlled Oral Word Association Demographic and injury characteristics of the physically Test [COWAT], WCST perseverative responses), and 2 scores independent subsample sorted by the 3 supervision groups expected to vary by overall severity of deficit rather than (independent, moderate, heavy supervision) are in table 3. The specific neuropsychologic impairment (TMT-A, Digit Symbol groups did not differ significantly by age or gender. Three other Modalities Test–Oral administration). demographic variables, which are themselves interrelated We then investigated whether the logit link function used in (race, education, productivity status prior to injury), showed logistic regression was appropriate for our data. The logit link significant overall differences by supervision level. Post hoc is often compared with the complementary log-log link. The chi-square tests showed that members of ethnic minorities, expected value of the response variable is modeled as a linear persons not productively employed before injury, and persons combination of the predictor variables by way of a link func- with less than a high school education were disproportionately tion. The logit link is (ln[p/(1 p)]), whereas the complemen- represented in the supervised groups. tary log-log link function is (ln[ ln(1 )]). The complemen- With respect to injury characteristics, neither etiology nor tary log-log function is asymmetrically sigmoidal with the admission GCS score varied systematically by supervision upper part of the sigmoid being more elongated in comparison level. Duration of unconsciousness was significantly shorter for to the symmetric logit function. We used Stata,a version 7.0,33 the independent group than for each of the 2 supervised groups to develop our generalized linear models. (all P .0001, Mann-Whitney tests). Duration of PTA was RESULTS significantly longer for the moderate group compared with the independent group (P .001, Mann-Whitney). Characteristics of the Sample Descriptive demographic and injury characteristics were cal- Neuropsychologic Characteristics by Supervision Level culated for the whole sample of 563 participants. The sample The neuropsychologic test scores were analyzed by super- was predominantly male (72%) with a mean age standard vision level in 2 ways. Scores on each test were compared deviation (SD) of 36.8 16.0 (range, 16 – 89y). Whites com- across the 3 groups by using Kruskal-Wallis tests. In addition, prised 66% of the sample and African Americans 24%. A little for each group, the proportion of scores falling into the im- less than one third (28%) had less than a high school education paired range was calculated and the groups compared by chi- and another third (31%) had a high school diploma or General square tests. Impaired performance was defined as scores fall- Educational Development (GED). About half (48%) were sin- ing at or worse than the 5th percentile according to available gle, and 64% were competitively employed before injury. normative data, or according to other criteria for scores within These demographic characteristics are typical of samples of the “abnormal range.” These scores were derived from pub- persons with moderate to severe TBI. In terms of injury char- lished test manuals and, in a few cases, adopted from previous acteristics, the overall mean GCS score on admission to emer- work performing similar analyses on the same tests.34 For tests gency care was 9.0 4.3 (range, 3–15), mean LOC was sensitive to age and education, criteria were adjusted by those 8.1 15.9 days (range, 0 –220), and mean length of PTA was factors. The scores used to determine impairment on each test 29.8 25.7 days (range, 0 –234). These values confirm the are in table 1. predominance of moderate to severe TBI in the sample. The Results of both types of analyses, along with summary majority of cases were caused by vehicular crashes (68%). statistics for each group, are in table 4. All measures showed an Falls accounted for an additional 16% and violence-related average pattern of worse performance as intensity of supervi- injury for 15%. sion increased (ie, worst performance in the heavy supervision At 1-year follow-up, as is also typical in moderate and group, best performance in the independent group). For all tests severe TBI, an even smaller proportion of the participants except for the Benton Visual Discrimination Test (BVDT; reported being competitively employed (29%). The majority performance on which appeared to be near ceiling for all (83%) were living with relatives or significant others, and 13% groups), overall Kruskal-Wallis test results were significant at reported living alone. P less than .001. Post hoc tests (Mann-Whitney U) indicated that all tests showing significant differences discriminated the Distribution of SRS Scores independent group from 1 or both of the supervision groups. The distribution of cases in the 13 original SRS levels over Only the COWAT differed significantly between the moderate the entire sample of 563 participants is in table 2. Slightly over and heavy supervision groups. Perseverative errors on the half the participants were rated as independent (level 1) at 1 WCST showed a trend toward significance between the 2 year postinjury. Another 16.5% were rated at level 2, which is supervision groups (P .006). also an independent level because the only difference from Results of the chi-square analyses, comparing the percentage level 1 is that the patient lives with someone who could be of persons within the impaired range on each test across responsible if supervision were needed. Thus, about 69% of groups, essentially agreed with the Kruskal-Wallis tests (see this sample were rated as unsupervised. table 4). Again, results were significant for all tests except the Of the higher scores indicating that some supervision was BVDT, with the independent group differing from 1 or both received, several values were infrequently used relative to their supervision groups in all post hoc analyses. However, the neighboring values (eg, levels 5, 9). No participants in this percentage of impaired in the moderate versus heavy supervi- sample received either of the 2 highest scores (12, 13). sion groups differed significantly only on the backward digit As expected, physical and self-care functioning was signif- span measure. icantly related to level of supervision. SRS score correlated Participants in the 3 groups also differed from each other in negatively with total motor score on the FIM (Spearman terms of the number of tests on which they scored within the .45, P .00001). The remainder of the analyses focused impaired range. On average, participants in the independent on the subsample of 452 participants with no scores on motor group scored in the impaired range on 14% of the tests they FIM items less than 6. completed (about 2/16 tests, for those completing the entire Arch Phys Med Rehabil Vol 84, February 2003
  • 6. 226 NEUROPSYCHOLOGIC FUNCTION AND SUPERVISION, Hart Table 3: Demographic and Injury Characteristics of Physically Independent Participants by Supervision Level Moderate Heavy Independent Supervision Supervision Overall Group (n 359) (%) (n 57) (%) (n 36) (%) Comparisons Age (y) Mean SD 35.0 14.5 34.7 16.2 36.6 19.7 NS Range 16–86 16–78 16–89 Gender Male 259 (80) 39 (12) 25 (8) NS Female 100 (76) 18 (14) 11 (9) Race 2 White 262 (84) 31 (10) 20 (6) 11.4, P .005 Ethnic minority 97 (70) 26 (19) 16 (12) Education 2 High school 82 (69) 21 (18) 15 (13) 13.7, P .005 High school or GED 116 (81) 14 (10) 14 (10) High school 158 (84) 22 (12) 7 (4) Productivity status 2 Productive* 296 (82) 40 (11) 26 (7) 6.2, P .05 Nonproductive 63 (70) 17 (19) 10 (11) Etiology Vehicular 247 (80) 37 (12) 23 (7) NS Violence-related 46 (72) 11 (17) 7 (11) Falls/other 66 (81) 9 (11) 6 (7) GCS score (emergency admission) (n 436) Mean SD 9.3 4.2 8.9 4.4 8.4 4.2 NS Range 3–15 3–15 3–15 LOC, d (n 542) Mean SD 4.9 8.8 10.5 11.4 11.7 15.6 KW 28.0, P .00001 Range 0–63 0–38 0–64 Duration of PTA, d (n 416) Mean SD 24.6 19.3 37.1 25.7 32.7 22.7 KW 13.4, P .001 Range 0–144 5–102 0–94 Abbreviations: NS, not significant; KW, Kruskal-Wallis. * Includes full-time workers, full-time students, and homemakers. battery). Those in the moderate supervision group were im- Table 5 presents summary information for the sequential paired on a mean 27% of completed tests (about 4/16) and cloglog model. A total of 281 subject records contributed to those in the heavy supervision group were impaired on a mean this analysis by virtue of having complete data sets. Age and 44% (7 tests). These proportions differed between all pairs of education were entered first with education reliably predicting groups at P less than .01 (Kruskal-Wallis tests). level of supervision. Length of PTA and length of LOC were entered next, but neither made statistically significant contri- Sequential Binomial Regression Models butions. The neuropsychologic tests were entered last as a As noted above, supervision was dichotomized for this anal- group. Only 2 of the 9 tests, digits backward and TMT-B, were ysis, with participants rated independent (SRS levels 1–2), reliable predictors of supervision level. It was interesting to coded as 1, and the supervised participants (SRS levels 3–13), note that the sign of the coefficient of digits backward was coded as 0, in our regression models. Because most participants opposite to what would be predicted on the basis of both were independent, our dependent variable contained signifi- clinical expectation and its point biserial correlation with the cantly more 1’s than 0’s. On the basis of this distribution, we ordinal dependent variable, SRS. That is, we would expect that expected that a complementary log-log model (cloglog) would higher scores on digits backward would be associated with an fit our data better than a standard logistic regression model. In increased likelihood of independent functioning. Indeed, its fact, the cloglog had a lower deviance statistic (192.24) than correlation with SRS was rb equal to .15 (P .002). This pattern the logit link (197.68). Furthermore, the difference between the of findings suggests that digits backward may be a negative or models’ Bayesian information criterion statistics (5.45) pro- net suppressor variable.35 A suppressor variable enhances the vided positive evidence for selecting the cloglog model. The importance of other predictor variables by suppressing variance remaining analyses involved the cloglog model. Substantial that is irrelevant in the prediction of the outcome variable, multicolinearity among the predictor variables was ruled out by rather than contributing variance in its own right. calculating the variance inflation factor (VIF) for each; the VIF In terms of evaluating the overall model, receiver operating provides an index of the strength of the relationship between characteristic (ROC) curve analysis revealed that this model each predictor variable and all other predictors remaining in the had excellent discrimination (area under the curve .83; fig 1). equation. The mean VIF for this set of predictors was 1.71, and Overall correct classification was 85%. The prevalence of the highest VIF for an individual variable was 2.38; all VIFs supervision in this sample of persons with TBI was relatively were well below 20. low. Deriving models to predict low prevalence events is Arch Phys Med Rehabil Vol 84, February 2003
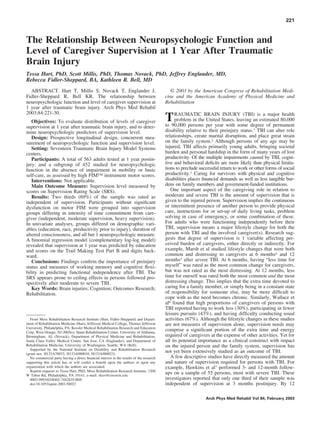
  • 7. Table 4: Neuropsychologic Test Results by Supervision Level Moderate Heavy Supervision Independent (Level 1) Supervision (Level 2) (Level 3) Group Differences Test (n 359) (n 57) (n 36) (at P .003) GOAT Median 1.0 5.0 7.0 1 vs 2 1 vs 3 Mean SD 4.5 7.6 10.0 15.3 17.7 21.5 % impaired 1.7 9.1 31.4 1 vs 2 1 vs 3 Token Test Median 44.0 43.0 40.0 Mean SD 41.9 4.3 40.9 4.4 35.7 10.0 1 vs 3 % impaired 8.1 17.0 42.4 1 vs 3 Logical memory, immediate Median 22.0 17.5 16.0 1 vs 2 1 vs 3 Mean SD 22.1 8.2 18.6 9.3 15.4 9.4 % impaired 13.5 27.8 48.5 1 vs 3 Logical memory, delayed Median 18.0 12.5 9.0 1 vs 2 1 vs 3 Mean SD 17.9 8.7 13.6 10.8 10.8 9.0 % impaired 11.6 31.5 40.6 1 vs 2 1 vs 3 Digit span, forward Median 8.0 7.0 6.0 1 vs 2* 1 vs 3 Mean SD 8.2 2.3 7.3 2.3 6.4 2.4 % impaired 10.9 19.6 31.4 1 vs 3 Digit span, backward Median 6.0 5.5 4.0 1 vs 3 Mean SD 6.2 2.3 5.8 2.3 4.6 2.4 % impaired 9.1 8.9 34.3 1 vs 3 2 vs 3 Grooved Pegboard Median 78.0 82.0 100.0 1 vs 3 Mean SD 87.0 34.8 92.7 38.1 117.7 63.7 % impaired 29.1 38.2 64.7 1 vs 3 BVDT Median 30.0 30.0 28.0 NS Mean SD 29.3 3.2 29.1 3.7 27.4 3.6 % impaired 12.6 10.9 17.6 NS COWAT Median 34.0 27.0 23.5 1 vs 2 1 vs 3 2 vs 3 Mean SD 33.8 10.8 28.9 10.1 22.1 9.0 % impaired 16.2 30.2 50.0 1 vs 3 RAVLT Median 45.0 38.0 30.5 Mean SD 44.3 11.5 36.8 14.4 30.2 11.6 1 vs 2 1 vs 3 % impaired 29.5 48.1 71.9 1 vs 2* 1 vs 3 SDMT, written Median 46.0 35.0 29.5 Mean SD 44.5 13.3 35.5 12.1 30.8 12.4 1 vs 2 1 vs 3 % impaired 25.5 52.7 51.9 1 vs 2 1 vs 3 SDMT, oral Median 50.0 40.0 33.5 Mean SD 51.4 14.8 41.1 15.2 36.3 15.3 1 vs 2 1 vs 3 % impaired 20.1 45.4 62.5 1 vs 2 1 vs 3 TMT-A Median 29.0 38.0 43.0 Mean SD 34.6 20.4 50.5 35.4 63.0 56.6 1 vs 2 1 vs 3 % impaired 6.3 20.0 28.1 1 vs 2 1 vs 3 TMT-B Median 69.0 95.5 141.0 1 vs 2 1 vs 3 Mean SD 82.3 48.8 120.7 71.5 159.4 92.0 % impaired 6.5 17.3 37.9 1 vs 3 Block design Median 10.0 8.0 7.0 Mean SD 10.1 2.9 8.6 3.3 7.4 3.1 1 vs 2 1 vs 3 % impaired 2.0 5.8 14.7 1 vs 3 WCST Median 10.0 21.0 42.0 1 vs 3 2 vs 3* Mean SD 19.0 19.6 26.2 23.2 40.9 24.2 % impaired 16.9 24.5 51.9 1 vs 3 Abbreviation: SDMT, Symbol Digit Modalities Test. * Trend, at P .006
  • 8. 228 NEUROPSYCHOLOGIC FUNCTION AND SUPERVISION, Hart Table 5: Summary of Complementary Log-Log Regression Analysis Predicting Level of Supervision Predictor Coefficient SE z P z 95% CI Age .003 .009 0.31 .758 .014 .019 Education .222 .103 2.15 .032 .019 .424 PTA .006 .006 1.06 .289 .017 .005 LOC .001 .012 0.011 .916 .023 .026 Digit span, forward .031 .058 0.53 .596 .083 .145 Digit span, backward .107 .052 2.05 .040 .209 .005 TMT-A .012 .008 1.64 .100 .027 .002 TMT-B .006 .003 2.14 .032 .012 .001 COWAT .015 .011 0.033 .184 .007 .038 RAVLT .010 .011 0.92 .358 .012 .032 SDMT oral .000 .010 0.02 .983 .019 .020 WCST .001 .005 0.27 .789 .012 .009 Logical memory delayed .010 .011 0.90 .370 .012 .033 Constant .505 .890 0.57 .570 1.239 2.249 Abbreviations: SE, standard error; CI, confidence interval. challenging because one tends to predict more accurately in the found to be at ceiling on the SRS in the study of Hall et al,27 long run by simply using base rates, that is, predicting the most which obtained ratings on 48 subjects between 2 and 9 years commonly occurring event. Hence, our model had high sensi- after TBI. Although these findings might be interpreted as tivity (96%) and low specificity (30%) with respect to receipt indicating good outcome for groups of individuals with mod- of supervision. In other words, in samples such as this in which erate to severe TBI, we must note that, as a measure of independence is a more common outcome than supervision, community outcome after TBI, the SRS appears to be prone to statistical models such as the model under study may be most ceiling effects. Furthermore, in the present sample, the ordinal useful in ruling out patients who will be independent (ie, structure of the original scale was not completely retained. That specifying who will be supervised) as opposed to ruling in who is, we did not find progressively fewer participants in each will be independent. defined category of more intensive supervision. Further re- search may be needed to determine whether the descriptors for DISCUSSION different levels of this scale represent meaningful increments of In this sample of persons with moderate and severe TBI who caregiver burden with regard to supervision or whether other were prospectively followed and who received follow-up neu- aspects of this construct should be emphasized instead. ropsychologic evaluation within the TBIMS longitudinal The observed relationships between supervision level in project, we found 69% to be rated as independent of supervi- postacute stages of recovery and demographic factors predating sion at 1 year postinjury. This value is quite close to the 71% injury (education, race, productivity status) have not been reported previously, although premorbid factors are increas- ingly recognized as important in TBI outcome prediction.36,37 In the logistic regression analysis reported here, education was a stronger predictor than the majority of neuropsychologic measures. Level of education may be a proxy variable for general intellectual capacity, which may be called on as a “reserve” after TBI or other insult to the central nervous system. It is possible that persons with higher level of educa- tion have better preinjury executive and organizational abili- ties, thus a stronger capacity for independent function in com- munity settings and/or more capacity for developing compensatory strategies after injury. With respect to the dis- crepancy between white participants and members of ethnic minorities, supervision may simply be more available in some American subcultures that emphasize participation of extended family members in caring for ill or disabled persons. On the other hand, members of minority groups have been reported to experience less favorable outcomes from TBI compared with whites.38 A higher proportion of persons supervised at 1 year postinjury might be another reflection of that outcome discrep- ancy. We also found preinjury productivity status to be related to postinjury supervision, albeit not as strongly as education or race. One limitation of the current study is that we did not have any measure of need for assistance (or supervision) prior to injury. Thus, it is possible that at least some persons who were nonproductive at the time of injury were already in need of assistance from family members. New variables on preinjury Fig 1. ROC curve showing the model’s discrimination ability. status have been added to the TBIMS data collection protocol Arch Phys Med Rehabil Vol 84, February 2003
  • 9. NEUROPSYCHOLOGIC FUNCTION AND SUPERVISION, Hart 229 to define better the contribution of premorbid status to outcome do better with supervision, or whether some rated as supervised assessment in future research on this population. could be seen as overprotected. With respect to injury severity variables, the stronger rela- tionship between the durations of the variables reflecting al- CONCLUSION tered consciousness compared with the initial GCS was not surprising because the later in the continuum of care a variable Both preinjury characteristics and neuropsychologic vari- is collected, the more likely it is to be associated with outcome ables are important for understanding supervision received at 1 measures.39 Although unconsciousness and PTA durations did year after TBI. In persons without physical disability, the not contribute significantly to the regression model, both were assessment of cognitive function, particularly executive func- significantly different for supervised versus unsupervised per- tion, added to the prediction of supervision level. In the future, sons in the univariate analysis; independent participants had a further exploration of the scaling characteristics of the SRS mean coma about half as long as those who received supervi- would help ensure that an accurate representation of supervi- sion. sion needs is achieved. Further research on the predictors of Our hypotheses about neuropsychologic predictors of super- long-term supervision requirements from the acute hospital or vision status were only partially supported. In the univariate rehabilitation phases of recovery would help families and pro- analyses, nearly all neuropsychologic measures differentiated viders plan and budget for needed resources. Additional re- supervised from nonsupervised persons; we did not find spec- search is needed to clarify the contribution of cultural, social, ificity for measures of memory or executive function. How- and financial factors that were not addressed in the present ever, only a few measures (digit span backward, COWAT, investigation. WCST) differentiated between persons receiving moderate ver- sus heavy supervision. These measures have in common that Acknowledgments: We thank members of the TBIMS Neuropsy- they place demands on mental flexibility and working memory, chology Committee for helpful comments and suggestions during the important aspects of executive function. In the logistic regres- design of this project. sion model, which included measures of injury severity and demographic status and controlled for shared variance among References predictor variables, only digit span backward and the TMT-B 1. Thurman D, Alverson C, Dunn K, Guerrero J, Sniezek J. Trau- emerged as significant neuropsychologic predictors of super- matic brain injury in the United States: a public health perspective. vision status; only the TMT-B was straightforwardly predictive J Head Trauma Rehabil 1999;14:602-15. of supervision, however, with digits backward acting as a 2. Sander A, Kreutzer J. A holistic approach to family assessment suppressor variable. Like the COWAT, the TMT-B requires after brain injury. In: Rosenthal M, editor. Rehabilitation of the flexibility and set-shifting in addition to cognitive speed; it has adult and child with traumatic brain injury. Philadelphia: FA been shown to correlate strongly with functional outcome in Davis; 1999. p 199-216. previous studies.15,17,18 3. Ben-Yishay Y, Silver S, Piasetsky E, Rattok J. Relationship be- In the present study, memory measures did not provide tween employability and vocational outcome after intensive ho- listic cognitive rehabilitation. J Head Trauma Rehabil 1987;2(1): incremental prediction of supervision level, despite their asso- 35-48. ciation with functional outcomes in previous research.17 Mem- 4. Marsh N, Kersel D, Havill J, Sleigh J. Caregiver burden at 6 ory abilities may be less crucial to independent functioning in months following severe traumatic brain injury. Brain Inj 1998; a familiar home setting, compared with the executive functions 12:225-38. of mental flexibility and generativity that are required to plan 5. Marsh N, Kersel D, Havill J, Sleigh J. Caregiver burden at 1 year and execute actions and to adapt to unexpected changes in the following severe traumatic brain injury. Brain Inj 1998;12:1045- environment. It may be this flexibility and adaptiveness, rather 59. than the ability to learn and recall novel information, that 6. Wallace C, Bogner J, Corrigan J, Clinchot D, Mysiw W, Fugate L. allows a person to function in a familiar setting without super- Primary caregivers of persons with brain injury: life change 1 year after injury. Brain Inj 1998;12:483-93. vision. Although studies comparing the contribution of specific 7. Hawkins M, Lewis F, Mederios R. Serious traumatic brain injury: neuropsychologic skills to functional outcomes are lacking in an evaluation of functional outcomes. J Trauma 1996;41:257-63; TBI, several studies in geriatric populations suggest that exec- discussion 263-4. utive skills and visuospatial functions are more predictive of 8. Granger C, Divan N, Fiedler R. Functional assessment scales: a ability in instrumental activities of daily living than are verbal study of persons after traumatic brain injury. Am J Phys Rehabil skills, including verbal memory.40,41 1995;74:107-13. There are several limitations to the present investigation, 9. Corrigan J, Smith-Knapp K, Granger C. Outcomes in the first 5 aside from those mentioned earlier. First, only subjects were years after traumatic brain injury. Arch Phys Med Rehabil 1998; included who attended follow-up sessions in person and un- 79:298-305. 10. Knight R, Devereux R, Godfrey H. Caring for a family member derwent at least part of a battery of neuropsychologic tests. with a traumatic brain injury. Brain Inj 1998;12:467-81. Relationships between cognitive function and supervision level 11. Smith A, Schwirian P. The relationship between caregiver burden may differ in subjects who are unable or unwilling to attend and TBI survivors’ cognition and functional ability after dis- follow-ups, either because their overall level of impairment is charge. Rehabil Nurs 1998;23:252-7. too severe or because they are lost to follow-up for unknown 12. Mazaux J, Masson F, Levin H, Alaoui P, Maurette P, Barat M. reasons. Several investigations37,42 have demonstrated sources Long-term neuropsychological outcome and loss of social auton- of bias in longitudinal samples, including the TBIMS sample. omy after traumatic brain injury. Arch Phys Med Rehabil 1997; Second, this study used only 1 measure of supervision (the 78:1316-20. SRS), and thus its conclusions are limited by any limitations of 13. Hamilton B, Granger C, Sherwin F, Zielezny M, Tashman J. A uniform national data system for medical rehabilitation. In: that instrument. In particular, the SRS rating is based on the Fuhrer, editor. Rehabilitation outcomes: analysis and measure- supervision actually received by a person, rather than supervi- ment. Baltimore: Brooks; 1987. p 137-47. sion he/she may need. In the current sample, we have no way 14. Neese L, Caroselli J, Klaas P, High WM Jr, Becker L, Scheibel R. to measure needed supervision to know, for example, whether Neuropsychological assessment and the Disability Rating Scale some persons rated as independent would actually be judged to (DRS): a concurrent validity study. Brain Inj 2000;14:719-24. Arch Phys Med Rehabil Vol 84, February 2003
  • 10. 230 NEUROPSYCHOLOGIC FUNCTION AND SUPERVISION, Hart 15. Boake C, Millis SR, High WM Jr, et al. Using early neuropsy- 29. Teasdale G, Jennett B. Assessment of coma and impaired con- chologic testing to predict long-term productivity outcome from sciousness: a practical scale. Lancet 1974:2(7872):81-3. traumatic brain injury. Arch Phys Med Rehabil 2001;82:761-8. 30. Levin H, O’Donnell V, Grossman R. The Galveston Orientation 16. Sherer M, Sander AA, Nick TG, High WM Jr, Malec JF, and Amnesia Test: a practical scale to assess cognition after head Rosenthal M. Early cognitive status and productivity outcome injury. J Nerv Ment Dis 1979;167:675-84. after traumatic brain injury: findings from the TBI Model Sys- 31. Kreutzer J, Gordon W, Rosenthal M, Marwitz J. Neuropsycho- tems. Arch Phys Med Rehabil 2002;83:183-200. logical characteristics of patients with brain injury: preliminary 17. Ross S, Millis S, Rosenthal M. Neuropsychological prediction of findings from a multicenter investigation. J Head Trauma Rehabil psychosocial outcome after traumatic brain injury. Appl Neuro- 1993;8(2):47-59. 32. Heinemann A, Linacre J, Wright B, Hamilton B, Granger C. psychol 1997;4:165-70. Relationships between impairment and physical disability as mea- 18. Hanks R, Rapport L, Millis S, Deshpande S. Measures of execu- sured by the Functional Independence Measure. Arch Phys Med tive functioning as predictors of functional ability and social Rehabil 1993;74:566-73. integration in a rehabilitation sample. Arch Phys Med Rehabil 33. Stata Statistical Software. College Station (TX): Stata Corp; 2001. 1999;80:1030-7. 34. Millis S, Rosenthal M, Novack T, et al. Long-term neuropsycho- 19. Rapport L, Hanks R, Millis S, Deshpande S. Executive function- logical outcome after traumatic brain injury. J Head Trauma ing and predictors of falls in the rehabilitation setting. Arch Phys Rehabil 2001;16:343-55. Med Rehabil 1998;79:629-33. 35. Tabachnick B, Fidell L. Using multivariate statistics. Boston: 20. Hart T, Schwartz M, Mayer N. Executive function: some current Allyn & Bacon; 2001. theories and their applications. In: Varney N, Roberts R, editors. 36. Novack T, Bush B, Meythaler J, Canupp K. Outcome after trau- The evaluation and treatment of mild traumatic brain injury. matic brain injury: pathway analysis of contributions from pre- Mahwah (NJ): Lawrence Erlbaum Associates; 1999. p 133-48. morbid, injury severity, and recovery variables. Arch Phys Med 21. Girard D, Brown J, Burnett-Stolnack M, et al. The relationship of Rehabil 2001;82:300-5. neuropsychological status and productive outcomes following 37. Hall K, Wallborn A, Englander J. Premorbid history and traumatic traumatic brain injury. Brain Inj 1996;10:663-76. brain injury. NeuroRehabilitation 1998;10(1):3-12. 22. Burgess P, Alderman N, Evans J, Emslie H, Wilson B. The 38. Rosenthal M, Dijkers M, Harrison-Felix C, et al. Impact of mi- ecological validity of tests of executive function. J Int Neuropsy- nority status on functional outcome and community integration chol Soc 1998;4:547-58. following traumatic brain injury. J Head Trauma Rehabil 1996; 11(5):40-57. 23. Mazer B, Korner-Bitensky N, Sofer S. Predicting ability to drive 39. Whyte J, Cifu D, Dikmen S, Temkin N. Prediction of functional after stroke. Arch Phys Med Rehabil 1998;79:743-9. outcomes after traumatic brain injury: a comparison of 2 measures 24. Korteling J, Kaptein N. Neuropsychological driving fitness tests of duration of unconsciousness. Arch Phys Med Rehabil 2001;82: for brain-damaged subjects. Arch Phys Med Rehabil 1996;77:138- 1355-9. 46. 40. Cahn-Weiner D, Malloy P, Boyle P, Marran M, Salloway S. 25. van Zomeren A, Brouwer W, Rothengatter J, Snock J. Fitness to Prediction of functional status from neuropsychological tests in drive a car after recovery from severe head injury. Arch Phys Med community-dwelling elderly individuals. Clin Neuropsychol Rehabil 1988;69:90-6. 2000;14:187-95. 26. Boake C. Supervision Rating Scale: a measure of functional 41. Carlson M, Fried L, Xue Q, Bandeen-Roche K, Zeger S, Brandt J. outcome from brain injury. Arch Phys Med Rehabil 1996;77:765- Association between executive attention and physical functional 72. performance in community-dwelling older women. J Gerontol B 27. Hall K, Bushnik T, Lakisic-Kazazic B, Wright J, Cantagallo A. Psychol Sci Soc Sci 1999;54:S262-70. Assessing traumatic brain injury outcome measures for long-term 42. Corrigan J, Bogner J, Mysiw J, Clinchot D. Systematic bias in follow-up of community-based individuals. Arch Phys Med Re- outcome studies of persons with traumatic brain injury. Arch Phys habil 2001;82:367-74. Med Rehabil 1997;78:132-7. 28. Dabmer E, Shilling M, Hamilton B, et al. A model systems database for traumatic brain injury. J Head Trauma Rehabil 1993; Supplier 8(2):12-25. a. Stata Corp, 4905 Lakeway Dr, College Station, TX 77845. Arch Phys Med Rehabil Vol 84, February 2003