Studying Twitter conversations as (dynamic) graphs: visualization and structural comparison
•
1 j'aime•755 vues

Recommandé

Recommandé
Contenu connexe
En vedette
Similaire à Studying Twitter conversations as (dynamic) graphs: visualization and structural comparison
Similaire à Studying Twitter conversations as (dynamic) graphs: visualization and structural comparison (20)
Plus de Cornelius Puschmann
Plus de Cornelius Puschmann (20)
Studying Twitter conversations as (dynamic) graphs: visualization and structural comparison
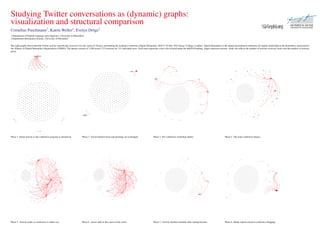
- 1. Studying Twitter conversations as (dynamic) graphs: visualization and structural comparison Cornelius Puschmann1, Katrin Weller2, Evelyn Dr¨ ge o 2 1:Department of English Language and Linguistics, University of D¨ sseldorf u 2:Department Information Science, University of D¨ sseldorf u The eight graphs shown describe Twitter activity (specifically retweets) over the course of 30 days surrounding the academic conference Digital Humanities 2010 (7-10 July 2010, King’s College, London). Digital Humanities is the annual international conference for digital scholarship in the humanities, sponsored by the Alliance of Digital Humanities Organisations (ADHO). The dataset consists of 3,300 tweets (733 retweets) by 331 individual users. Each node represents a user who tweeted under the #dh2010 hashtag. Edges represent retweets. Node size reflects the number of retweets received; node color the number of retweets given. digihums2010 ernestopriego tildensky redgen jmvieira neh_odh ttasovac melissaterras brettbobley txtcraigbellamy nowviskie trevormunoz langstat projectcarare center21 kevinbgunn raffazizzi simontanner seth_denbo mr56k epriani madaiqu nowviskie palaeofuturist clairey_ross publichistorian unsworth jmvieira tildensky brettbobley mr56k melissaterras trevormunoz ernestopriego digihums2010 ucldh melissaterras knagasaki langstat sphericalfruit huronferret mr56k center21 koffer lewisrichard costisd redgen meg_stewart priddy eberlesinatra jmcclurken timonette toughloveforx lewisrichard hallymk1 hamccull neh_odh kathodonnell davidbeavan frostdavis andrewmurphie