1. www.colliers.com/houston
Q4 2012 | OFFICE MARKET
RESEARCH & FORECAST REPORT
HOUSTON OFFICE MARKET
HOUSTON’S HOT ECONOMY BOOSTS OFFICE LEASING,
SALES, AND DEVELOPMENT ACTIVITY
Houston’s strong job growth boosted office leasing in 2012. Fourth quarter
leasing activity reached 2.4 million SF, pushing the year-end total to over 12.2
million SF. The Houston metropolitan area added 85,300 jobs between
November 2011 and November 2012, an annual increase of 3.2% over the prior
year’s job growth. Further, Houston’s unemployment fell to 5.8% from 7.3%
one year ago, which bolstered annual Houston area home sales by 27.9%.
Expansion in the energy industry has driven demand for new office
development as tenants find it harder to locate blocks of quality office space.
Currently, over 4.2 million SF of office space is under construction and
approximately 50.0% of it is pre-leased. A complete list of properties under
construction can be found on page 7 of this report.
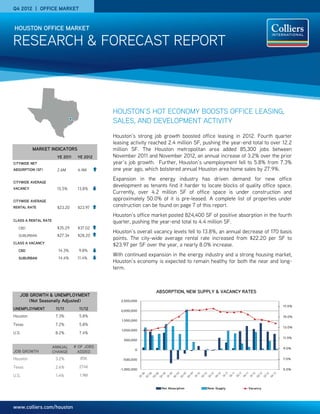
Houston’s office market posted 824,400 SF of positive absorption in the fourth
quarter, pushing the year-end total to 4.4 million SF.
Houston’s overall vacancy levels fell to 13.8%, an annual decrease of 170 basis
points. The city-wide average rental rate increased from $22.20 per SF to
$23.97 per SF over the year, a nearly 8.0% increase.
With continued expansion in the energy industry and a strong housing market,
Houston’s economy is expected to remain healthy for both the near and long-
term.
MARKET INDICATORS
YE 2011 YE 2012
CITYWIDE NET
ABSORPTION (SF) 2.6M 4.4M
)
CITYWIDE AVERAGE
VACANCY 15.5% 13.8%
CITYWIDE AVERAGE
RENTAL RATE $23.20 $23.97
CLASS A RENTAL RATE
CBD $35.29 $37.02
SUBURBAN $27.34 $28.20
CLASS A VACANCY
CBD 14.3% 9.8%
SUBURBAN 14.4% 11.4%
ABSORPTION, NEW SUPPLY & VACANCY RATES
UNEMPLOYMENT 11/11 11/12
Houston 7.3% 5.8%
Texas 7.2% 5.8%
U.S. 8.2% 7.4%
JOB GROWTH
ANNUAL
CHANGE
# OF JOBS
ADDED
Houston 3.2% 85K
Texas 2.6% 274K
U.S. 1.4% 1.9M
JOB GROWTH & UNEMPLOYMENT
(Not Seasonally Adjusted)
5.0%
7.0%
9.0%
11.0%
13.0%
15.0%
17.0%
-1,000,000
-500,000
0
500,000
1,000,000
1,500,000
2,000,000
2,500,000
Net Absorption New Supply Vacancy
2. RESEARCH & FORECAST REPORT | Q4 2012 | HOUSTON OFFICE MARKET
$26.00
$28.00
$30.00
$32.00
$34.00
$36.00
$38.00
$40.00
CLASS A OFFICE RENTS
CBD RENTS SUBURBAN RENTS
4.0%
6.0%
8.0%
10.0%
12.0%
14.0%
16.0%
18.0%
20.0%
CBD VS. SUBURBAN
CLASS A OFFICE VACANCY
CBD VACANCY SUBURBAN VACANCY
QUOTED GROSS RENTAL RATES FOR TOP PERFORMING OFFICE BUILDINGS
BUILDING NAME ADDRESS SUBMARKET RBA (SF)
YEAR
BUILT
LEASED
AVAIL.
SF
RENT
($/SF)
OWNER
717 Texas 717 Texas CBD 696,228 2003 100% 67,509 $43.79 Hines
5 Houston Center 1401 McKinney St CBD 600,000 2002 97.4% 28,500 $43.66 Wells Real Estate Funds
1000 Main 1000 Main St CBD 837,161 2003 98.3% 22,420 $42.00 INVESCO Realty Advisers, Inc.
Heritage Plaza 1111 Bagby CBD 1,089,266 1986 99.3% 360,917 $41.94 Brookfield Office Properties
BG Group Place 811 Main CBD 972,474 2011 77.2% 221,440 $41.87 CalPERS/Hines
Wells Fargo Bank Tower 1300 Post Oak Blvd.
West Loop/
Galleria
491,254 1983 98.4% 8,071 $40.15 TIAA-CREF
Williams Tower 2800 Post Oak Blvd
West Loop/
Galleria
1,476,973 1983 98.9% 16,926 $40.66 Hines REIT
9 Greenway Plaza 9 Greenway Greenway 746,824 1978 95.7% 37,455 $32.90 Crescent Real Estate Equities
Two Eldridge Place 757 N Eldridge Pky Katy Freeway 280,322 1986 98.3% 11,882 $34.45 Behringer Harvard REIT I, Inc.
San Felipe Plaza 5847 San Felipe St
San
Felipe/Voss
980,472 1984 89.0% 136,891 $37.92 Thomas Properties Group, L.P.
One BriarLake Plaza
2000 W Sam
Houston Parkway
Westchase 502,410 2000 100.0% 26,910 $44.55 Behringer Harvard Holdings
Waterway Plaza II
10001 Woodloch
Forest Dr
The Woodlands 142560 2001 100.0% 56,826 $38.58 The Lionstone Group
Note: Avail. SF includes direct and sublet space.
Source: CoStar Property
2COLLIERS INTERNATIONAL | P.
VACANCY & AVAILABILITY
Houston’s average vacancy rate and the
average suburban vacancy rate both
decreased by 40 basis points to 13.8% from
14.2% on a quarterly basis. The average
CBD vacancy rate decreased by 20 basis
points to 13.7% from 13.9% between
quarters. On a year-over-year basis, the
city-wide vacancy rate decreased by 170
basis points to 13.8% from 15.5%. The
average suburban vacancy rate decreased
by 150 basis points to 13.8% from 15.3%, and
the average CBD vacancy rate decreased by
290 basis points to 13.7% from 16.6%.
The CBD Class A vacancy rate decreased by
80 basis points to 9.8% from 10.6% between
quarters, while the CBD Class B vacancy rate
increased 220 basis points to 20.2% from
18.0%. The suburban Class A and B vacancy
rates both decreased by 60 basis points
between quarters to 11.4% from 12.0% and to
16.1% from 16.5%, respectively.
Of the 1,707 buildings in the Houston office
market, only 43 have 100,000 SF of
contiguous space available for lease or
sublease. Further, only 13 have 200,000 SF
of contiguous space available.
Available sublease space citywide totals 3.2
million SF or 1.7% of total inventory, of which
1.1 million SF is currently vacant.
ABSORPTION & DEMAND
Houston recorded positive net absorption of
824,400 SF in the fourth quarter, pushing the
year-end absorption total to 4,426,000 SF.
Contributing to the fourth quarter’s positive
gain was suburban Class A space with
positive net absorption of 403,000 SF,
followed by CBD Class A space with positive
net absorption of 244,800 SF. Some of the
larger tenants that moved into their space or
expanded into additional space during the
third quarter include Seadrill relocating to
64,400 SF in Two Westway from 23,600 SF
in Westway One, and several expansions
including: Wells Fargo (35,000 SF in Wells
Fargo Plaza), Wood Mackenzie, Inc. (expanded
to 51,919 SF from 28,986 in San Felipe
Plaza), Superior Energy Services (15,165 SF
in 13333 Northwest Freeway), and Gregg &
Valby, LLP (14,000 SF in 1700 West Loop S).
RENTAL RATES
The average citywide rental rate increased
slightly between quarters increasing to
$23.97 from $23.61 per square foot. The
CBD Class A average quoted rental rate
increased to $37.02 from $36.85 per square
foot, while the suburban Class A average
quoted rental rate increased to $28.20 from
$27.31 per square foot.
The CBD Class B average quoted rental rate
increased to $25.00 from $24.00 per square
foot, while the suburban Class B average
quoted rental rate increased to $18.75 from
$18.74 per square foot between quarters.
3. RESEARCH & FORECAST REPORT | Q4 2012 | HOUSTON OFFICE MARKET
Q4 2012 SIGNIFICANT SALES TRANSACTIONS – (100,000 SF or greater)
BUILDING NAME
SUB-
MARKET
RBA (SF)
YEAR
BUILT
BUYER SELLER
SALE
PRICE
$/SF
CAP
RATE
CLOSED
KBR Tower CBD 1,047,748 1973
Corporate Property
Associates 17 Global, Inc.
Brookfield Office
Properties & KBR, Inc.
$175M $167 6.80% 11/2012
1800 West Loop S.
West Loop/
Galleria
406,634 1982
KBS Strategic
Opportunity REIT
Pearlmark Real Estate
Partners
$69M $168 7.00% 12/2012
West Loop I & II Bellaire 313,873 1980
KBS Strategic
Opportunity REIT
Chase Merritt $36M $117 N/A 12/2012
Reserve at Park
Ten
Katy Fwy 145,000 2009 CapLease, Inc.
Principal Global
Investors
$35.5M $245 8.20% 12/2012
Woodway Tower
West Loop/
Galleria
119,127 1979 Donerail Corporation Fidelis Realty Partners $13M $146 8.00% 10/2012
3COLLIERS INTERNATIONAL | P.
SALES ACTIVITY
Houston’s office investment sales activity increased between quarters with 33 properties changing hands, compared to 21 in the
previous quarter. According to CoStar Comps, Houston office total transaction sales volume was approximately $908 million, averaging
$200 per SF. Some of the more significant transactions that closed during the fourth quarter are listed below.
LEASING ACTIVITY
Houston’s office leasing activity reached 2.4 million SF in the fourth quarter, pushing the year-end total to over 12.2 million SF.
Below is a list of Q4 2012 top lease transactions.
1
Renewal
2
Expansion
3
Sublease
4
Pre-lease/under construction
Building name/address Submarket SF Tenant Lease date
Energy Crossing II Katy Freeway 127,000 Modec International4
Oct-12
8 West Centre Katy Freeway 119,000 Helix Energy Solutions Group4
Nov-12
3555 Timmons Ln Greenway 65,000 Houston-Galveston Area Council 1 Nov-12
One Hughes Landing The Woodlands 51,152 Layne Christensen4 Nov-12
Memorial 6 Center Katy Freeway 34,013 Expro Americas1 Nov-12
8584 Katy Freeway Katy Freeway 33,922 IHS Global, Inc.1 Oct-12
Pennzoil Place North CBD 31,879 Seyfarth Shaw Nov-12
San Felipe Plaza West Loop/Galleria 51,919 Wood Mackenzie, Inc.1,2 Nov-12
One Riverway West Loop/Galleria 20,000 Harper & Pearson1 Nov-12
1800 West Loop West Loop/Galleria 20,000 Quanex Building Nov-12
1442 Lake Front Circle The Woodlands 18,819 Shrieve Chemical Company Oct-12
Memorial 6 Center Katy Freeway 18,275 Deep Gulf Energy, LP1 Oct-12
11111 Wilcrest Green Dr Westchase 18,065 Othon, Inc., Consulting Engineers1 Oct-12
7141 Office City Dr Gulf Freeway/Pasadena 17,852 General Services Administration Oct-12
Decorative Center of Houston West Loop/Galleria 17,356 PreCash, Inc. Oct-12
Dairy Ashford Plaza Katy Freeway 17,287 Resurgent Capital Services, LP Oct-12
13333 Northwest Freeway Northwest 15,165 Superior Energy Services2 Nov-12
BBVA Compass Plaza West Loop/Galleria 15,000 Worldwide Machinery4 Nov-12
1700 West Loop S West Loop/Galleria 13,732 Gregg & Valby, LLP2 Oct-12
Q4 2012 Top Office Leases
7. RESEARCH & FORECAST REPORT | Q4 2012 | HOUSTON OFFICE MARKET
OFFICE DEVELOPMENT PIPELINE
Houston’s construction pipeline continues to expand with 4.4 million SF currently under construction. The table below includes buildings
80,000 SF or larger.
HOUSTON SUBURBAN OFFICE MARKET SUMMARY - CONTINUED
Building Name Address Submarket SF Pre-Leased Developer Est. Delivery
Anadarko Tower 2 1201 Lake Robbins Dr The Woodlands 550,000 100.00% Patrinely Group Inc Apr-14
Energy Tower III 11740 Katy Freeway Katy Freeway 428,831 0.00% Mac Haik Realty LLC Jan-14
Energy Crossing II 15011 Katy Freeway Katy Freeway 321,508 64.90% Opus Corporation Aug-13
Murphy Exploration 9805 Katy Freeway Katy Freeway 320,000 100.00% MetroNational Corp Nov-13
BBVA Compass 2200 Post Oak Blvd Galleria/Uptown 306,012 65.40% Redstone and Stream Apr-13
3009 Post Oak Blvd. 3009 Post Oak Blvd Galleria/Uptown 302,536 0.00% Skanska Commercial
Development
Jul-13
Research Forest Lakeside 4 2445 Technology Forest Blvd The Woodlands 300,000 50.00% Warmack Investments Apr-13
Granite Briarpark Green 3151 Briarpark Dr Westchase 299,664 2.10% Granite Properties Jul-13
3 Waterway Square Place 3 Waterway Ave The Woodlands 232,693 90.30% The Woodlands Development
Company, L.P.
Jun-13
8 West Centre 3505 W Sam Houston Pky N Katy Freeway 228,000 52.60% CORE Parkway Central, Ltd Jul-13
One Hughes Landing Grogan's Mill Rd The Woodlands 197,841 28.20% The Woodlands Development
Company, L.P.
Sep-13
17320 Katy Freeway 17320 Katy Freeway Katy Freeway 182,000 1.10% Transwestern Dec-13
Sam Houston Crossing II 10344 Sam Houston Pky N Northwest Far 159,056 0.00% Duke Realty May-13
Mason Creek Office Center 21420 Merchants Way Katy Freeway 135,716 0.00% Myers, Crow & Saviers Apr-13
Blvd Place 1 1 Blvd Place Galleria/Uptown 130,916 56.60% Wulfe & Co. Oct-13
CityCentre Four 840 W Sam Houston Pky N Katy Freeway 120,052 52.80% Midway Companies Jun-13
Haliburton North Campus Bldg Milner Rd & N Sam Houston Pky North Belt/Greenspoint 100,000 100.00% Haliburton Jan-13
Blvd Place 2 2 Blvd Place Galleria/Uptown 80,002 0.00% Wulfe & Co. Jun-14
Vacancy Rental Rate
Class # of Bldgs. Total (SF) (SF) Rate (%) (SF) Rate (%) Total (SF) Q4-2012 Q3-2012 Q4-2012 YTD-2012
AVG
($/SF)
West Loop/Galleria
A 33 14,173,964 1,349,066 9.5% 39,369 0.3% 1,388,435 9.8% 10.0% 24,684 170,832 $31.39
B 58 7,298,163 1,200,590 16.5% 12,617 0.2% 1,213,207 16.6% 16.9% 12,155 99,861 $23.49
C 3 147,042 1562 1.1% 0 0.0% 1,562 1.1% 0.3% -1,129 -1,562 $18.79
Total 94 21,619,169 2,551,218 11.8% 51,986 0.2% 2,603,204 12.0% 12.2% 35,710 269,131 $27.93
Westchase
A 22 6,798,460 399,509 5.9% 9,620 0.1% 409,129 6.0% 7.8% 123,216 506,669 $34.20
B 59 6,218,685 782,040 12.6% 10,468 0.2% 792,508 12.7% 13.8% 17,000 135,450 $18.52
C 6 281,047 77,228 27.5% 0 0.0% 77,228 27.5% 26.5% -2,613 -32,840 $18.32
Total 87 13,298,192 1,258,777 9.5% 20,088 0.2% 1,278,865 9.6% 11.0% 137,603 609,279 $26.81
The Woodlands
A 16 3,198,900 28,606 0.9% 0 0.0% 28,606 0.9% 2.1% 36,167 97,842 $35.51
B 67 3,478,778 318,034 9.1% 17,238 0.5% 335,272 9.6% 10.7% 37,680 254,378 $21.48
C 5 341,192 0 0.0% 0 0.0% 0 0.0% 0.0% 0 918 -
Total 88 7,018,870 346,640 4.9% 17,238 0.2% 363,878 5.2% 6.3% 73,847 353,138 $24.54
Inventory Direct Vacancy Sublease Vacancy Vacancy Rate (%) Net Absorption (SF)
8. RESEARCH & FORECAST REPORT | Q4 2012 | HOUSTON OFFICE MARKET
Accelerating success.
COLLIERS INTERNATIONAL | HOUSTON
1300 Post Oak Boulevard
Suite 200
Houston, Texas 77056
Main +1 713 222 2111
8COLLIERS INTERNATIONAL | P.
LISA R. BRIDGES
Director of Market Research Houston
Direct +1 713 830 2125
Fax +1 713 830 2118
lisa.bridges@colliers.com