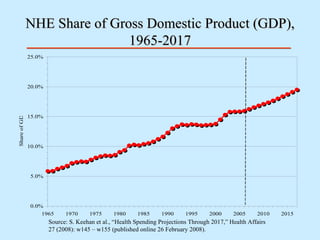
1. NHE Share of Gross Domestic Product (GDP), 1965-2017 Source: S. Keehan et al., “Health Spending Projections Through 2017,” Health Affairs 27 (2008): w145 – w155 (published online 26 February 2008).
2. Health Spending Projections Through 2017 Sean Keehan, Andrea Sisko, Christopher Truffer, Sheila Smith, Cathy Cowan, John Poisal, M. Kent Clemens, Kevin Lyons, and Jonathan Cylus Office of the Actuary Centers for Medicare and Medicaid Services February 25, 2008
3.
4. Growth in National Health Expenditures (NHE) vs. Growth in Gross Domestic Product (GDP), 1980-2017 Source: S. Keehan et al., “Health Spending Projections Through 2017,” Health Affairs 27 (2008): w145 – w155 (published online 26 February 2008).
5. NHE Share of Gross Domestic Product (GDP), 1965-2017 Source: S. Keehan et al., “Health Spending Projections Through 2017,” Health Affairs 27 (2008): w145 – w155 (published online 26 February 2008).
6. Growth in Health Spending by Public and Private Payers, 1990-2017 Public Private Source: S. Keehan et al., “Health Spending Projections Through 2017,” Health Affairs 27 (2008): w145 – w155 (published online 26 February 2008).
7. Hospital Spending Growth, 1980-2017 Source: S. Keehan et al., “Health Spending Projections Through 2017,” Health Affairs 27 (2008): w145 – w155 (published online 26 February 2008).
8. Growth in Prescription Drug Spending, 1980-2017 Source: S. Keehan et al., “Health Spending Projections Through 2017,” Health Affairs 27 (2008): w145 – w155 (published online 26 February 2008).
9. Growth in Medicare Spending and Share of NHE, 1980-2017 Source: S. Keehan et al., “Health Spending Projections Through 2017,” Health Affairs 27 (2008): w145 – w155 (published online 26 February 2008). 0.0% 5.0% 10.0% 15.0% 20.0% 25.0% 1980 1985 1990 1995 2000 2005 2010 2015 Share of NHE 0.0% 5.0% 10.0% 15.0% 20.0% 25.0% Annual Growth Rate
10. Projected National Health Expenditures ($ billions) under Current Law and 0.0 Percent Medicare Physician Payment Update Scenario, Selected Years 2007-2017 Source: S. Keehan et al., “Health Spending Projections Through 2017,” Health Affairs 27 (2008): w145 – w155 (published online 26 February 2008). Note: The Medicare Current Law expenditure projections reflect the direct impact of the substantial reductions in physician payment rates that would be required under the current-law sustainable growth rate (SGR) provisions. Secondary SGR impacts on Parts A, B, and D are not reflected; accordingly, these projections do not represent our best estimate of the actual Medicare expenditures that would result under current law. Such secondary impacts could include (i) substantially reduced beneficiary access to physician services, (ii) a significant shift in enrollment to Medicare Advantage plans, (iii) an increase in emergency room services, (iv) an increase in mortality rates, and/or (v) an increase in hospital services. We have excluded secondary impacts because of their speculative nature, the minimal likelihood that the physician payment reductions will occur in practice, and to retain the usefulness of the current-law baseline for hospital and other non-physician expenditure categories. 25.3% 21.4% 17.0% 11.9% 6.2% 4.2% 0.0% Percent Difference 165.8 147.4 132.2 118.9 108.2 102.5 98.0 Medicare Physician Current Law $207.8 $178.9 $154.6 $133.1 $114.9 $106.8 $98.0 Medicare Physician 0% Update Scenario 6.4% 5.5% 4.5% 3.2% 1.6% 1.0% 0.0% Percent Difference 884.0 758.8 656.4 568.5 495.0 460.7 427.3 Total Medicare Current Law $940.2 $800.6 $685.6 $586.4 $502.7 $465.3 $427.3 Total Medicare 0% Update Scenario 2017 2015 2013 2011 2009 2008 2007 Spending Category and Scenario
11. Projected National Health Expenditures ($ billions) under Current Law and 0.0 Percent Medicare Physician Payment Update Scenario, Selected Years 2007-2017 Source: S. Keehan et al., “Health Spending Projections Through 2017,” Health Affairs 27 (2008): w145 – w155 (published online 26 February 2008). Note: The Medicare Current Law expenditure projections reflect the direct impact of the substantial reductions in physician payment rates that would be required under the current-law sustainable growth rate (SGR) provisions. Secondary SGR impacts on Parts A, B, and D are not reflected; accordingly, these projections do not represent our best estimate of the actual Medicare expenditures that would result under current law. Such secondary impacts could include (i) substantially reduced beneficiary access to physician services, (ii) a significant shift in enrollment to Medicare Advantage plans, (iii) an increase in emergency room services, (iv) an increase in mortality rates, and/or (v) an increase in hospital services. We have excluded secondary impacts because of their speculative nature, the minimal likelihood that the physician payment reductions will occur in practice, and to retain the usefulness of the current-law baseline for hospital and other non-physician expenditure categories. 3.1% 2.6% 2.0% 1.4% 0.8% 0.5% 0.0% Percent Difference 840.0 753.6 675.1 601.0 532.8 501.7 473.0 Total Physician Current Law $866.2 $773.0 $688.8 $609.7 $536.9 $504.4 $473.0 Total Physician 0% Update Scenario 0.7% 0.6% 0.5% 0.4% 0.2% 0.1% 0.0% Percent Difference 4,277.1 3,757.0 3,305.0 2,905.1 2,555.1 2,394.3 2,245.6 Total NHE Current Law $4,308.7 $3,780.5 $3,321.7 $2,915.9 $2,560.0 $2,397.4 $2,245.6 Total NHE 0% Update Scenario 2017 2015 2013 2011 2009 2008 2007 Spending Category and Scenario
12. Growth in Medicaid Spending, 1980-2017 Source: S. Keehan et al., “Health Spending Projections Through 2017,” Health Affairs 27 (2008): w145 – w155 (published online 26 February 2008).
13. Growth in Private Health Insurance (PHI) Premiums and Benefits Per Enrollee, 1980-2017 Source: S. Keehan et al., “Health Spending Projections Through 2017,” Health Affairs 27 (2008): w145 – w155 (published online 26 February 2008). Premiums per enrollee Benefits per Enrollee
14. Growth in Out-of-Pocket (OOP) Spending, 1980-2017 Source: S. Keehan et al., “Health Spending Projections Through 2017,” Health Affairs 27 (2008): w145 – w155 (published online 26 February 2008).
15. Payer trends, 2006 and 2017 2017 2006 OOP 11% PHI 33% OOP 12% PHI 34% Other Private 7% Medicare 19% Medicaid 15% Other Public 12% Note: Totals may not sum to 100 due to rounding. Source: CMS, Office of the Actuary, National Health Statistics Group. Other Private 7% Medicare 21% Medicaid 17% Other Public 11%